Critical Analysis of Traditional Size Estimation Metrics
for Object Oriented Programming
Meenakshi Kandpal
M.Tech (Computer Science) Uttarakhand Technical University, IndiaAnmol Kandpal
Assistant ManagerProjects & Technical Department, NALCO, India
ABSTRACT
The accuracy of an estimate is always questionable. Lots of efforts have been put to make an estimate more accurate. In case of a software project, the accuracy of estimate is dependent on the correctness of size estimation. Size is a critical factor in determining cost, schedule, and effort. Poor size estimation may lead to budget overruns and late deliveries, which decreases the confidence of customer and erodes the image of developer. Traditional size estimation methods generally used are source lines-of-code, function point, object points etc. However, traditional size metrics have limitations and are not compatible with newer rapid prototyping and object-oriented approaches of software development. This paper critically analyzes the lacunas of traditional methods and introduces Object oriented metrics for effective size estimation for Object Oriented Software.
General Terms
Traditional Software Metric, Object Oriented Metric, size, attributes.
1.
INTRODUCTION
Estimation is one of the most important activities that is done in the preliminary stages of software development. Software size plays a crucial role in this process as it forms the base for deriving number of metrics used to measure various aspects of the software, throughout the development cycle of a software product. Properties of any software product can be quantified in terms of internal and external attributes [14]. The properties which can be measured in terms of the product itself, i.e. independent from its behavior are defined as internal attributes. Examples of internal attributes are structural properties like size, complexity, cohesion, and coupling. Whereas, the properties which can be measured with respect to how the product relates to its environment are termed as external attributes. Examples of external attributes are reliability, understandability, and maintainability.
Measuring external attributes directly requires additional information about the environment, besides the product itself. Hence, they are hard to quantify and also can be measured directly only after some time the product is created. Due to above reason, models has been established for correlating external attribute measures with the internal attribute ones. Software size is a type of internal attributes, and has been used in computing the effort and cost in various cost models [2, 12]. Thus, size evaluation is one of the main tasks for planning software project development with reliable cost and effort estimations.
Cost associated with developing proposed software application
Efforts required of programmers in terms of units of software produced per unit of project time.
Time required for the project completion & delivery. There are various traditional software size metrics like heuristics based on experience, Line of Code, Function point, software size, object point etc. used for size estimation. However, these metrics have major drawbacks when used for object-oriented approaches of software development. Object-oriented programming has many useful features, such as information hiding, encapsulation, inheritance, polymorphism and dynamic binding. These object-oriented features facilitate software reuse and component-based development. This paper analyzes the popular traditional software metrics to identify the limitations of traditional software size metrics in terms of various attributes of Software product development and proposes the OO metrics as an effective alternative measure.
2.
TRADITIONAL SIZE METRICS
Various Traditional software size metrics like Line of code, Function point analysis, Software size, Extension of function point, Object point etc are used. Among all the methods Line of Code and function point are the most popular metrics. A brief description of both the metrics along with their limitations are as follows:
2.1
Line of Code:
The Line of code is the oldest, simplest and most widely used metrics for calculation of program size. It counts the ‘Number of Instructions’ of a program excluding comments and blank lines in terms of SLOC (Source Lines Of Code). SLOC is a key input for estimating project effort and is also used to calculate productivity and other measurements.
Lines of code are programming language dependent. In order to estimate the LOC, the problem is divided into modules and these modules are then further into sub modules, this process continues till the size of leaf- level module is estimated. This requires a lot of past experience in similar projects. Another alternative measures for SLOC are KLOC (Thousands of Lines of Code), KDSI (Thousands of Delivered Source Instructions), NCLOC (Non-Comment Lines of Code), and Number of Characters or Number of Bytes.
2.1.1
Limitations of Line of Code
a) Lack of Accountability: The accuracy of Line of code is very less as it measures the productivity of a development project with the outcome of only one of the phases i.e the coding phase.
of the time. Hence, it is impossible to account for the codes that are automatically generated in this case. This difference invites huge variations in productivity and thereby making the Lines of Code more and more irrelevant in the context of GUI-based languages/tools c) Lack of Cohesion with Functionality: LOC does not
depend upon the various functions or features of a software, that means functionality is less correlated with LOC i.e same functionality may be developed by a skilled developer with lesser codes, which implies that more functionality may be exhibited by a program having less LOC than another similar program. Hence, LOC is a poor productivity measure of individuals. d) Early stage development is not possible: It’s very
difficult to estimate LOC at the beginning of a project, due to lack of information and requirements.
e) Developer’s Experience: Implementation of a specific logic varies based on the level of experience of the developer. Hence, number of lines of code differs from person to person. A certain functionality may be implemented by an experienced developer in fewer lines of code than the other having relatively less experience, though they use the same language.
f) Problem with multiple Languages: The platform of programming languages is Very vast. Different languages are used based on the various complexity and requirements. As a result of this, tracking and reporting of productivity and defect rates poses a serious problem. For e.g if we are developing the two applications that provide the same functionality. One of the applications is written in C and the other application is written in java. The LOC required to develop the application would entirely be different. As well as, the amount of effort required to develop the application would also vary to a large extent.
g) Far from Object Oriented Development: In the case of Object-Oriented development, Line of Code is of no use as everything is treated in terms of Objects and classes.
h) Lack of Counting Standards: There is no standard defined for counting the declarations, statements and compiler directives of a language in LOC. Different languages are introduced every year in the software industry. So it becomes very difficult to calculate LOC without standardisation.
2.2
Function Point Size Estimates
Function Point Analysis is one of the best methods in traditional metrics for measuring the size of a software. The conceptual idea behind the function point metric is that the size of a software product is directly dependent on the number of different functions or features it supports. A software product supporting many features would certainly be of larger size than a product with less number of features. Function points represent logical size, as opposed to physical size (like SLOC or objects).
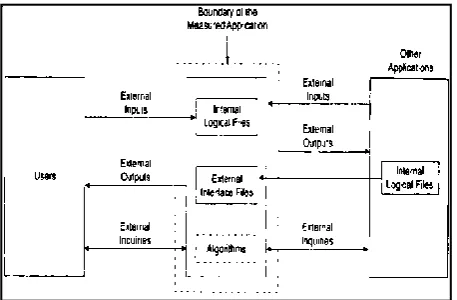
[image:2.595.316.545.81.231.2]A graphical representation of functional point analysis is shown in the figure 1.0.
Figure 1.0 – Graphical Representation of Function Point Analysis
For calculation of Function point, Unadjusted Function point and Value Adjustment Factor need to be calculated.
In order to count Total Number of Unadjusted Function Point, following five categories of functions are proposed by Albrecht:
i) External Inputs: It consists of all the data entering the system from external sources and triggering the processing of data. Individual data items input by the user are not considered in the calculation of the number of inputs, but a group of related inputs are considered as a single input.
ii) External Outputs:It consists of all the data processed by the system and sent outside the system. Data that is printed on a screen or sent to a printer including a report, an error message, and a data file is counted as an external output. While outputting the number of outputs the individual data items within a report are not considered, but a set of related data items is counted as one input iii) External Inquiries: Number of inquiries is the number
of distinct interactive queries which can be made by the users. These inquiries are the user commands which require specific action by the system
iv) External Interfaces: Here the interfaces considered are the interfaces used to exchange information with other systems.
v) Internal Files: Each logical file is counted. A logical file means groups of logically related data. Thus, logical files can be data structures or physical files.
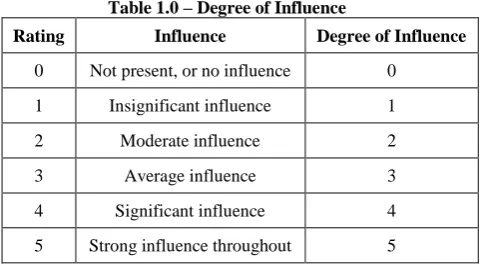
Table 1.0 – Degree of Influence
Rating Influence Degree of Influence
0 Not present, or no influence 0
1 Insignificant influence 1
2 Moderate influence 2
3 Average influence 3
4 Significant influence 4
5 Strong influence throughout 5 Total degrees of influence (DI), is sum of the fourteen General Application characteristics, i.e
Degree of Influence =
14
1
i
General Application Characteristics[i]
Then Value adjustment factor is calculated by following formula
VAF = 0.65 + 0.01* DI
The VAFis now used to modify the size of the system to give the overall size in function points by using equation:
Total Adjusted Function Point = UFP* VAF
[image:3.595.53.296.84.217.2]The above process of calculation is summarized in Table 2.0.
Table 2.0 – Calculation of Function point
Type of Components Complexity of Components
Low Average High Total
External Inputs _ X 3 = _ X 4 = _ X 6 = External Outputs _ X 4 = _ X 5 = _ X 7 = External Inquiries _ X 3 = _ X 4 = _ X 6 = External Logical Files _ X 7 = _ X 10 = _ X 15 = External Interface Files _ X 5 = _ X 7 = _ X 10 = Total Number of Unadjusted Function Points Multiple Value Adjustment Factor Total Adjusted Function Points
2.2.1
Limitations of Function Point Analysis
a) Requires Manual Work: Counting process can’t be automated as Function Points have to be counted manually.
b) Necessitates Significant Level of Detail: In function point analysis, lots of details are required to estimate size of the software. In order to perform FPA accurately, information on inputs, outputs, screens, database tables, and even records and fields will be required. Typically this is not the case with any development project where the requirements are not clear to this level of detail, in the beginning.
c) Requires Experience: A fairly well experience is required for Function Point Analysis. Also it requires sufficient knowledge of the counting rules, which are difficult to understand
3
WHY OBJECT ORIENTED METRICS
INTRODUCED?
The recent trend of using Object Oriented practices tend to rethink the way developers have been estimating the size of their development projects. Traditional software measurement techniques have proven unsatisfactory for measuring productivity and predicting effort. There are many aspects that an Object Oriented metric must have if it has to provide accurate effort prediction. Also, it is important to include information about communication between objects and reuse through inheritance in the ‘size’ as well.
Unlike traditional metrics, which are based on the data and procedure model of structured analysis, Object Oriented metrics are based on the objects and their characteristics. The limitations of traditional methods, when applied to Object Oriented solution are that, they tend to measure only one aspect of the software i.e the functionality. Functionality is required when effort is need to be predicted. However, considering only this aspect, particularly in a well-designed OO solution is not sufficient, as in addition to functionality, a level of complexity is also added to the software that depends on the amount of communication between the objects in the system. Another important aspect of object-oriented size is reuse through inheritance. A good object-oriented analysis involves identifying groups of objects (actors) whose behaviors are similar, number of classes and number of methods.
The primary objectives for Object Oriented metrics are no different than those for metrics derived for conventional software and aims at:
• To better understand the quality of the product • To assess the effectiveness of the process
a) Weighted Methods per Class (WMC), b) Response sets for Class (RFC), c) Lack of Cohesion in Methods (LCOM), d) Coupling Between Object Classes (CBO), e) Depth of Inheritance Tree of a class (DIT) and f) Number of Children of a class (NOC).
The theoretical validation of CK metrics is given by [20]. Also CK metrics have been validated by several experimental studies for e.g. (12, 15 and 16).
The metrics defined by Lorenz et al. [8] is to measure the static characteristics of software design. These metrics are divided in the categories of class size, class inheritance and class internal. Counts of attributes & operations are the main focus of Size-oriented metrics for the object-oriented classes. Inheritance-oriented metrics focus on the manner in which operations are reused in hierarchy class and the internal class-oriented metrics look at cohesion and code-class-oriented issues. The MOOD metric, proposed by Abreu [3], is used to measure the various features of object-oriented design methods such as Inheritance- MIF (Method Inheritance Factor), AIF (Attribute Inheritance Factor)) information hiding- MHF (Method Hiding Factor), AHF (Attribute Hiding Factor)\polymorphism-POF (Polymorphism Factor)Coupling-COF (Coupling Factor))
[image:4.595.310.549.69.444.2]W. Li et al. [18] proposed a new metric suite which include Number of Ancestor Classes (NAC), Number of Local Methods (NLM), Class Method Complexity (CMC), Number of Descendent Classes (NDC), Coupling Through Abstract data type (CTA), and Coupling Through Message passing (CTM). These metrics measure different internal attributes such as coupling, complexity and size.
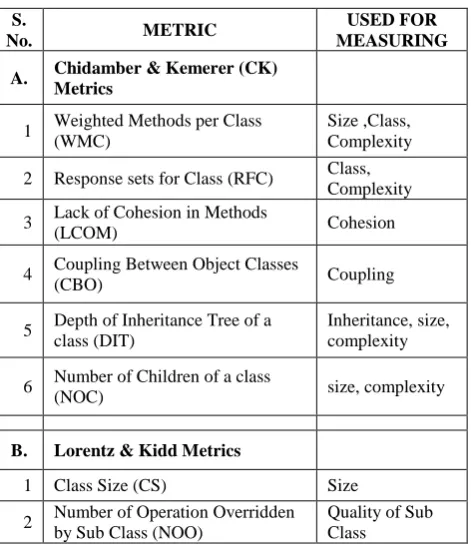
Table 3.0, summarizes the popular metrics proposed by above researchers and indicate their use for measuring the features of OO software.
Table 3.0 - Metrics with respect to their use
S.
No. METRIC
USED FOR MEASURING
A. Chidamber & Kemerer (CK)
Metrics
1 Weighted Methods per Class (WMC)
Size ,Class, Complexity 2 Response sets for Class (RFC) Class,
Complexity 3 Lack of Cohesion in Methods
(LCOM) Cohesion
4 Coupling Between Object Classes
(CBO) Coupling
5 Depth of Inheritance Tree of a class (DIT)
Inheritance, size, complexity 6 Number of Children of a class
(NOC) size, complexity
B. Lorentz & Kidd Metrics
1 Class Size (CS) Size
2 Number of Operation Overridden by Sub Class (NOO)
Quality of Sub Class
3 Number of Operations added by Sub Class (NOO)
Quality of Sub Class
4 Specialization Index (SI) Quality of Class
C MOOD Metric Set Model
1 MIF (Method Inheritance Factor) Inheritance 2 AIF (Attribute Inheritance Factor) Inheritance
3 MHF (Method Hiding Factor)
Encapsulation, Information hiding 4 AHF (Attribute Hiding Factor)
Encapsulation, Information hiding 5 POF (Polymorphism Factor) Polymorphism 6 COF (Coupling Factor) Coupling,
Message Passing
D Li Metrics
1 Number of Ancestor Classes (NAC)
Inheritance, size, complexity 2 Number of Local Methods (NLM) Size, complexity 3 Class Method Complexity (CMC) Complexity 4 Number of Descendent Classes
(NDC)
Inheritance, Size, complexity 5 Coupling Through Abstract data
type (CTA) Coupling
6 Coupling Through Message passing (CTM)
Coupling, Message passing As illustrated from the above table, Object Oriented Metrics specifically measures all the features of Object Oriented Programming, e.g.
DIT, NOC, NDC and NAC measures Inheritance,
MHF & AHF measures Encapsulation,
POF measure Polymorphism,
CBO, COF, CTM & CTA measures Coupling,
LCOM measures Cohesion,
CTM & COF measures Message Passing.
Size of Object Oriented Project can be easily determined with the number of classes, number of objects & number of methods. Hence, for size estimation WMC, DIT, NOC, CS, NAC, NLM and NDC metrics are used. Other than above, use case method developed by Gustav Karner is also considered for Object Oriented size estimation. A brief description of the various size estimation metrics are given below:
3.1
Use Cases
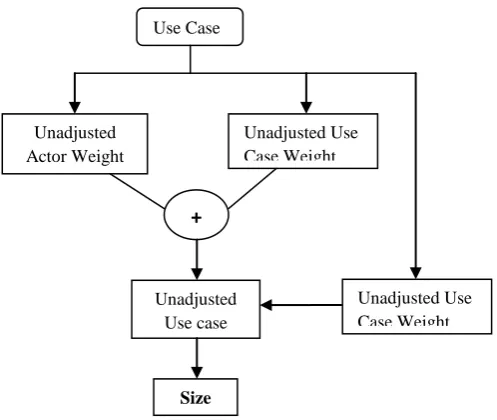
[image:4.595.51.287.495.770.2]
Figure 2.0 - Size Estimation through Use Case
The Use Case Points Method for Size estimation Use Case Points (UCP) is an estimation method that provides the ability to estimate an application’s size and effort from its use cases. The Use Case model used for estimation of size requires: a) Unadjusted Actor Weight (UAW)
b) Unadjusted Use Case Weight (UUCW) c) Technical Complexity Factor (TCF)
a) Unadjusted Actor Weight (UAW) -The UAW is one of
[image:5.595.51.300.61.271.2]factor that contributes to the size of the software being developed. It is calculated based on the number and complexity of the actors for the system, Actors are identified and classified as Simple, Average or Complex. Table 4.0 shows the different classifications of actors and the weightages assigned.
Table 4.0: Classification of Actors with Weightage assigned.
Actors Classification
Type of Actor Weight
Simple External system that must interact with the system using a well-defined API
1
Average External system that must interact with the system using standard communication protocols (e.g. TCP/IP, FTP, HTTP, database)
10
Complex Human actor using a GUI application interface
15
The Unadjusted Weightage can be calculated by using following formula:
UAW = (Total No. of Simple actors x 1) + (Total No. Average actors x 2) + (Total No. Complex actors x 3)
b)
Unadjusted Use Case Weight (UUCW) -
TheUUCW is another factors that contribute to the size of the software being developed. It is calculated based on the number and complexity of the use cases for the system. To find the UUCW for a system, each of the use cases
must be identified and classified as Simple, Average or Complex based on the number of transactions the use case contains. Table 5.0 shows the different classifications of use cases based on the number of transactions and the weightage assigned.
Table 5.0 -Classification of Use Case with Weightage assigned
Use Case Classification
No. of Transactions Weights
Simple 1 to 3 transactions 5 Average 4 to 7 transactions 10 Complex 8 or more transactions 15
Following formula can be used for calculating Unadjusted Use Case Weight,
UUCW = (Total No. of Simple Use Cases x 5) + (Total No. Average Use Case x 10) + (Total No. Complex Use Cases x 15)
c)
Technical Complexity Factor (TCF): The TCF
is one of the factors applied to the estimate size of the software in order to account for technical considerations of the system. It is determined by assigning a score between 0 (factor is irrelevant) and 5 (factor is essential) to each of the 13 technical factors listed (Table 6.0). This score is then multiplied by the defined weighted value for each factor. The total of all calculated values is the technical factor (TF). The TF is then used to compute the TCF with the following formula:
[image:5.595.329.548.153.222.2]TCF = 0.6 + (TF/100)
Table 6.0: Technical Factor with Weightage assigned
Factor Description Weight
T1 Distributed system 2
T2 Response time/performance objectives 1
T3 End-user efficiency 1
T4 Internal processing complexity 1
T5 Code reusability 1
T6 Easy to install 0.5
T7 Easy to use 0.5
T8 Portability to other platform 2
T9 System maintenance 1
T10 Concurrent/parallel processing 1
T11 Security features 1
T12 Access for third parties 1
T13 End user training 1
Finally the Size of use case model can be calculated once the unadjusted project size (UUCW and UAW), technical complexity factor (TCF) have been determined. The size of use case can be calculated by following formula,
Size = (UUCW + UAW) x TCF Size
Use Case Method
Unadjusted Actor Weight
Unadjusted Use Case Weight Weight
+
Unadjusted Use case
points
[image:5.595.312.550.467.685.2]3.2
Average Number of Children per Class
(NOC)
Each super class has zero or more sub-classes (derived classes). The NOC is a count of these derived classes. NOC = Number of immediate sub-classes subordinated to a
class in the class hierarchy
3.3
Weighted Methods Per Class (WMC)
In WMC, each method is weighted by a complexity based on the type of method used. It is an average number of methods per class. Weighted methods per class consist of both the functionality and the inter-object communication in the Object Oriented count. The number of methods is, therefore, a measure of class definition as well as being attributes of a class, and attributes correspond to properties. The number of methods and the complexity of methods involved is a predictor of how much time and effort is required to develop and maintain the class.
WMC =
n
i1 Cn
Where a Class C1 has M1, …Mn, methods with c1, …, cn complexity respectively
3.4
Average Depth of Class in Hierarchy Tree
(DIT)
Each class described can be characterized as either a base class or a derived class. Those classes that are derived classes, fall somewhere in the class hierarchy other than the root. The DIT for a class indicates it’s depth in the inheritance tree i.e. it is the length (in number of levels) from the root of the tree to that particular class. The average DIT, along with TLC and NOC, is used to help establish the reuse through inheritance dimension and the overall system size.
3.5
Number of Ancestor Classes (NAC)
The Number of Ancestor classes (NAC) metric measures the total number of ancestor classes from which a sub class inherits in the class inheritance hierarchy. NAC is similar to DIT as (Depth of Inheritance Tree) measures the number of ancestors of a class. Li [18] justified that the unit for the NAC metric is “class” because the attribute that the NAC metric captures is the number of other classes.
3.6
Number of local methods (NLM)
The Number of Local Methods (NLM) is defined as the number of the local methods defined in a class which are accessible outside the class. It measures the attributes of a class that WMC metric intends to capture. Li [18] stated three viewpoints for NLM metric as following:
a) The NLM metric is directly linked to a programmer’s effort when a class is reused in an OO design. More the local methods in a class, the more effort is required to comprehend the class behavior.
b) The larger the local interface of a class, the more effort is needed to design, implement, test, and maintain the class. c) The larger the local interface of a class, the more
influence the class has on its descendent classes.
3.7
Number of descendent classes (NDC)
The Number of Descendent Classes (NDC) metric is defined as the total number of descendent classes (subclass) of a class.
It is an alternative to NOC. The NOC metric measures the scope of influence of the class on its sub classes because of inheritance. Li [18] claimed that the NDC metric captures the classes attribute better than NOC.
4
COMPARATIVE ANALYSIS BETWEEN
OBJECT ORIENTED METRICS AND
TRADITIONAL METRICS:
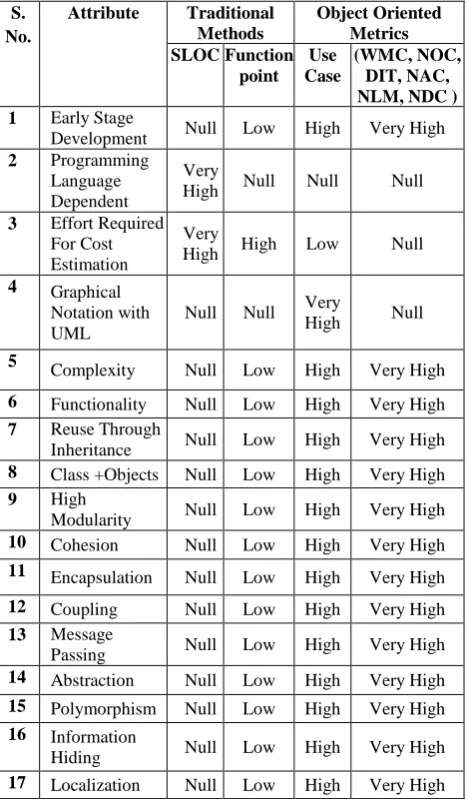
[image:6.595.310.544.273.673.2]A comparative analysis has been done between the Traditional methods and Object oriented Metrics used for Size estimation, with respect of various attributes and dependency of above methods on these attribute. The dependency has been rated from Null to very high.
Table 7.0 – Comparative Analysis between Traditional & Object Oriented Metrics
S. No.
Attribute Traditional
Methods
Object Oriented Metrics SLOC Function
point Use Case
(WMC, NOC, DIT, NAC, NLM, NDC ) 1 Early Stage
Development Null Low High Very High
2 Programming Language Dependent
Very
High Null Null Null
3 Effort Required For Cost Estimation
Very
High High Low Null
4 Graphical
Notation with UML
Null Null Very
High Null
5 Complexity Null Low High Very High 6 Functionality Null Low High Very High
7 Reuse Through
Inheritance Null Low High Very High
8 Class +Objects Null Low High Very High
9 High
Modularity Null Low High Very High
10 Cohesion Null Low High Very High
11 Encapsulation Null Low High Very High 12 Coupling Null Low High Very High
13 Message
Passing Null Low High Very High
14 Abstraction Null Low High Very High
15 Polymorphism Null Low High Very High
16 Information
Hiding Null Low High Very High
5. Conclusion:
Traditional Methods used for size estimation requires lot of efforts and do not give accurate results. Also they do not support the features of newer and rapid technologies like Object Oriented technologies.
In an Object Oriented Paradigm, several metrics are suggested by various researchers for size estimation. These metrics gives accurate results with less effort than traditional methods. Also these metrics take care of complexity, which is a crucial aspect for size estimation.
Size being an important factor for the effort/cost/duration estimation. However, manual efforts are required for estimating the same. Further studies are required for proposing new metrics which can automate the process of size estimation.
6. REFERENCES
[1] Vincenzo Giliberti, Michele Gorgoglione, Raffaele Vitulli, “An innovative model for object-oriented costs estimating”, Proceedings of the LMO'97 Conference, Brest (France), 22-24 October 1997
[2] M. G. Bocco, M. Piattini and C. Calero, “A Survey of Metrics for UML Class Diagrams”, Journal of Object Technology, Vol. 4, 2005,
[3] F. B. Abreu and R. Carapua, “Candidate Metric for OOS within taxonomy framework, Journal of System & Softwrae, Vol. 26, No. 1, July 1994.
[4] F. B. Abreu, “The MOOD Metrics Set”, In Proc. ECOOP’95, Workshop on Metrics, 1995.
[5] J. Bansiya and C.G. Davis, “A Hierarchical Model for Object-Oriented Design Quality Assessment”, IEEE Transactions on Software Engineering, Vol. 28, No. 1, 2002.
[6] L. C. Briand, J. W. Daly and J. Wust, “A Unified Framework for Coupling Measurement in Object-Oriented Systems”, IEEE Transactions on Software Engineering, Vol. 25, No. 1, 1999.
[7] S. R. Chidamber and C. F. Kemerer, “A Metrics Suite for Object Oriented Design,” IEEE Transactions on Software Engineering, Vol. 20, No. 6, 1994.
[8] M. Lorenz and J. Kidd, Object-Oriented Software Metrics, Prentice Hall, 1994.
[9] J.B. Dreger, Function Point Analysis. Prentice Hall, 1989.
[10]B. Unger and L. Prechelt, “The impact of inheritance depth on maintenance tasks – Detailed description and evaluation of two experimental replications”, Technical Report, Karlsruhe University: Karlsruhe, Germany, 1998.
[11]G. Poelsand and G. Dedene, “Evaluating the Effect of Inheritance on the Modifiability of Object-Oriented Business Domain Models”, 5th European Conference on Software Maintenance and Reengineering (CSMR 2001), Lisbon, Portugal, 2001.
[12]J. Daly, A. Brooks, J. Miller, M. Roper and M. Wood, “An Empirical Study Evaluating Depth of Inheritance on
Maintainability of ObjectOriented Software”, Empirical Software Engineering, Vol. 1, No. 2, 1996.
[13] L. C. Briand, J. W. Daly, V. Porter, and J. Wust, A Comprehensive Empirical Validation of Product Measures for Object-Oriented Systems. Technical Report, ISERN-98-07, 1998.
[14]Gennaro Costagliola and Genoveffa Tortora, “Class Point: An Approach for the Size Estimation of Object-Oriented Systems IEEE Transactions on Software Engineering,
[15]M. Alshayeb, and M. Li, “An Empirical Validation of Object-Oriented Metrics in Two Different Iterative Software Processes”, IEEE Transactions on Software Engineering archive, Vol. 29, 2003.
[16]M. Tang, M. Kao and M. Chen, An Empirical Study on Object-Oriented Metrics, 6th IEEE International Symposium on Software Metrics, 1998.
[17]R. Harrison, S. Counsell and V. Reuben, “An Evaluation of the MOOD Set of Object-Oriented Software Metrics”, IEEE Transactions on Software Engineering, Vol. 24, No. 6, 1998.
[18]W. Li, and S. Henry, “Object-Oriented Metrics that Predict Maintainability”. Journal of Systems and Software, Vol. 23, 1993.
[19] W. Li, “Another Metric Suite for Object Oriented Programming”, The Journal of Systems and Software, Vol. 44, 1998.
[20]S. R. Chidamber, D. P. Darcy, and C. F. Kemerer, “Managerial Use of Metrics for Object-Oriented Software: An Exploratory Analysis”, IEEE Transactions on Software Engineering, Vol. 24, No. 8, 1998.
[21]L. C. Briand, S. Morasca and V. Basili, “Property-Based Software Engineering Measurement”, IEEE Transactions on Software Engineering, Vol. 22, No. 6, 1996.
[22]N. E. Fenton, “Software measurement: a necessary scientific basis,” IEEE Transactions on Software Engineering, vol. 20, no. 3, 1994.
[23]Norman E. Fenton, Shari Lawrence Pfleeger. Software Metrics. A rigorous & Practical Approach. 2nd Edition. ITP, International Thomson Computer Press,1997 [24]W. Li, and S. Henry, “Object-Oriented Metrics that
Predict Maintainability”. Journal ofSystems and Software, Vol. 23, No. 2, 1993.
[25]Dr. M.P. Thapaliyal and Garima Verma, “Software Defects and Object Oriented Metrics – An Empirical Analysis”, International Journal of Computer Applications, Volume 9– No.5, November 2010
[26]Daniel Rodriguez and Rachel Harrison, “An Overview of Object-Oriented Design Metrics”, RUCS/2001/TR/A March 2001
[27]Dr. Rakesh Kumar and Gurvinder Kaur, “Comparing Complexity in Accordance with Object Oriented Metrics, International Journal of Computer Applications, Volume 15– No.8, February 2011