BIROn - Birkbeck Institutional Research Online
Jaber, M. and Wood, Peter and Papapetrou, Panagiotis and
Gonzalez-Marcos, A. (2016) A multi-granularity pattern-based sequence classification
framework for educational data. In: UNSPECIFIED (ed.) Data Science and
Advanced Analytics (DSAA), 2016 IEEE International Conference on. New
York, U.S.: IEEE Computer Society, pp. 370-378. ISBN 9781509052066.
Downloaded from:
Usage Guidelines:
Please refer to usage guidelines at
or alternatively
A Multi-granularity Pattern-based Sequence
Classification Framework for Educational Data
Mohammad Jaber and Peter T. Wood
Department of Comp. Sci. and Info. Systems Birkbeck, University of London, UK
Panagiotis Papapetrou
Dept. of Comp. and Systems Sci. Stockholm University, Sweden
Ana Gonz´alez-Marcos
Department of Mechanical Engineering Universidad de La Rioja, Spain
Abstract—In many application domains, such as education, sequences of events occurring over time need to be studied in order to understand the generative process behind these sequences, and hence classify new examples. In this paper, we propose a novel multi-granularity sequence classification framework that generates features based on frequent patterns at multiple levels of time granularity. Feature selection techniques are applied to identify the most informative features that are then used to construct the classification model. We show the applicability and suitability of the proposed framework to the area of educational data mining by experimenting on an educa-tional dataset collected from an asynchronous communication tool in which students interact to accomplish an underlying group project. The experimental results showed that our model can achieve competitive performance in detecting the students’ roles in their corresponding projects, compared to a baseline similarity-based approach.
I. INTRODUCTION
With more and more data from various domains being produced in the form of event sequences, sequence mining has become an important and much-researched area [8]. Depending on the types of events they contain, sequences can be discrete (e.g., symbolic sequences such as DNA, proteins, or text) or continuous (e.g., time series, such as sensor measurements, ECGs, or stocks). An important task within the area of sequence mining is sequence classification. For example, in health-informatics, an ECG can be viewed as a multi-dimensional time series and can be used to classify an individual as healthy or sick [28]. In finance, a chal-lenging problem is to identify suspicious series of financial transactions in a bank to detect money laundering or other fraudulent activities [23]. In genomics, sequence classification is employed to build models of known protein sequences in order to detect the function of a new protein [7].
As a result, the need for developing efficient and flexible techniques for sequence classification that can be applied in different domains has become more in demand. One of the key challenges of classification is how to identify and extract appropriate features from the data in order to train and build robust and effective classification models. This task becomes even more challenging in the case of sequences, since there are no explicit features at our disposal. Such features should be captured in a way that both the temporal dimension and the sequential order of the properties of the sequence are maintained. In addition, the number of extracted features can, in general, be rather large. Hence, the need for employing
appropriate feature selection methods arises. The latter is not always trivial, due to the time dimension, which makes the feature selection process more complicated.
Our target application area in this paper is educational data mining, where to the best of our knowledge there have been very limited studies on how temporal data features can be ex-ploited for effective classification. Next, we provide a concrete example from the target application domain demonstrating how sequence classification can be employed for predictive modeling of student roles in a project team based on their communication patterns.
A. Example
Consider a set of students forming different groups, where group members are assigned to work together on a project. In each group, students may take three different roles: project executive, project manager, and team member. Our task is to build a model that can predict the role of a student within the team by looking at the underlying communication patterns between the team members. Hence, for each project, a student corresponds to a sequence of communication events. Each sequence is assigned a class label that defines the role of the student in the project. Since the temporal order of various communication patterns may play a major part in identifying the correct role for each student, and common patterns may emerge at different levels of granularity (e.g., days, weeks or months) for different roles, we need to devise a framework for identifying communication features at different levels of time granularity.
B. Baseline
A baseline approach for classifying sequences of discrete events is to apply a standard nearest-neighbour (NN) classifier under a string similarity or distance function, such as Smith-Waterman [27] or edit distance [24], respectively. Given a training set, the classifier identifies for each new example sequence the one with the highest similarity in the training setting; the class of the closest sequence is assigned to the example sequence. In the case of a k-NN classifier, the majority class of the k most similar sequences is assigned to the new example, while ties are broken at random.
C. Contributions
More particularly, we formulate a multi-granularity framework for classifying sequences of discrete events. The framework consists of three phases: feature generation, feature selection, and model construction. The proposed feature generation tech-nique can effectively capture the inherent temporal structure of the sequences by mining frequent sequential patterns at different window sizes. The extracted features capture not only the temporal aspects of the underlying sequences, but also their variability at multiple levels of time granularity. Next, the most important features are identified by applying standard variable importance algorithms for feature selection. The classification model is then constructed by using the selected features.
In our experimental evaluation, we apply our framework to the educational data mining task mentioned in the exam-ple above. The data in this case comes from the recording of communication events between students working on the same project as part of course on project management. In analysing these events, the main goal was not to predict students’ performance, but to identify patterns that emerge from the on-line interactions between students according to their role in a project. This is valuable information for those who are teaching the course: if the patterns of interaction detected by the framework do not match those expected for the roles assigned to students, this can indicate either that there is a problem within the project team or that the social structure within the team is evolving. Early detection of such “mismatches” allows the teacher to take remedial action if necessary.
We study the performance of our framework in terms of recall, precision, F-measure, and area under the ROC, and compare with a similarity-based baseline approach. The experimental results show that our framework is able to detect correctly the role of more than 90% of the students, compared to only 57% using the baseline similarity-based model, in the best case.
The remainder of this paper is organized as follows: in Section II, we present an overview of the related work, while in Section III, we introduce our proposed framework. Our ex-perimental setup and findings are presented and demonstrated in Section IV, while a discussion on our findings follows in Section V. Section VI summarizes our conclusions and provides directions for future work.
II. RELATEDWORK
Sequence classification methods in the literature can be divided into three categories: distance-based methods such as the baseline approach we described earlier, feature-based methods, such as the proposed multi-granularity classifier introduced in Section III, and model-based classifiers such as Hidden Markov Models, which are not considered in this paper.
In feature-based classification, a sequence is transformed into a single vector of features. Such vectors are typically constructed by viewing the sequence as a bag-of-words (i.e., a word is a symbol), and they provide a summarisation of the sequence. For example, a vector can be the histogram of the
mean frequency of each event symbol included the sequence. However, this approach ignores the sequential order of the events. A modified method, called k-grams, was proposed in [8], where each sequence ofkconsecutive events is treated as a single feature. Using k-grams, each sequence can be represented as a binary vector indicating the presence and the absence of eachk-gram in the vector. Given that each sequence has been converted to a feature vector, a supervised learning algorithm, such as an SVM [22] or a decision tree [6], can be used to train the classifier. Usually if the number ofk-grams is large, some feature-selection technique is required to retrieve the most relevant features. For example, Chuzhomova et al. [6] employ a genetic algorithm to find the best subset of features. Another family of feature-based classifiers is that of shapelet-based classification models, commonly used for time series [32]. A shapelet is a distinctive subsequence that is dominant in time series of a particular class. Using these shapelets, different classification models can be constructed, such as random shapelet forests [14]. The main bottleneck of this type of classifier is that the shapelet selection procedure can be quite cumbersome, since a large set of candidate shapelets should be enumerated. An approach for learning the most distinctive shapelets has also been proposed [10]; nonetheless, the computational cost may be prohibitive for large datasets [15]. Despite their extensive employment for time series classification, their use for classifying distinct event sequences has been limited to early-classification [31], which is a different problem than the one we study in this paper.
An alternative is to use a pattern-based approach to build a feature-based classifier [20], [21]. In this approach, similar to shapelets, sub-sequence patterns are considered as features. These sub-sequences must satisfy some pre-defined criteria, such as being frequent and distinctive in at least one class, and not redundant. In our study, we adopt this technique, and employ an existing sequential pattern mining algorithm, SPAM [2], to mine frequent sequences, which are then used as features for training the classifier.
algorithms which is outside the scope of this paper.
Our goal in this paper is not to compete with the literature of sequence classification, but to demonstrate its applicability to the domain of education. Hence, our main technical contri-bution is the development of a multi-granularity pattern-based classification framework that employs the novel idea of using frequent patterns at variable window lengths as class features, and the demonstration of its high applicability to education.
III. MULTI-GRANULARITY PATTERN-BASED CLASSIFICATION
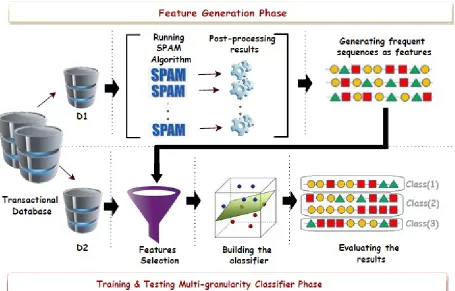
In this section, we introduce a multi-granularity sequence classification framework for effective classification of sequen-tial data. The framework is depicted in Figure 1 and it consists of three main phases:
• feature generation:in this first phase the objective is to generate sequential patterns that are used as distinctive features for classification. The features are produced from all possible time-granularity levels.
• multi-granularity feature selection: the next objective is to employ a multi-granularity approach for feature selection. The most informative features generated from the previous step are selected using various variable importance techniques.
• model construction: the final objective is the
con-struction of the classification model using the selected features.
Next, we provide some basic definitions and then describe the three phases in more detail.
A. Definitions
Let E be the space of possible events that can occur in a sequence. Atransactionis a triple
T =hid, e, ti,
where T.id is the identifier of the transaction, T.e ⊆ E is a single event or a set of events fromE, andT.tis the time-stamp of the transaction. For example, a transaction may correspond to the set of student communication activities (events) during a day or a week (time-stamp).
Given a set of predefined classes C = {c1, c2, . . . , cn}, a transactional sequence S is of the form
S=hid, c,(T1, . . . , Tn)i,
where S.id is the identifier of S, S.c∈ C is the class of S, and (T1, . . . , Tn)is an ordered set of transactions, such that, if1≤i < j≤nthenTioccurs beforeTj. In other words, the transactional sequence respects the order of transactions within it. A collection of transactional sequences defines adatasetD. Before proceeding to the first phase of the proposed frame-work, we assume that our dataset D is partitioned into two non-overlapping parts: a training set D1 and a validation set
D2. We will useD1 to generate our feature space andD2 to validate the constructed model.
B. Feature generation
The aim of this phase is to generate sequential features that capture the inherent time dependencies between the transac-tions and are highly correlated with the class label. These features correspond to sequences that are characteristic of a class in D1, i.e., occur frequently in that class, but at the same time they are infrequent in other classes. These frequent sequences will be used as the set of features when building the multi-granularity classifier in the next phase.
Firstly, we employ SPAM, an efficient algorithm proposed by Ayres et al. [2] for mining frequent sequential patterns within a transactional dataset. SPAM has been shown to be efficient in mining frequent sequences when the sequential patterns in the data are very long. Specifically, SPAM is applied to D1 and the set of frequent patterns per class is extracted. We should note, however, that our framework is not restricted to merely using SPAM for the frequent pattern extraction. On the contrary, it is flexible enough to allow for any alternative sequential pattern mining algorithm to be applied. Hence, for the pattern extraction step any appropriate pattern mining algorithm can be used.
More formally, asequential patternis a sequence ofpatterns denoted as
p= (p1, . . . , pm),
where each patternpiis a subset ofE. LetP define the space of possible sequential patterns that can be generated from E. We say that a transaction T = hid, e, ti supports pattern p, denotedp≺T, ifp⊆e. In addition, a transactional sequence S supports sequential pattern p∈ P, denoted p≺S, if
∀pi:i∈ {1,2, . . . , m}
∃Tj:pi≺Tj, ifi= 1 ∃Tj:pi≺Tj and
∃Tk:pi−1≺Tk and k < j, ifi >1
(1)
For each class c∈ C, we use|c| to denote the number of sequences in Dwhich belong to classc, i.e.,
|c|=|{S∈ D1|S.class=c}|.
Thefrequency of a sequential patternp∈ P in classc∈ C is defined as follows:
F reqD(p, c) =|{S∈ D1|p≺S∧S.class=c}|
|c| .
Given a user-specified minimum frequency thresholdσ, the setPc offrequent sequences of classc is the following:
Pc=f(P, D,≺, σ, c) ={p∈ P |F reqD(p, c)≥σ},
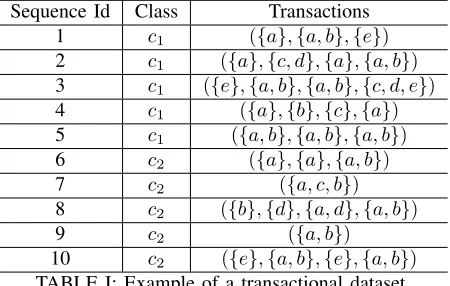
where f is a function that corresponds to the algorithm producing these patterns, in our case SPAM. To provide a better illustration of the previous definitions we present the following example.
Example I.Assume that we have an event space
Sequence Id Class Transactions 1 c1 ({a},{a, b},{e})
2 c1 ({a},{c, d},{a},{a, b}) 3 c1 ({e},{a, b},{a, b},{c, d, e})
4 c1 ({a},{b},{c},{a}) 5 c1 ({a, b},{a, b},{a, b})
6 c2 ({a},{a},{a, b})
7 c2 ({a, c, b})
8 c2 ({b},{d},{a, d},{a, b})
9 c2 ({a, b})
10 c2 ({e},{a, b},{e},{a, b})
TABLE I: Example of a transactional dataset.
and a transactional dataset Dconsisting of the 10 sequences shown in Table I. Each row in the table represents one sequence. The first column shows the sequence identifier, the second column indicates the class of the sequence, and the third column shows the events of transactions forming the sequence. Each transaction in the sequence consists of a set of one or more events. To simplify the example, we have omitted the identifiers and durations of transactions. Now consider the sequential pattern p = ({a},{a, b}) and the minimum frequency thresholdσ= 0.7. Patternpis a frequent sequence for classc1, becausepis supported by 4 out of the 5 sequences in class c1, namely sequences 1, 2, 3 and 5, hence
F reqD(({a},{a, b}), c1) = 4/5 = 0.8≥0.7.
From the previous example, it becomes apparent that each set Pc captures the sequential patterns that occur frequently in a class c. Nonetheless, it fails to take into consideration the exact location of these patterns in the sequences. In other words, a similar frequent communication pattern could occur between a project executive and a project manager, but the location of this pattern in the sequences might be different between the two roles. Hence, using the pattern as a classification feature while ignoring the temporal location would increase the classification error.
C. Multi-granularity feature generation
In order to capture time dependencies between the patterns and classes in the sequences at different levels of granularity, we segment the time-line of the dataset intonnon-overlapping windows{w1, . . . , wn}. The number of non-overlapping win-dows nis defined by the user.
Given a minimum frequency thresholdσ, we run the chosen pattern mining algorithm, e.g., SPAM, to find the set of frequent sequencesPk
c for each classc and each windowwk:
Pk
c = f(P, D1,≺, σ, c, n, k)
= {p∈ P |F reqD1(p, c, n, k)≥σ},
where f is again the algorithm that generates the set of patterns, ≺ is the support operator, n is the total number of windows, k∈[1, n] is the window index, F reqD1(p, c, n, k)
is the frequency of the sequence (pattern)pthat occurs within the windowwk, when we consider sequences of classcinD1.
Next, we post-process the output Pk
c of the pattern min-ing algorithm f to reduce the amount of redundancy and dependencies in the features. This can be done in several ways, e.g., simply by considering only the maximal or closed sequential patterns, or by introducing additional constraints on the content of the patterns based on domain knowledge. For simplicity, we demonstrate the first approach, where the set of frequent patterns is reduced to the maximal ones, i.e., those for which no superset is frequent. To better illustrate the multi-granularity pattern generation approach described above, we provide the following example.
Example II. Consider a simple dataset of five transactional sequences. Each sequence consists of 10 transactions, where each transaction consists of a single event from the set E = {a, b, c, d, e}. Given a threshold σof0.8, Figure 2 shows the frequent patterns in each window when we divide the time-line into (a) 2 and (b) 5 windows.
Id 1 2 3 4 5 6 7 8 9 10
1 a e b e c e a c c e
2 c d a b c a b b c c
3 a a b b c a c d c b
4 d a b c b d c a c c
5 a b b b c b a c d c
k= 1 k= 2
(a),(a, b) (a),(a, c) (b),(b, c) (c),(c, c) (c),(a, c) (a, c, c)
(a, b, c)
(a) 2 windows
Id 1 2 3 4 5 6 7 8 9 10
1 a e b e c e a c c e
2 c d a b c a b b c c
3 a a b b c a c d c b
4 d a b c b d c a c c
5 a b b b c b a c d c
k= 1 k= 2 k= 3 k= 4 k= 5 (a) (b) (c) (c) (c)
[image:5.612.63.288.47.190.2](b) 5 windows
Fig. 2: Frequent sequences with threshold σ= 0.8.
Next, the output is post-processed and the number of patterns is reduced by keeping only the maximal ones. For no-tation purposes, we usefmaxto denote the whole algorithmic procedure: running SPAM and pruning out the non-maximal patterns. For example, Figure 2(a) shows 7 frequent sequences for the first window and 5 frequent sequences for the second. In each case, there is only one maximal sequence:(a, b, c)for the first window, and (a, c, c)for the second.
Fig. 1: Stages of the multi-granularity classification framework.
set of window sizes employed in this step. The motivation behind considering different window sizes is that a particular window size could be useful to detect one class, but irrelevant for another. The final set of patterns is, hence, the following:
F= [
c∈C [ n∈N
[ k∈[1,n]
fmax(P,D1,≺, σ, c, n, k).
where c is the sequence class, n is the total number of windows, and k is the window index. Any frequent pattern f ∈ F is a triple f = (p, k, n) where F.p is a frequent sequential pattern appearing in windowk, given that the time-line is divided inton windows.
In spite of the large number of frequent patterns obtained using this approach, many patterns can be removed during the feature-selection phase that follows.
D. Feature selection and model construction
We will now use the set of features F generated in the previous phase to build a multi-granularity sequence classifi-cation model. For this purpose, we will use the validation set
D2. Firstly, we mapD2to a binary feature matrix that is used for building the classification model. For each sequence sin
D2, we check, for each featuref = (e, k, n)∈ F, whether s supportse, using the following function:
check(s, f) =
(
1 if e≺s
0 otherwise
Assuming that D2 = {s1, . . . , sn} and F = {f1, . . . , fm}, this step will result in ann×m Boolean matrixM, with
Mi,j=check(si, fj),∀ i∈[1, n]andj∈[1, m].
This is the matrix that contains all the (Boolean) features of the validation set.
The process of building the final classifier consists of the following steps:
learning algorithm; hence, the chance of overfitting is reduced [11]. Finally, a third approach is the embedded methodology, where the variable selection method is used at a pre-processing step and is coupled to the particular learning algorithm that will be used at the training phase. In our framework, we employ the filter methodology, which produces a more compact set of features with reduced bias towards the learning algorithm and less prone to overfitting [11]. More concretely, our framework allows us to use any feature selection algorithm off-the-shelf irrespective of the underlying classification model.
• Model construction:the feature selection step produces
a set of features that are then used to build the final classifier for the transactional sequences. For this final step of model constructions, validation setD2 was used. Our framework provides us with the flexibility to use any supervised learning algorithm at this step.
To recap, the proposed multi-granularity sequence classifi-cation framework is flexible in terms of (1) the pattern extrac-tion algorithm employed during the feature generaextrac-tion phase, (2) the variable importance method used during the feature selection phase, and (3) the predictive modeling technique used during the model construction phase.
IV. EXPERIMENTS
We studied the performance of our framework on a dataset representing on-line interactions between students while un-dertaking projects. The task was to correctly detect the team-member role of each student. Below, we first introduce the col-lected dataset and then describe the details of the experimental setting, followed by a discussion of the results obtained.
A. Dataset
Our dataset is from on-line asynchronous communication tools used by Universidad de la Rioja and Universidad Polit´ecnica de Madrid. These tools are based on the PPM software used to support the students’ learning experience (http://www.project.net) and as a tool for coordinating groups of students in order to accomplish and complete the projects they are working on:
• Blogs. Blog posts can be created either globally for the project or tied to specific tasks, keeping a complete record of activity associated with that item easily accessible. Thus, project members create blog posts to record recent activities or completed work, as well as to ask something related to the work to be done (Figure 3). In summary, blogs:
– Record completed work and general comments.
– Provide a log of all work activity for a project.
– Facilitate two-way communication between manage-ment and team members.
• Discussion groups. Project members can establish threaded discussions. The centralised discussion board allows project members to consolidate thoughts and ideas and share running commentary with other project mem-bers. In this particular application, discussion posts were
Fig. 3: Sample screen for blog messages held within a project.
Fig. 4: Sample screen for discussions held within a project.
also used to inform those project members responsible for a deliverable that the requested work had been done. The person responsible can then reply in order to provide feedback on the performed work in a positive (accep-tance) or negative (request changes) way. Furthermore, it is possible to see who posted a discussion comment and who has viewed your comments (Figure 4). In summary, a project member can:
– Hold discussions around specific deliver-ables/documents.
– Track who has viewed each message.
We gathered usage data for 194 students organised in 8 different projects. In each project, there are about 25 students. Six projects started in October and finished at the end of December in 2013. The remaining two projects extended over the same period in 2014.
Three different roles could be assigned to the students within a project: project executives (EX), project managers (PM), and team members (TM). The students interact by submitting messages to the communication tool; These can be categorised as follows:
• BW: blog entry related to reported work.
• BT: blog entry related to a task. This can be used to ask something about the work to be done.
• BE: blog entry related to anything else.
• PE: post entry. • PR: reply to a post.
These messages can be read by all students who are involved in the same project. Each interaction activity (sending or viewing a message) has a time-stamp which indicates when the interaction took place. Table II lists the full statistics of the collected data.
B. Setup
In order to generate stable results, we ran the experiments several times. For each run, we used two projects as the training dataset D1 and the remaining six projects as the validation dataset D2. Since dataset Dconsists of 8 projects, this yields 28 different ways to divide the full dataset into the training and testing datasets. The overall results are reported as the average obtained over all 28 executions. The four evaluation metrics used were precision, recall, F-measure, and area under the ROC.
C. Nearest-Neighbour classifier.
Each student in the dataset is considered as a sequence of events. An event is eitherreadingorsendinga message, hence
E = {reading, sending}. We experimented with two func-tions: (1) edit-distance (NN-ED), which counts the minimum number of edit operations (insertion, deletion, substitution) required to transform one sequence into another, and (2) Smith-Waterman (NN-SW), which performs local sequence alignment.
D. Multi-granularity pattern-based classifier.
Each student is modelled as a sequence of transactions, and each transaction represents one day. This means that the event space becomes E={reading, sending, gap}, where thegap event means that no reading or sending activity was carried out by the student in a particular transaction (day). We used a minimum frequency threshold ofσ= 0.8when running the SPAM algorithm. As mentioned before, we generated the set of frequent sequences by dividing the time-line of the projects in the dataset D1 into nwindows of equal size, applying the SPAM algorithm on each of these n windows. We explored different levels of time granularity by iterating this process using four different window sizes, i.e., N ={10,15,20,25}. Hence, this resulted in a pool of sequential features that correspond to different time-granularity levels that are readily available for the next phase of feature selection and model building.
For training and testing our classifier, we used Weka [30] for all experiments. For the feature-selection step, we investigated two algorithms:
• SVM [29]: returns a ranked list of features. In this case, we denote the classifier by MG-SVM-l, where we consider the top l features when building the classifier in the next step. We evaluated the results obtained for l∈ {10,20,30,40,50}.
• RandomForest [4]: returns a subset of features to be used for training the classifier. We denote this classifier by MG-RF.
After selecting the features, the final model can be built using any supervised-learning algorithm. In our experiments, we used the Random Forest classifier. Note that we could alternatively optimise for a particular classifier by employing the corresponding variable importance selection algorithm. Nonetheless, as also discussed in [11], feature selection tech-niques can also be used out-of-the-box for for providing features that can be used by various classification models.
Finally, we used 10-fold cross validation by partitioning the validation dataset D2 consisting of 6 projects into 10 equal subsets. The values of the evaluation metrics were based on their means over all runs.
E. Experimental results
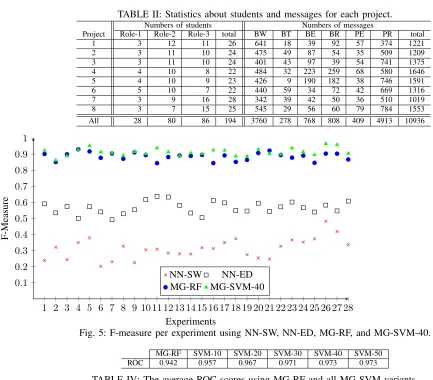
The results for the MG-SVM classifiers when using various top-lfeatures forl∈ {10,20,30,40,50}are highly similar. As the results for l = 40 are slightly better than the others, we used them (MG-SVM-40) when comparing to MG-RF and the two baselines NN-SW and NN-ED in Table III. Clearly, MG-RF returns a result very close to that obtained by MG-SVM-40, with an F-measure of 0.886 compared to 0.912. However, both MG-RF and MG-SVM-40 are substantially better than the two baseline classifiers, where the F-measure scores were only 0.313 for NN-SW and 0.567 for NN-ED. The reason behind the difference in these results is that NN-ED performs global sequence alignment, and hence local structure within the classes may be hidden by the global structure captured by NN-ED. On the other hand, NN-SW performs local alignment, hence favouring local structural similarity between the classes.
NN-SW NN-ED MG-RF MG-SVM-40 precision 0.548 0.611 0.886 0.914
recall 0.387 0.563 0.890 0.915
F-measure 0.313 0.567 0.886 0.912 TABLE III: Average precision, recall, and F-measure using NN-SW, NN-ED, MG-RF and MG-SVM-40.
TABLE II: Statistics about students and messages for each project.
Numbers of students Numbers of messages
Project Role-1 Role-2 Role-3 total BW BT BE BR PE PR total 1 3 12 11 26 641 18 39 92 57 374 1221 2 3 11 10 24 475 49 87 54 35 509 1209 3 3 11 10 24 401 43 97 39 54 741 1375 4 4 10 8 22 484 32 223 259 68 580 1646 5 4 10 9 23 426 9 190 182 38 746 1591 6 5 10 7 22 440 59 34 72 42 669 1316 7 3 9 16 28 342 39 42 50 36 510 1019 8 3 7 15 25 545 29 56 60 79 784 1553 All 28 80 86 194 3760 278 768 808 409 4913 10936
1 2 3 4 5 6 7 8 9 10 11 12 13 14 15 16 17 18 19 20 21 22 23 24 25 26 27 28 0.1
0.2 0.3 0.4 0.5 0.6 0.7 0.8 0.9 1
Experiments
F-Measure
NN-SW NN-ED
MG-RF MG-SVM-40
Fig. 5: F-measure per experiment using NN-SW, NN-ED, MG-RF, and MG-SVM-40.
[image:9.612.51.484.44.424.2]MG-RF SVM-10 SVM-20 SVM-30 SVM-40 SVM-50 ROC 0.942 0.957 0.967 0.971 0.973 0.973
TABLE IV: The average ROC scores using MG-RF and all MG-SVM variants.
V. DISCUSSION
The purpose of this investigation was to propose a novel multi-granularity pattern-based sequence classification frame-work and to examine its performance in the Educational Data Mining (EDM) field.
EDM proposes the use of various techniques (statistical analysis, machine-learning, data mining, etc.) to convert raw data from educational systems into useful information that could resolve educational research issues and understand the setting in which students learn [3]. Some authors suggest several EDM subjects as being relevant [5]:
• applications that assess students’ learning performance,
• applications that provide course adaptation and learning recommendations based on the student’s learning behav-ior,
• approaches that evaluate learning material and educa-tional web-based courses,
• applications that provide feedback to teachers and stu-dents in e-learning courses, and
• developments for the detection of atypical student learn-ing behaviours.
Data analyses usually consider aggregated information about students’ behaviour. However, the aggregated
descrip-tions often mask specific behaviours and strategies that stu-dents employ as they work as a project team. An important component to identify and analyse detailed students’ behaviour is the use of sequence mining to identify frequent patterns of actions within a group [18].
This work focused on asynchronous conversations because they tend to be better structured and developed than syn-chronous communication [9] and they provide project mem-bers time to examine and reflect on a topic before they formalize their contribution [12].
Despite these interesting results, it must be taken into ac-count that different roles could emerge during project activities beyond the formal project organisation. For instance, some team members (TM) could emerge informally as leaders and act as informal project managers (PM) in the day-to-day ac-tivities. Although the analysis of these project team dynamics have not been the main goal of the present investigation, we are considering the idea of determining the social behavioural profiles of project members beyond their formal given roles.
VI. CONCLUSIONS
We addressed the problem of detecting the roles of users working in a shared activity by analysing their online interac-tions. We approached the problem as a sequence classification problem in which users can be represented by sequences of their online activities. Two approaches were considered, a baseline Nearest-Neighbour classifier built using a similarity-based function, and our proposed multi-granularity classifier that employs frequent sequential patterns at different time granularity levels as distinctive class features. We evaluated our framework to detect the roles of students working in a project and interacting via an online asynchronous com-munication. Our results demonstrate the superiority of the multi-granularity pattern-based classifier, which can detect the correct student role more than 90% of the time.
Directions for future work include the validation of our framework in other domains such as industrial project man-agement. In addition, we plan to explore alternative pattern representations, such as closed patterns, that could possibly provide features of better quality without substantially sac-rificing computation time during training. Considering other features, such as the actual contents of the interactions, might also be beneficial.
REFERENCES
[1] S. F. Altschul, W. Gish, W. Miller, E. W. Myers, and D. J. Lipman. Basic local alignment search tool.Journal of Molecular Biology, 215(3):403– 410, 1990.
[2] J. Ayres, J. Flannick, J. Gehrke, and T. Yiu. Sequential pattern mining using a bitmap representation. InProceedings of the 8th ACM SIGKDD International Conference on Knowledge Discovery and Data Mining, pages 429–435, 2002.
[3] R. Baker and K. Yacef. The state of educational data mining in 2009: a review and future visions.Journal of Educational Data Mining, 1(1):3– 17, 2009.
[4] L. Breiman. Random forests. Machine Learning, 45(1):5–32, 2001. [5] F. Castro, A. Vellido, A. Nebot, and F. Mugica. Applying data
mining techniques to e-learning problems. In L. Jain, R. Tedman, and D. Tedman, editors, Evolution of Teaching and Learning Paradigms in Intelligent Environment (Studies in Computational Intelligence), vol-ume 62, pages 183–221. Springer-Verlag, New York, 2007.
[6] N. A. Chuzhanova, A. J. Jones, and S. Margetts. Feature selection for genetic sequence classification.Bioinformatics, 14(2):139–143, 1998. [7] M. Deshpande and G. Karypis. Evaluation of techniques for classifying
biological sequences. InProc. 6th Pacific-Asia Conf. on Advances in Knowledge Discovery and Data Mining, pages 417–431, 2002. [8] G. Dong and J. Pei.Sequence Data Mining, volume 33 ofAdvances in
Database Systems. Kluwer, 2007.
[9] A. J. Girasoli and R. D. Hannafin. Using asynchronous av communica-tion tools to increase academic self-efficacy. Computers & Education, 51(4):1676–1682, 2008.
[10] J. Grabocka, N. Schilling, M. Wistuba, and L. Schmidt-Thieme. Learn-ing time-series shapelets. InProceedings of the 20th ACM SIGKDD International Conference on Knowledge Discovery and Data Mining, pages 392–401, 2014.
[11] I. Guyon and A. Elisseeff. An introduction to variable and feature selection. J. Mach. Learn. Res., 3:1157–1182, Mar. 2003.
[12] M. Hammond. A review of recent papers on online discussion in teaching and learning in higher education. Journal of Asynchronous Learning Networks, 9(3):9–23, 2005.
[13] L. Kaj´an, A. Kert´esz-Farkas, D. Franklin, N. Ivanova, A. Kocsor, and S. Pongor. Application of a simple likelihood ratio approximant to protein sequence classification. Bioinformatics, 22(23):2865–2869, 2006.
[14] I. Karlsson, P. Papapetrou, and H. Bostr¨om. Forests of randomized shapelet trees. InStatistical Learning and Data Sciences, pages 126– 136. Springer, 2015.
[15] I. Karlsson, P. Papapetrou, and H. Bostr¨om. Generalized random shapelet forest. Data Mining and Knowledge Discovery, 2016 - To appear. [16] E. Keogh and S. Kasetty. On the need for time series data mining
benchmarks: A survey and empirical demonstration. Data Min. Knowl. Discov., 7(4):349–371, Oct. 2003.
[17] E. J. Keogh and M. J. Pazzani. Scaling up dynamic time warping for datamining applications. InProc. 6th Int. Conf. on Knowledge Discovery and Data Mining, pages 285–289, 2000.
[18] J. S. Kinnebrew, K. M. Loretz, and G. Biswas. A contextualized, dif-ferential sequence mining method to derive students’ learning behavior patterns. Journal of Educational Data Mining, 5(1):190–219, 2013. [19] R. Kohavi and G. H. John. Wrappers for feature subset selection.Artif.
Intell., 97(1-2):273–324, Dec. 1997.
[20] D. Kudenko and H. Hirsh. Feature generation for sequence categoriza-tion. InAAAI/IAAI, pages 733–738. American Association for Artificial Intelligence, 1998.
[21] N. Lesh, M. J. Zaki, and M. Ogihara. Mining features for sequence classification. InProceedings of the 5th ACM SIGKDD International Conference on Knowledge Discovery and Data Mining, pages 342–346, 1999.
[22] C. Leslie, R. Kuang, and K. Bennett. Fast string kernels using inexact matching for protein sequences.Journal of Machine Learning Research, 5:1435–1455, 2004.
[23] X. Liu, P. Zhang, and D. Zeng. Sequence matching for suspicious activity detection in anti-money laundering. InProceedings of the IEEE ISI 2008 PAISI, PACCF, Inter. Workshops on Intelligence and Security Informatics, pages 50–61, 2008.
[24] G. Navarro. A guided tour to approximate string matching. ACM Computing Surveys, 33:2001, 1999.
[25] S. B. Needleman and C. D. Wunsch. A general method applicable to the search for similarities in the amino acid sequence of two proteins.
J. Mol. Biol., 48:443–453, 1970.
[26] H. Saigo, J.-P. Vert, N. Ueda, and T. Akutsu. Protein homology detection using string alignment kernels.Bioinformatics, 20(11):1682–1689, 2004. [27] T. Smith and M. Waterman. Identification of common molecular subsequences. Journal of Molecular Biology, 147(1):195 – 197, 1981. [28] L. Wei and E. Keogh. Semi-supervised time series classification. In
Proceedings of the 12th ACM SIGKDD International Conference on Knowledge Discovery and Data Mining, pages 748–753, 2006. [29] J. Weston, S. Mukherjee, O. Chapelle, M. Pontil, T. Poggio, and
V. Vapnik. Feature selection for SVMs. In Advances in Neural Information Processing Systems 13, pages 668–674. MIT Press, 2000. [30] I. H. Witten, E. Frank, and M. A. Hall.Data Mining: Practical Machine
Learning Tools and Techniques. Morgan Kaufmann Publishers Inc., San Francisco, CA, USA, 3rd edition, 2011.
[31] Z. Xing, J. Pei, and E. Keogh. A brief survey on sequence classification.
SIGKDD Explor. Newsl., 12(1):40–48, Nov. 2010.