Cooper, Richard P. and Catmur, C. and Heyes, C. (2013) Are automatic
imitation and spatial compatibility mediated by different processes? Cognitive
Science 37 (4), pp. 605-630. ISSN 0364-0213.
Downloaded from:
Usage Guidelines:
Please refer to usage guidelines at or alternatively
ARE AUTOMATIC IMITATION AND SPATIAL COMPATIBILITY MEDIATED BY DIFFERENT PROCESSES?
Richard P. Cooper1,*, Caroline Catmur2 & Cecilia Heyes3
1 Department of Psychological Sciences
Birkbeck, University of London Malet Street, London WC1E 7HX
United Kingdom
2 Department of Psychology
University of Surrey Guildford GU2 7XH
United Kingdom
3 All Souls College & Department of Experimental Psychology
University of Oxford High Street, Oxford OX1 4AL
United Kingdom
*Corresponding author: [email protected]
Keywords: Automatic imitation; imitative compatibility; dual-route model; interactive
activation; mirror neuron system; spatial compatibility.
Abstract Automatic imitation or ‘imitative compatibility’ is thought to be mediated by the mirror neuron system and to be a laboratory model of the motor mimicry that occurs spontaneously in naturalistic social interaction. Imitative compatibility and spatial compatibility effects are known to depend on different stimulus dimensions – body movement topography and relative spatial position. However, it is not yet clear whether these two types of stimulus-response compatibility effect are mediated by the same or different cognitive processes. We present an interactive activation model of imitative and spatial compatibility, based on a dual-route architecture, which substantiates the view they are mediated by processes of the same kind. The model, which is in many ways a standard application of the interactive activation approach, simulates all key results of a recent study by Catmur and Heyes (2011). Specifically, it captures the difference in the relative size of imitative and spatial compatibility effects; the lack of interaction when the imperative and irrelevant stimuli are presented simultaneously; the relative speed of responses in a quintile analysis when the imperative and irrelevant stimuli are presented simultaneously; and the different time courses of the compatibility effects when the imperative and irrelevant stimuli are presented asynchronously.
was made in the presence of a closing hand stimulus), than when the irrelevant action stimulus was response-incompatible (i.e. when an open hand response was made in the presence of a closing hand stimulus, and a close hand response was made in the presence of an opening hand stimulus). In other words, response times (RTs) were shorter in compatible than in incompatible trials. Subsequent studies have reported similar, robust effects for a range of finger (e.g. Brass, Bekkering, Wohlschlager & Prinz, 2000; Brass, Bekkering and Prinz, 2001; Catmur & Heyes, 2011), hand (Craighero, Bello, Fadiga & Rizzolatti, 2002; Craighero, Fadiga, Umiltà & Rizzolatti, 1996; Craighero, Fadiga, Rizzolatti & Umiltà, 1998), arm (Gowen, Stanley & Miall, 2008; Kilner, Hamilton & Blakemore, 2007; Kilner, Paulignan & Blakemore, 2003), foot (Bach & Tipper, 2007; Gillmeister, Catmur, Liepelt, Brass & Heyes, 2008) and mouth actions (Leighton & Heyes, 2010).
Automatic imitation is of interest because it implies that humans tend to copy the actions of others without intending to do so. It also lies at the intersection between important recent developments in cognitive neuroscience and experimental social psychology. The former relate to the discovery of ‘mirror neurons’ or the ‘mirror neuron system’; areas of the premotor and inferior parietal cortex that are active during the execution of specific actions, and during passive observation of the same actions (Gallese, Fadiga, Fogassi & Rizzolatti, 1996; Iacoboni, 2009; Gallese, Gernsbacher, Heyes, Hickok & Iacoboni, 2011). The latter developments provide evidence that, in everyday life, people engage in a great deal of spontaneous ‘motor mimicry’, and that this activity has a major impact on cooperative attitudes and behavior (see Chartrand & Van Baaren, 2009, for a recent review). Many researchers believe that automatic imitation is mediated by the mirror neuron system (Longo, Kosobud & Bertenthal, 2008), and that motor mimicry is automatic imitation ‘in the wild’; i.e., motor mimicry and automatic imitation are the same psychological phenomenon, with the former being the manifestation of that phenomenon when detected under naturalistic conditions and the latter being its manifestation in tightly controlled experimental conditions (Chartrand & Van Baaren, 2009). If this is correct, understanding the psychological processes mediating automatic imitation could cast light on the cognitive functions of the mirror neuron system, and on the mechanisms that allow imitating and being imitated to promote prosocial behavior (Heyes, 2011).
The present study attempts to further our understanding of the psychological processes mediating automatic imitation by asking whether those processes are the same as, or distinct from, the processes mediating spatial compatibility effects. The spatial compatibility effects that are most directly comparable with automatic imitation occur when a task-irrelevant stimulus facilitates the performance of a response in the same relative position and/or interferes with the performance of a response in a different relative position. For example, when participants are asked to press a right key or a left key in response to color cue (red or blue; the ‘task-relevant’ stimulus dimension) appearing on the right or left of a computer screen (the ‘task-irrelevant’ stimulus dimension), correct responses are initiated faster when the location of the color cue is response-compatible (e.g. right stimulus and right response) than when the location of the color cue is response-incompatible (e.g. left stimulus and right response; Simon, 1969).
2005; Leighton & Heyes, 2010; Press, Bird, Walsh & Heyes, 2008). For example, the hand opening / closing automatic imitation effect, first reported by Stuermer et al. (2000), persists when the stimulus movements are presented in a plane orthogonal to that of the response movements, thereby controlling for left-right and up-down spatial compatibility (Heyes et al., 2005). Similarly, a study varying the anatomical identity of the stimulus hand, and response hemispace, has confirmed that simple orthogonal spatial compatibility (e.g. a tendency to respond to up stimuli with right responses – Weeks & Proctor, 1990), and complex orthogonal spatial compatibility (e.g. a tendency to respond to up stimuli with right responses in right hemispace, and to down stimuli with right responses in left hemispace – Cho & Proctor, 2004) do not contribute to automatic imitation effects in the hand opening / closing procedure (Press et al., 2008). Results of this kind indicate that, whereas spatial compatibility depends on the position of the response relative to an external frame of reference, automatic imitation depends on the configural or topographical properties of body movements – the way in which parts of the body move relative to one another.
It has been suggested that automatic imitation and spatial compatibility effects not only depend on different stimulus variables, but are also mediated by distinct mechanisms. This suggestion was prompted by the results of a study in which participants responded with a tapping movement of the index or middle finger of their right hand to stimuli depicting index and middle finger tapping movements of a model’s right or left hand (Bertenthal et al. 2006). In one experiment (3a), assessing spatial compatibility, participants were instructed to imitate the finger used by the model (i.e. to move their index finger when they saw an index finger movement, and to move their middle finger when they saw a middle finger movement). In alternating blocks, the finger movement stimulus appeared in the same relative position as the correct response (spatially compatible trials, e.g. left stimulus and left response) and in the opposite relative position (spatially incompatible trials, e.g. right stimulus and left response). In another experiment (3b), assessing automatic imitation, participants were instructed to respond with a spatially congruent finger (i.e. to move their left finger when they saw a finger movement on the left, and to move their right finger when they saw a finger movement on the right). In alternating blocks, the finger movement stimulus matched the correct response (imitatively compatible trials, e.g. index finger stimulus and index finger response) and did not match the correct response (imitatively incompatible trials, e.g. middle finger stimulus and index finger response). The results indicated that the spatial compatibility effect (i.e., the difference in RT between spatially incompatible and spatially compatible trials) observed in Experiment 3a (41ms) was greater than the imitative compatibility effect (i.e., the difference in RT between imitatively incompatible and imitatively compatible trials) observed in Experiment 3b (9ms), and that the spatial compatibility effect was more persistent. Specifically, the spatial compatibility effect was present throughout the 20-trial blocks, whereas the automatic imitation effect disappeared after the first five trials. These differences in the magnitude and persistence of the spatial compatibility and automatic imitation effects led Bertenthal et al. to suggest that automatic imitation is mediated by a process that can be more readily inhibited, and that is less dependent on learning (Brass, Derrfuss, Mattes-von Cramon and von Cramon, 2005), than the process that mediates spatial compatibility.
mask automatic imitation; for example, blurring one’s vision to avoid processing of stimulus finger identity (e.g. index versus middle). Consistent with the hypothesis that strategic factors contributed to the transient nature of the automatic imitation effect reported by Bertenthal et al., Catmur and Heyes (Experiment 1) found that neither their automatic imitation effect nor their spatial compatibility effect declined in the course of the experiment.
However, consistent with the results of the previous study, Catmur and Heyes also found larger spatial compatibility than automatic imitation effects in both of their experiments (Experiment 1: 41 msec versus 19 msec; Experiment 2: 34 msec versus 14 msec), and a difference in the time courses of the two effects. Dividing trials into five RT bins, they found that the automatic imitation effect increased with RT, whereas the spatial compatibility effect remained constant (Experiment 1). Thus, and in contrast to the spatial compatibility effect, the automatic imitation effect was smaller in trials where participants responded quickly than in trials where participants responded more slowly. Furthermore, whereas the spatial compatibility effect was present when the task-relevant or ‘imperative’ stimulus was presented before (-160ms and -80ms), simultaneously with (0ms), and after (80ms and 160ms) the task-irrelevant action stimulus, the automatic imitation effect was evident only in the simultaneous and delayed conditions (Experiment 2). Both of these results indicate that, within a trial, spatial compatibility has a more immediate effect on motor selection than imitative compatibility.
Although their results were similar in certain respects to those of Bertenthal et al. (2006), Catmur and Heyes (2011) argued that automatic imitation and spatial compatibility are mediated by processes of the same kind – processes that are equally subject to attentional control and highly dependent on learning. According to this view, both automatic imitation and spatial compatibility are mediated in the manner described by ‘dual route’ models of stimulus-response compatibility (SRC). These assume that responses can be activated via two distinct routes: an intentional (or ‘conditional’ or ‘controlled’) route, and an automatic (or ‘unconditional’) route (Proctor & Vu, 2006). Once it has been identified through perceptual analysis, the task-relevant stimulus activates the correct response via the intentional route. This route is often modelled as a short-term stimulus-response (S-R) connection; an excitatory link between a stimulus (or ‘sensory’) representation (or ‘code’) and a response (or ‘motor’) representation (or ‘code’), which is established on the basis of task instructions, and held in short-term memory for the duration of the task (Barber & O’Leary, 1997; Zorzi & Umiltà, 1995). In addition, the task-irrelevant stimulus or stimulus dimension activates a similar or ‘corresponding’ response via the automatic route. This route is typically modelled as a long-term S-R connection; an excitatory link between a stimulus representation and a response representation, and held in long-term procedural memory. If the intentional and automatic routes activate the same response representation (compatible trials), then the automatic route facilitates response selection and the correct response is executed rapidly. However, if the two routes activate different response representations (on incompatible trials), then facilitation is absent and responding is slower. Moreover, if the different response representations are mutually exclusive, then activation of the correct response via the intentional route must overcome competing excitation of the incorrect response via the automatic route. This takes extra time, and therefore responding is slower still. The alternative to this dual route framework implicates a distinct system which operates according to its own distinctive principles, in automatic imitation but not in spatial compatibility.
route framework, i.e., to determine whether the results can be accounted for without appeal to a system specialised for automatic imitation. If we assume that, rather than being processed by distinctive mechanisms, movement topography (automatic imitation) and relative position (spatial compatibility) merely activate different sets of input nodes in a dual route architecture, how is it possible to explain the differential magnitude and time courses of automatic imitation and spatial compatibility effects?
A Model of Automatic Imitation and Stimulus-Response Compatibility
General Architecture of the Model
Previous computational studies of both stimulus-response compatibility (e.g., Cohen, Servan-Schreiber & McClelland, 1992; Zorzi & Umiltà, 1995; Zhang, Zhang & Kornblum, 1999; Boyer, Scheutz & Bertenthal, 2009) and automatic processing (e.g., Cohen & Huston, 1994) have demonstrated that many empirical effects can be accurately modelled within an interactive activation framework. Within this framework (see McClelland, 1993), stimulus and response codes are modelled as activity over a set of sensory and motor nodes, where each node has an activation value that varies over time (e.g., between zero and one). When a stimulus is presented it excites corresponding sensory nodes, including those that encode both task-relevant and task-irrelevant stimulus dimensions. The sensory nodes activate motor nodes via weighted connections. Typically, activation of one motor node will increase over time. When that motor node’s activation exceeds a threshold the corresponding response is produced.
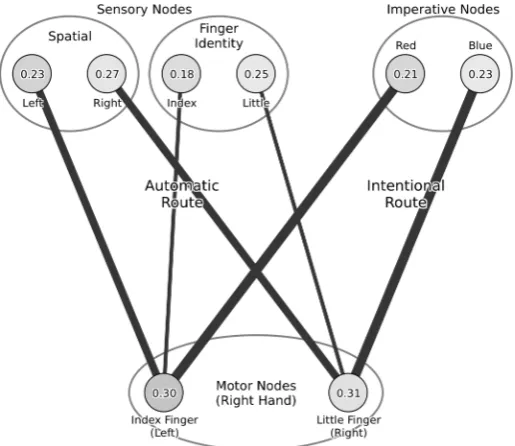
[image:6.595.169.427.69.292.2]As discussed above, in the task used by Catmur and Heyes (2011) the stimuli consisted of images showing abductions of the index and little fingers. The orientation of the stimulus image meant that the location of either of these movements could be to the left or the right. Superimposed on this image was the imperative stimulus – a disk, the color of which indicated whether the response should be an abduction of the index finger or of the little finger. In order to model this task within the interactive activation framework we therefore assume the architecture shown in Figure 1.
The architecture consists of two pairs of stimulus nodes corresponding to the task-irrelevant dimensions (sensory nodes for location of movement and finger identity), one pair of stimulus nodes corresponding to the task-relevant stimulus (imperative nodes), and one pair of motor nodes corresponding to the two possible responses. In addition excitatory links between task-irrelevant stimulus nodes and compatible mtoor response nodes are assumed. There are four such links: between the sensory node encoding movement of the index finger and the node encoding an index finger motor response; between the sensory node encoding movement of the little finger and the node encoding a little finger motor response; between the sensory node encoding movement on the left and the node encoding an index finger motor response (since an index finger response corresponds to movement on the left of the hand being used to produce the response); and between the sensory node encoding movement on the right and the node encoding a little finger motor response. These four connections correspond to the automatic route described above. The intentional route is similarly modelled by connections between stimulus nodes and motor response nodes, though in this case the relevant stimulus nodes are those encoding the imperative stimulus dimension.
Given that spatial compatibility effects are generally stronger than imitative compatibility effects, we assume that the strength of the connections from nodes encoding the spatial properties of stimuli to compatible responses are stronger than the equivalent links between imitative aspects of stimuli and responses. We assume these are ‘long-term’ connections, strengthened through general learning principles supported by relatively frequent exposure to events in which a stimulus and the compatible response co-occur. Such connections within the automatic route contrast with short-term connections between nodes encoding the imperative stimulus dimension and task-relevant responses. Following Zorzi and Umiltà (1995) and Barber and O’Leary (1997), we assume that these links are established by the subject in response to task instructions and practice trials, and that they are stronger than those in the automatic route.
We make two additional assumptions. First, that following presentation of a stimulus excitation of task-irrelevant stimulus nodes is transitory while excitation of task relevant stimulus nodes is sustained throughout a trial (Hommel, 1994). Second, that the time course of excitation of sensory nodes varies as a function of the complexity of processing each stimulus dimension, with identification of movement location occurring earlier than identification of the finger being moved. Thus, automatic excitation of left or right spatial nodes in response to a stimulus is assumed to occur relatively earlier following presentation of that stimulus than automatic excitation of the appropriate stimulus finger identity node.
Mathematical Details and Parameters of the Model
More formally, we assume that each node i has an activation value, ai, that varies as a function of time according to the activation accumulation function of Cohen and Huston (1994), namely:
ai(t+1) = ρ× ai(t) + (1−ρ) ×σ(Ii(t)) (1)
where t is the time, Ii(t) is the net input to node i at time t, ρ is a parameter that controls the degree to which current activation persists (or equivalently, the rate at which current activation decays), and σ is the logistic or sigmoid function that maps all inputs to the range zero to one.
βi, the bias of node i. Consistent with previous work (e.g., Cohen & Huston, 1994), we assume that sensory and imperative nodes have a bias of –2 and that motor nodes have a bias of –6. This ensures that all nodes have resting activations between 0.20 and 0.40 (see Figure 1).1
The net input Ii(t) to motor node i at time t is the node’s bias, plus the sum of weighted excitation or inhibition to the node from other nodes, plus normally distributed noise. That is:
Ii(t) = βi + Σj (wji× aj(t–1)) + N(0,η2) (2)
where βi is the bias as described above, wji is the weight or associative strength of the connection from node j to node i, and η is the standard deviation of noise added on each processing cycle. For stimulus nodes, net input is given by:
Ii(t) = βi + Ei + N(0,η2) (3)
where Ei is a fixed positive value if the stimulus dimension is exciting the node and zero otherwise.
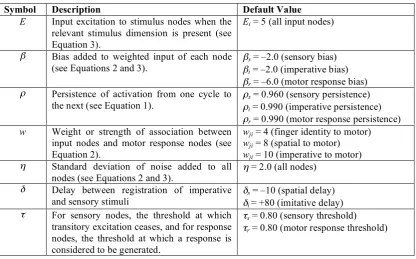
With the exception of the simulation studies below where associative strengths are explicitly manipulated, the simulations reported here assume wji is set to 8.0 for links from spatial stimulus nodes to compatible response nodes, 4.0 for links from finger identity stimulus nodes to compatible response nodes, and 10.0 for links from imperative nodes to corresponding response nodes. η, the standard deviation of noise, is assumed to be 2.0 for all nodes. Table 1 details all model parameters.
Processing on any trial proceeds as follows. Activations of all nodes are initialised to values based on their bias. Thus:
ai(0) =σ(βi) (4)
Symbol Description Default Value E Input excitation to stimulus nodes when the
relevant stimulus dimension is present (see Equation 3).
Ei = 5 (all input nodes)
β Bias added to weighted input of each node
(see Equations 2 and 3). βs
= –2.0 (sensory bias)
βi = –2.0 (imperative bias)
βr = –6.0 (motor response bias)
ρ Persistence of activation from one cycle to
the next (see Equation 1). ρs
= 0.960 (sensory persistence)
ρi = 0.990 (imperative persistence)
ρr = 0.990 (motor response persistence) w Weight or strength of association between
input nodes and motor response nodes (see Equation 2).
wji = 4 (finger identity to motor) wji = 8 (spatial to motor) wji = 10 (imperative to motor)
η Standard deviation of noise added to all
nodes (see Equations 2 and 3). η
= 2.0 (all nodes)
δ Delay between registration of imperative
and sensory stimuli δs
= –10 (spatial delay)
δi = +80 (imitative delay)
τ For sensory nodes, the threshold at which transitory excitation ceases, and for response nodes, the threshold at which a response is considered to be generated.
τs = 0.80 (sensory threshold)
[image:8.595.91.508.68.327.2]τr = 0.80 (motor response threshold)
The activations of all nodes are then updated according to Equations (1), (2) and (3) for 500 cycles so that all activations approach their resting level.2 The stimulus (e.g., an index finger abduction on the right together with a red imperative stimulus indicating a left/index finger response) is then presented and the corresponding task-irrelevant and task-relevant stimulus nodes receive strong excitation. Two parameters control the time-course of excitation of task-irrelevant nodes relative to excitation of the task-relevant node: δs is the number of processing cycles between presentation of excitatory input to the task-relevant (i.e., imperative) node and presentation to the appropriate task-irrelevant spatial node, while δi is the number of cycles between presentation of excitatory input to the task-relevant (i.e., imperative) node and presentation to the appropriate task-irrelevant finger identity (i.e., imitative) node.
The assumption concerning the transitory nature of excitation of task-irrelevant stimulus nodes is implemented by assuming that, when a task-irrelevant input dimension is present, the corresponding node receives strong input (Ei = 5.0 in Equation 3) until the node’s activation level reaches a threshold, τs (of 0.80 in the simulations reported here). Excitation of the node then ceases and the node’s activation decays back to its resting level following Equation 1 with Ii(t) equal to the node’s bias value plus noise. In contrast, on presentation of an imperative stimulus the corresponding imperative node receives sustained excitation (again Ei = 5.0 in Equation 3). This level of excitation continues until a response is produced. We assume that the parameters which govern the transitory nature of task-irrelevant input are independent of input dimension (spatial or imitative), reflecting the hypothesis of Catmur and Heyes (2011) that the mechanisms underlying spatial and imitative compatibility effects do not differ in kind.
Following presentation of a stimulus, processing continues with the activations of all nodes updated on each time step until a motor response node’s activation exceeds a threshold τr of 0.80 or the trial times out (i.e., no response is produced within 2000 cycles). RT is assumed to be a linear function of the number of cycles between stimulus presentation and response.
The value of one parameter – persistence – remains to be discussed. The effect of manipulating this parameter is to change the rate of increase or decrease of activation per processing cycle of a node given a constant net input. In the simulations reported here the persistence parameters of task-irrelevant sensory nodes and other nodes were set independently with two goals in mind, namely to produce behavior where cycle time may be taken to be approximately 1ms, and to produce SRC effects qualitatively similar to those of human participants. Specifically, ρfor task-irrelevant sensory nodes was set to 0.960 whileρ for imperative and motor nodes was set to 0.990. As discussed below (see Figure 3), these parameter values produce a spatial compatibility effect of approximately 43 cycles (comparable to the 41 msec effect noted by Catmur & Heyes, 2011, Experiment 1) and an imitative compatibility effect of approximately 18 cycles (comparable to the 19 msec effect noted by Catmur & Heyes, 2011, Experiment 1).
Simulation Results
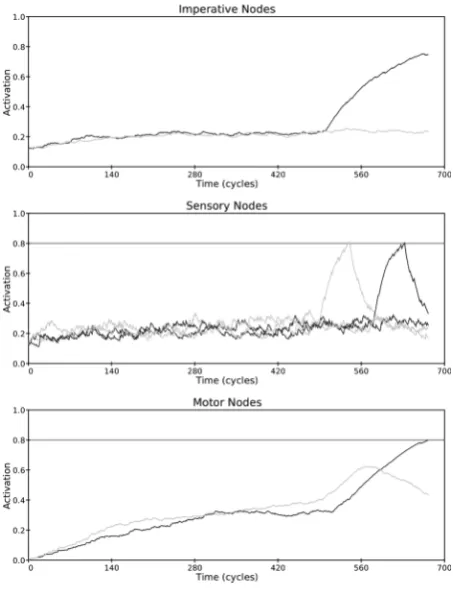
Operation of the Model on a Single Trial
was −10). It rises to threshold within about 20 cycles and then falls back to rest. Also shown in the middle panel is excitation of the irrelevant imitative sensory node (dark line), which begins 80 cycles after presentation of the imperative node (δi was +80.) As shown in the lower panel, activation of the two motor nodes settles to a base-line level of approximately 0.35 after 200 cycles. Activation of both motor response nodes stays around this level until the increasing activation of the spatial sensory node begins to percolate to the motor response nodes near cycle 500. Activation of the spatially compatible, but incorrect, motor response node (light line, lower panel) briefly rises, reflecting activity of the irrelevant spatial sensory node, before falling back and being over-taken by activation of the correct motor response node (dark line, lower panel), whose activation is boosted by excitation from the imperative node as well as excitation from the imitatively compatible sensory node.
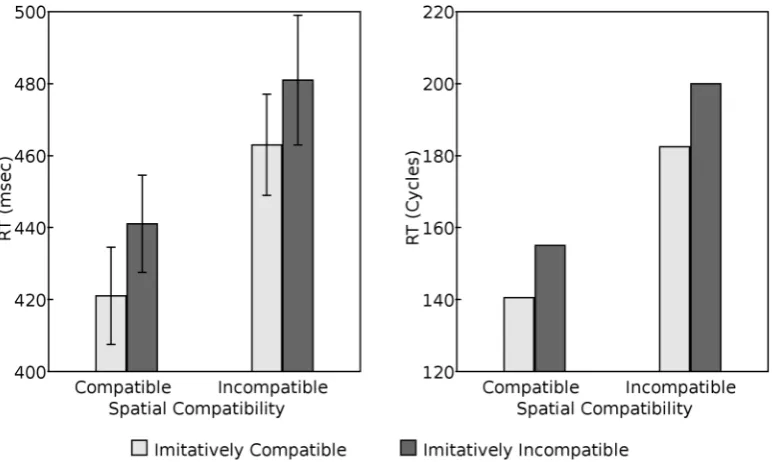
Simulation of Basic Compatibility Effects
The most basic effects of interest, shown initially by Bertenthal et al (2006) and replicated by Catmur and Heyes (2011), are the separable imitative compatibility and spatial compatibility effects on response time. As shown in Figure 3, the model captures these basic effects, with time to respond to the imperative stimulus (measured in cycles) being longer in spatially incompatible trials then spatially compatible trials, and longer in imitatively incompatible trials than imitatively compatible trials. Moreover, the compatibility effect is approximately twice as large in the spatial modality compared to the imitative modality, as found by Catmur and Heyes (2011), Experiment 1.
[image:10.595.184.411.73.368.2]Catmur and Heyes (2011) found not only main effects of spatial and imitative compatibility,
model with the parameter values given above. However, given the underlying mathematical formulation, it is not implied by the model. Indeed, if the activation spikes of task-irrelevant spatial and imitative sensory nodes were to overlap (cf. Figure 2, middle panel), then an interaction between spatial compatibility and imitative compatibility would be produced. We return to this point in the General Discussion, as some authors (e.g., Press, Gherri, Heyes & Eimer, 2010) have reported such interactions.
Simulation of Catmur and Heyes’ (2011) Quintile Analysis
A second critical finding of Catmur and Heyes (2011) was revealed by their ‘quintile analysis’. This analysis was conducted in order to investigate the time course of the compatibility effects, following Ratcliff (1979). The basic rationale is that, given natural variability in the speed of production of responses across trials, if either compatibility effect arises relatively late in processing, then it should be less evident in those responses that are produced quickly compared to those that are produced more slowly. Thus, for each trial type and each participant, RTs were ordered by speed and divided equally into five ‘bins’ (1 = fastest to 5 = slowest). Compatibility effects were then calculated for each bin. Results, shown in Figure 4 (left panel), were subjected to a two-way within-subjects ANOVA which revealed a main effect of compatibility modality (with the spatial compatibility effect being greater than the imitative compatibility effect) and an interaction of response speed and modality. Analysis of simple effects showed that while the spatial compatibility effect appeared to decrease with increasing RT, this decrease was not significant. In contrast, the imitative compatibility effect increased significantly with increasing RT. Following the logic of the analysis, this suggests that imitative compatibility effects arise relatively late in processing compared with spatial compatibility effects.
[image:11.595.97.485.92.323.2]The quintile analysis was performed with the results of the model (see Figure 4, right panel). Similar effects were obtained, with the imitative compatibility effect increasing with increasing RT. The fit to participant performance was very good, with a root mean square error of 3.16 msec over the 10 data points (R2 = 0.95).
One criticism that might be leveled at this simulation is that the model has many parameters. It may be possible to simulate a range of behaviors with the model by judicious choice of parameter values, in which case the model would be of little theoretical interest (cf. Roberts & Pashler, 2000). In order to explore this possibility two parameter variation studies were performed.
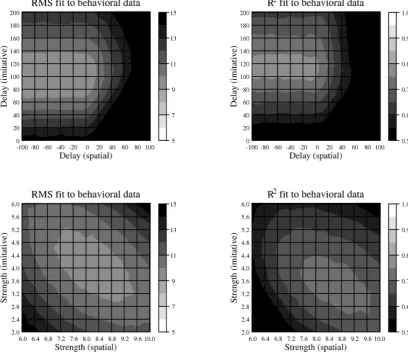
Parameter variation study 1a examined model performance across a wide range of values of the two delay parameters (δs and δi). All parameters were set to their default values (as specified in Table 1) with the exception of the delay parameters. δs (default value of –10 cycles) was set to values ranging from –100 cycles to +100 cycles at intervals of 10 cycles while δi (default value of +80 msec) was set to values ranging from 0 cycles to +200 cycles at intervals of 10 cycles, giving 441 points in parameter space. The model was then run 100 times for each parameter setting, using the Express software (Yule & Cooper, 2003) to manage the exploration of the parameter space and to collate results. On each model run the quintile analysis was performed on the resulting RTs and goodness-of-fit measures (root mean square error and R2) were calculated between the model’s behavior and that of the participants of Catmur and Heyes (2011). Mean values of the goodness-of-fit measures are shown in Figure 5 (upper panel). As is clear from the figure, the fit of the model to subject performance is good across a large region of the space, with root mean square error of less than 6 msec for spatial delays of –100 to +10 cycles and imitative delays of +20 to +110 cycles and R2 of greater than 0.9 for spatial delays of –100 to +10 cycles and imitative delays of +70 to +160 cycles.
[image:12.595.99.501.81.304.2]Parameter variation study 1b examined model performance when the strength, w, of spatial-to-motor and imitative-spatial-to-motor associations was varied. Following the same procedure as used in parameter variation study 1a, the strength of spatial-to-motor associations (default value of 8.0) was varied from 6.0 to 10.0 at intervals of 0.2 while the strength of imitative-to-motor associations (default value 4.0) was varied from 2.0 to 6.0 at intervals of 0.2, giving another 441 points in parameter space. The model was again run 100 times for each parameter setting and the quintile analysis was again performed on the resulting RTs. Goodness-of-fit measures (root mean square error and R2) were again calculated between the model’s behavior and that of the participants of Catmur and Heyes (2011). Mean values of these measures are shown in Figure 5 (lower panel). Once again, as is clear from the figure, the fit of the model to subject performance is good across a large region of the space, with root mean square error of less than 6 msec for spatial-to-motor associations of approximate strength 6.4 to 9.4 and imitative-to-motor associations of approximate strength 2.4 to 5.2 and R2 of greater than 0.9 for spatial-to-motor associations of strength 6.0 to 8.4 and imitative-to-motor associations of strength 2.8 to 6.0.
[image:13.595.88.507.72.414.2]These parameter variation studies thus demonstrate that the model produces a good fit to the behavioral data over a wide range of parameter values. Critically, the fits in the upper panel of Figure 5, where delay is varied, depend upon spatial-to-motor associations being substantially greater than imitative-to-motor associations (a basic assumption of the model that is justified
above in the General Architecture of the Model), and the fits in the lower panel of Figure 5, where association strength is varied, depend upon the spatial delay being much less than the imitative delay (again a basic assumption that is justified in the General Architecture of the Model).
Simulation of Catmur and Heyes (2011), Experiment 2
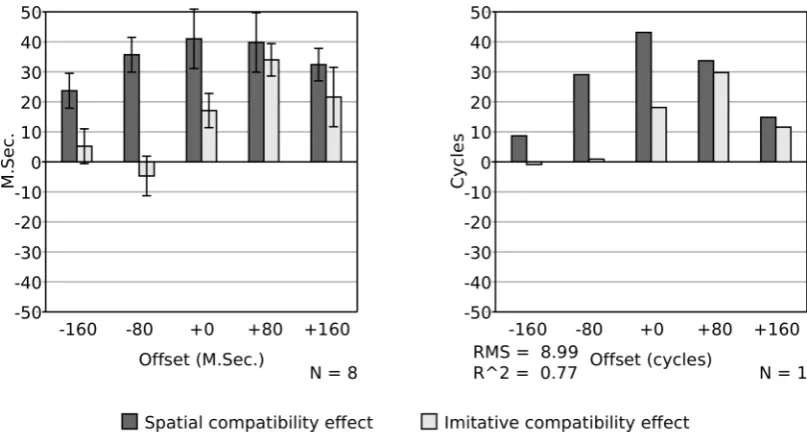
In a second investigation of the time course of compatibility effects Catmur and Heyes (2011) varied the time of onset of the imperative stimulus and the irrelevant movement stimulus. Eight participants were tested with five levels of offset: with the imperative stimulus presented 160 msec before, 80 msec before, co-incident with, 80 msec after, and 160 msec after the movement. Results, shown in Figure 6 (left panel), indicate a significant spatial compatibility effect at all offsets, but the imitative compatibility effect was only found to be significant when the offset was non-negative.
[image:14.595.95.499.68.286.2]The procedure of Catmur and Heyes (2011), Experiment 2, was replicated with the model, with stimulus offsets calculated assuming one msec per processing cycle. Recall that in the previous simulations the imperative stimulus was presented at cycle 500 (i.e., at t = 500). To simulate a trial in which the imperative stimulus occurred 160 msec before the onset of the irrelevant movement, excitation of the relevant imperative node was applied 160 cycles before this time (i.e., at t = 340). Excitation of the location node relevant to the trial type then occurred as usual at t = 490 (given δs = −10), while excitation of the finger identity node relevant to the trial type occurred at t = 580 (given δi = +80). As in the behavioral experiment, 28 trials of each of the four types and at each level of offset were performed. The mean compatibility effect is shown in Figure 6 (right panel). As in the participant data of Catmur and Heyes (2011), the spatial compatibility effect is high at all levels of offset, peaking roughly when the imperative stimulus is presented at the same time as the irrelevant movement. In contrast there is no imitative compatibility effect when the imperative stimulus is presented substantially before the irrelevant movement, and the effect peaks when the imperative stimulus is presented shortly after the irrelevant movement.
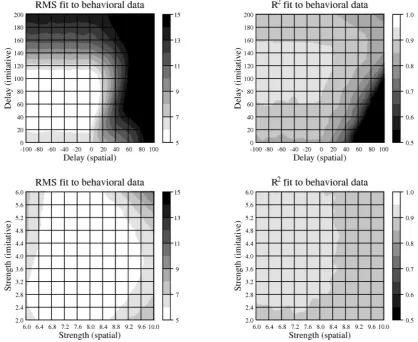
As with the previous simulation, two parameter variation studies were conducted to test the sensitivity of the model’s behavior to the specific parameter settings chosen. Parameter study 2a followed the procedure of parameter study 1a. Delay parameters were varied over the same range as in parameter study 1a. The model was run on all conditions of experiment 2 for each point in parameter space 100 times and the mean goodness-of-fit calculated for each point. Results are summarized in Figure 7 (upper panel). While the fit on both measures is not as good as in parameter study 1a, there are still large areas of the parameter space where root mean square error is less than 10 msec (roughly when spatial delay is between –100 cycles and +10 cycles and imitative delay is between +70 and +140 cycles) and R2 is greater than 0.7 (roughly when spatial delay is between –100 cycles and 0 cycles and imitative delay is between +100 and +130 cycles).
[image:15.595.92.501.74.433.2]A final parameter variation study (study 2b) examined model performance at different stimulus onsets when the strength, w, of spatial-to-motor and imitative-to-motor associations was varied. As in parameter variation study 1b, the strength of spatial-to-motor associations (default value of 8.0) was varied from 6.0 to 10.0 at intervals of 0.2 while the strength of imitative-to-motor associations (default value 4.0) was varied from 2.0 to 6.0 at intervals of 0.2. As in parameter variation study 2a, 100 simulations were performed at each point in parameter space and mean goodness-of-fit statistics were calculated with respect to the behavioral data of Catmur and Heyes (2011) Experiment 2. Results are summarized in Figure
7 (lower panel). Again, using either measure of goodness-of-fit, it is clear that the behavior of the model matches well that of the human participants over a substantial portion of the parameter space.
General Discussion
We have presented an interactive activation model of spatial and imitative compatibility that simulates all key results of the study of Catmur and Heyes (2011). The model, which is in many ways a standard application of the interactive activation approach, captures the relative size of the imitative and spatial compatibility effects, the lack of interaction when the imperative and irrelevant stimuli are presented simultaneously, the relative speed of responses in the quintile analysis when the imperative and irrelevant stimuli are presented simultaneously, and the different time courses of the compatibility effects when the imperative and irrelevant stimuli are presented asynchronously. Therefore, the model substantiates the hypothesis that spatial and imitative compatibility effects depend on processes of the same kind; it demonstrates that, contra Bertenthal et al. (2006), it is not necessary to postulate separate mechanisms underlying the effects of spatial and imitative compatibility on behavior. The observed behavioral differences between the two may be accounted for by an automatic route (albeit with different strength and delay parameters for different forms of information) within a more general dual-route framework.
Relation to Previous Related Models
Interactive activation models of this sort were first employed to provide a process account of a range of effects within the Stroop paradigm. Thus, Cohen and Huston (1994; see also Cohen, Dunbar & McClelland, 1990) developed an interactive activation model in which two banks of input nodes corresponded to two stimulus dimensions – word identity and stimulus color – and one bank of output nodes corresponded to verbal responses. A final bank of nodes represented the current task – either to read the stimulus word or to name the color in which it was printed. With appropriate weighting of the connections between nodes, the Cohen and Huston model is able to reproduce the observed facilitatory and inhibitory effects when stimuli are compatible or incompatible with the required response, both in the easier / automatic task (word reading) and the more difficult / intentional task (colour naming). The same principles have been used to model spatial SRC effects (Zorzi & Umiltà, 1995), flanker effects3 (Cohen et al., 1992) and the so-called SNARC effect4 (Stoianov, Umiltà & Zorzi, 2005), and Zhang et al. (1999) generalize the basic architecture to develop models of the complete space of stimulus-stimulus and stimulus-response compatibility tasks. Zhang et al.’s principal innovation in generalizing the architecture was the addition of a layer of nodes between the sensory and motor nodes to represent abstract concepts (like colours, which have verbal and visual input representations) that, they hold, mediate stimulus-response associations.
To understand the Boyer et al. (2009) model it is necessary to understand their task. They tested four conditions in a between-subjects design. In the ‘direct spatial’ condition, participants were required to respond with a spatially congruent finger tap. In the ‘direct imitative’ condition, participants were required to respond with an imitatively congruent finger tap. In the ‘reverse spatial’ condition, participants were required to respond with a spatially incongruent finger tap. In the ‘reverse imitative’ condition, participants were required to respond with an imitatively incongruent finger tap. To illustrate, if in the reverse imitative condition the stimulus is a middle finger tap, the participant should respond with an index finger tap. On half of the trials – those where the stimulus was a right hand – this response was spatially compatible with the stimulus, but on the other half – where the stimulus was a left hand – this response was spatially incompatible. In one experiment, stimulus hand was blocked (i.e., the stimulus hand was fixed within block but alternated between blocks) while in a second experiment stimulus hand was randomised within blocks.
The direct conditions revealed similar effects to those in other empirical studies of spatial and imitative compatibility, with compatible responses being faster than incompatible responses, but these effects did not hold in the reverse conditions. Here, at least when trial types were randomized rather than blocked, there was no significant compatibility effect in the imitative dimension while the spatial compatibility effect was reversed, with spatially incompatible responses being generated significantly more quickly than spatially compatible responses in the relevant condition.
Boyer et al. (2009) present separate but related models of the direct and reverse conditions. In the direct model, basic stimulus-response associations (as in the automatic route of the model presented here) are supplemented with nodes that effectively amplify the task-relevant stimulus-response mappings. The reverse model supplements the direct model with ‘reversal’ nodes, which inhibit the direct mapping nodes and excite appropriate incompatible response nodes. The authors fit the models to the empirical data by adjusting associative weight parameters appropriately for each experimental condition. While the use of different associative weights for the different experimental conditions may appear unsatisfactory, it is justified by the experimental paradigm, where there is no explicit imperative stimulus and where the four experimental conditions differ only in the instructions given. Nevertheless it is unclear whether empirical differences in RT to blocked versus randomized stimuli, which in our view derive from different strategic approaches to the task (e.g., blurring of the eyes for blocked stimuli), should be accounted for by differences in associative weights.
There are, however, more substantial concerns with the Boyer et al. (2009) models. Empirically, while the models can capture the basic spatial and imitative compatibility effects, they fail to capture the reverse spatial compatibility effect. This is despite the degrees of freedom available in setting associative weights specifically for that condition. Theoretically, the conclusions of the work are also subject to debate. While the strengths of associations may vary between spatial and imitative routes, in our view the Boyer et al. work suggests (like our own) that spatial and imitative compatibility are mediated by processes that do not differ in kind. That is, while the models implement an ideomotor principle where there is “direct matching of observed and executed action” (Boyer et al., 2009, p 2284), they do not imply that the process implementing this principle is any more specialised than the process implementing spatial compatibility.
‘single-route’ and ‘direct-matching’ model variants of an SRC task first introduced by Brass et al. (2000). The critical feature of these models is that they attempt to be faithful to what is known of the neural substrate of perceptual and motor processing, both by their approach to neural coding and their decomposition of processing into a series of stages. Thus, the models adopt a dynamic neural field approach to representation (e.g., Amari, 1977), where the activity of units within a topographically organised network is described by a differential equation and where activity in different regions of the network represents different values of the dimension for which that network is specialized. With regard to stage-wise processing and connectivity, both models consist of sub-networks processing: (a) spatial and motion cues (held to be localised in medial superior temporal cortex); (b) movement observation (superior temporal sulcus); (c) ideomotor integration (ventral premotor cortex); (d) motion plans (dorsal premotor cortex); (e) cue integration (posterior parietal cortex); and (f) motor selection (ventral premotor cortex). The models differ in the connectivity of these sub-networks. Thus, in the single-route model ideomotor integration feeds to cue integration (which then outputs to motor selection), while in the direct-matching model ideomotor integration feeds directly to motor selection.
One key finding of Sauser and Billard (2006) is that with appropriate parameter settings both
models can provide a good fit to the empirical data of Brass et al. (2000). Thus, at least with respect to the study of Brass and colleagues, Sauser and Billard’s model comparison does not provide strong evidence for or against either the single-route or the direct-mapping approach.
The Sauser and Billard (2006) models have not been applied to asynchronous presentation of sensory and imperative stimuli as in Catmur and Heyes (2001), Experiment 2, but they would seem to be compatible with the paradigm.5 Curiously, despite the neurophysiological plausibility of the approach, Sauser and Billard (2006) caution that the precise time course of the neural processes mediating spatial and imitative compatibility are beyond the scope of their models. Nevertheless, different parameter values (which determine the amplitude of inputs to, and weights within, a module) are used to model the dynamics of the different input dimensions, and so the different dimensions will show different time courses. Whether the models would make differential predictions under asynchronous presentation, and hence whether the paradigm discriminates between the models (and hence the theoretical approaches implemented within them), is an open question. It is our suspicion that they will not. Indeed, in terms of connectivity, both models can at an abstract level be mapped onto the model of Zhang et al. (1999), with Sauser and Billard’s cue integration module corresponding to Zhang et al.’s intermediate units. The issue then becomes one of whether imitative inputs should feed directly to motor response units or via such intermediate units. The work reported here suggests that intermediate units are not required. This again reinforces our contention that the empirical effects of Catmur and Heyes are consistent with a model in which ideomotor associations are no different in kind from spatial stimulus-response associations. Our view therefore is that the Sauser and Billard (2006) models demonstrate the neural plausibility of an approach to stimulus-response compatibility tasks based on successive layers of nodes operating according to principles of interactive activation, but they do not obviously add anything at the cognitive level, i.e., at the level at which our model is pitched.
Specific Aspects of the Model
Several aspects of the model require further comment. One is the use of transient excitation of irrelevant sensory inputs. If sensory nodes were to remain active for as long as matching stimuli were present in the perceptual input, then not only would the model be unable to capture any of the empirical effects related to time course of SRC effects, but it would also be liable to produce responses in the absence of an imperative stimulus. That is, the mere presence of a sensory stimulus would elicit the compatible response. This kind of imitative behavior has been reported following neurological damage (Lhermitte, Pillon & Serdaru, 1986). It may also occur (apparently without awareness) in some social situations (Chartrand & Bargh, 1999). However, in neurologically healthy individuals, such imitative behavior is both limited and subject to intentional control. The transient stimulation of task-irrelevant sensory nodes may be considered as a form of habituation, or, following Davelaar and Huber (2006) a form of ‘perceptual discounting’.
The mechanism by which transient excitation is implemented in the current model – allowing the excitation of sensory nodes to decay once they reach a threshold – is just one of many ways that transience of sensory input might be implemented. It follows a similar approach used in an unpublished interactive activation model of sequential effects in the flanker task by Davelaar and Huber (see Davelaar & Huber, 2006), but an alternative might be to allow sensory excitation to continue throughout the trial but to counteract this with explicit (controlled) inhibition of sensory nodes.
A final consequence of the transient nature of task-irrelevant sensory excitation is that in the model reported here, in comparison with some of the models described above, associative links between sensory nodes and motor nodes are almost as strong (at 4.0 for imitative and 8.0 for spatial associations) as those between imperative nodes and motor nodes (at 10.0). In comparison, in the Boyer et al. (2009) model the irrelevant sensory to motor associations are of the order 0.001 while the equivalent of the imperative to motor associations are greater than 0.1. Given the basic compatibility effects, there are two clear options for the influence of task-irrelevant stimulation over the time-course of a typical trial – either continuous low-level sensory stimulation for the duration of the stimulus (as in the Boyer et al. model), or a short, sharp peak in stimulation. The model presented here adopts the latter, but this is not an arbitrary decision. As discussed below, the former would, given Equations 1 to 3, result in an interaction between spatial and imitative compatibility effects – an interaction which is not present in the empirical data.
simultaneously. This contrasts with some experimental designs where stimuli or responses are antagonistic (e.g., Stroop stimuli, or responses that involve opening versus closing the hand, e.g., Stuermer et al., 2000).
More generally, we are agnostic about the inclusion of lateral inhibition. Including it has the effect of prolonging excitatory ‘bursts’ such as those of the sensory nodes of Figure 2. A key requirement for the absence of an interaction between imitative and spatial compatibility in the current model (as found in the study of Catmur & Heyes, 2011, but in contrast to some other studies, e.g., Press et al., 2010) is that such bursts do not overlap in time. If they do overlap, then it can be shown by manipulation of Equations 1 to 3 that the effect of spatial and imitative compatibility will be sub-additive (i.e., their combined effect will be less than the sum of their individual effects). However, this does not mean that the current data rule out lateral inhibition as a mechanism within the current model. The prolonging of excitatory bursts of sensory nodes resulting from lateral inhibition may be mitigated by decreasing further the persistence of sensory nodes, and additional simulations (not reported here) show that, for the quintile analysis at least, a model with lateral inhibition fits the data just as well as the model described here.6
Stimulus-response compatibility experiments typically yield low but non-zero error rates, with participants occasionally erring even when the stimulus and response are compatible. As in many studies, such errors were also observed by Catmur and Heyes (2011) and paralleled the response time effects (i.e., more errors with slower responses). Following most of the modeling work cited above, we have not attempted to simulate errors. Indeed, with the parameter settings used in the work reported here errors were exceedingly rare. The interactive activation framework is, however, capable of producing them. Increasing noise (η), particularly in the response nodes, for example, increases the probability of error, as does decreasing the response threshold (τ). Alternatively, errors might arise from a more sophisticated approach to response selection. For example, the response selected may be based not just on the activity of the winning response node but also on the difference between the activity of this node and competing response nodes, or participants may dynamically adjust their response threshold on a trial by trial basis, decreasing it when performance is good (and thereby decreasing RT) until an error is produced, and then increasing it (cf. Botvinick et al, 2001).
We have also not attempted to simulate individual differences in compatibility effects, or indeed groups of multiple subjects. Thus, the simulations reported above have focused on capturing group means. Within the interactive activation framework individual differences might be captured by differences in key parameters. One particularly important parameter is likely to be the strength of the intentional route, which intuitively corresponds to motivation. Increasing the strength of this route decreases RT and both compatibility effects, while decreasing the strength has the opposite effect.
of Catmur and Heyes (2011). Moreover, some parameters are constrained by meta-theoretical considerations (e.g., the persistence parameters, which, as discussed, are set to ensure a processing cycle corresponding approximately to one msec). Others are constrained by theoretical commitments (e.g., that the delay on finger identity nodes should be greater than the delay on location nodes, given that the task of finger discrimination is more complex than the task of location discrimination), and for other parameters considerable variability is possible without impairing the fit of the model to the data, as shown by the two pairs of parameter variation studies.
Theoretical Implications
As noted in the Introduction, automatic imitation lies at the intersection of at least two sets of recent developments in research on social cognition – relating to mirror neurons and to motor mimicry. A focus of debate in these fields is the extent to which social cognitive phenomena demand ‘specialist’ rather than ‘generalist’ explanation (Brass & Heyes, 2005). Specialist theories suggest that social cognitive phenomena are mediated by functionally and neurologically distinctive mechanisms, whereas generalist theories assume that mechanisms of the same kind mediate the processing of input from social and nonsocial sources. Our model and simulation data do not bear on the question whether automatic imitation and spatial compatibility are mediated by different neurological mechanisms. However, they support the generalist view that automatic imitation, a social cognitive effect, is mediated by the same kind of functional, or cognitive, process as spatial compatibility. More specifically, they suggest that key features of this process can be modeled by interactive activation within a dual-route architecture.
in the dual-route architecture of our model, it is clear that our findings support the ASL, rather than the AIM, account of the evolutionary and developmental origins of imitation.
References
Amari, S. (1977). Dynamics of pattern formation in lateral-inhibition type neural fields.
Biological Cybernetics, 27, 77-87.
Bach, P., & Tipper, S. P. (2007). Implicit action encoding influences personal-trait judgements. Cognition, 102, 151-178. DOI:10.1016/j.cognition.2005.11.003
Barber, P., & O’Leary, M. (1997). The relevance of salience: towards an activation account of irrelevant stimulus-response compatibility effects. In B. Hommel & W. Prinz (Eds.),
Advances in Psychology, 118: Theoretical issues in stimulus-response compatibility (pp. 135-172). Amsterdam: North-Holland.
Bertenthal, B. I., Longo, M. R., & Kosobud, A. (2006). Imitative response tendencies following observation of intransitive actions. Journal of Experimental Psychology: Human Perception and Performance, 32, 210-225. DOI: 10.1037/0096-1523.32.2.210 Botvinick, M. M., Braver, T. S., Barch, D. M., Carter, C. S., & Cohen, J. D. (2001). Conflict
monitoring and cognitive control. Psychological Review, 108(3), 624-652. DOI:10.1037/0033-295X.108.3.624
Boyer, T.W., Scheutz, M., & Bertenthal, B. I. (2009). Dissociating ideomotor and spatial compatibility: Empirical evidence and connectionist models. In N. Taatgen, H. van Rijn, & L. Schomaker (Eds.), Proceedings of the Thirty First Annual Conference of the Cognitive Science Society (pp. 2280-2285). Austin, TX: Cognitive Science Society. Brass, M., Bekkering, H., & Prinz, W. (2001). Movement observation affects movement
execution in a simple response task. Acta Psychologica, 106, 3-22. DOI:10.1016/S0001-6918(00)00024-X .
Brass, M., Bekkering, H., Wohlschlager, A., & Prinz, W. (2000). Compatibility between observed and executed finger movements: comparing symbolic, spatial, and imitative cues. Brain and Cognition, 44, 124-143. DOI:10.1006/brcg.2000.1225.
Brass, M., Derrfuss, J., & von Cramon, D. Y. (2005). The inhibition of imitative and overlearned responses: a functional double dissociation. Neuropsychologia, 43, 89-98. DOI:10.1016/j.neuropsychologia.2004.06.018
Brass, M., & Heyes, C. M. (2005) Imitation: Is cognitive neuroscience solving the correspondence problem? Trends in Cognitive Sciences, 9, 489-495.
DOI:10.1016/j.tics.2005.08.007
Catmur, C., & Heyes, C. M. (2011). Time course analyses confirm independence of automatic imitation and spatial compatibility effects. Journal of Experimental Psychology: Human Perception and Performance, 37, 409-421. DOI: 10.1037/a0019325
Catmur, C., Walsh & Heyes, C. M. (2009). The role of experience in the development of imitation and the mirror system. Philosophical Transactions of the Royal Society B, 364, 2369 - 2380.
Chartrand, T.L., & Bargh, J.A. (1999). The chameleon effect: the perception-behavior link and social interaction. Journal of Personality and Social Psychology, 76(6), 893-910. Chartrand, T. L.,& Van Baaren, R. (2009) Human mimicry. Advancesin Experimental Social
Psychology, 41, 219-274. DOI: 10.1016/0092-8674(95)90348-8.
Chong, T. T., Cunnington, R., Williams, M. A., & Mattingley, J. B. (2009). The role of selective attention in matching observed and executed actions. Neuropsychologia, 47, 786-795. DOI: 10.1016/j.neuropsychologia.2008.12.008.
Cohen, J. D., Dunbar, K., & McClelland, J. L. (1990). On the control of automatic processes: A parallel distributed processing account of the Stroop effect. Psychological Review,
97(3), 332-361. DOI:10.1037/0033-295X.97.3.332
Cohen, J. D. & Huston, T. A. (1994). Progress in the use of interactive models for understanding attention and performance. In C. Umiltà and M. Moscovitch (Eds.),
Attention and Performance XV: Conscious and nonconscious information processing
(pp. 453-476). Cambridge, MA: The MIT Press.
Cohen, J. D., Servan-Schreiber, D., & McClelland, J. L. (1992). A parallel distributed processing approach to automaticity. The American Journal of Psychology, 105(2), 239-269. DOI:10.2307/1423029.
Craighero, L., Bello, A., Fadiga, L., & Rizzolatti, G. (2002). Hand action preparation influences the response to hand pictures. Neuropsychologia, 40, 492-502. DOI: 10.1016/S0028-3932(01)00134-8.
Craighero, L., Fadiga, L., Rizzolatti, G., & Umiltà, C. (1998). Visuomotor priming. Visual Cognition, 5, 109-125.
Craighero, L., Fadiga, L., Umiltà, C. A. & Rizzolatti, G. (1996). Evidence for visuomotor priming effect. NeuroReport, 8, 347-349.
Davelaar, E. J., & Huber, D. E. (2006). Preview benefits and deficits in visual selective attention. In R. Sun, & N. Miyake (Eds.), Proceedings of the 28th Annual Meeting of the Cognitive Science Society. (p. 2467) Vancouver: Cognitive Science Society.
Gallese, V., Fadiga, L., Fogassi, L., Rizzolatti, G. (1996). Action recognition in the premotor cortex. Brain 119, 593–609. DOI: 10.1098/brain/119.2.593.
Gallese, V., Gernsbacher, M. A., Heyes, C. M., Hickok, G., Iacoboni, M. (2011). Mirror neuron forum. Perspectives on Psychological Science, 6, 369-407.
Gillmeister, H., Catmur, C., Liepelt, R., Brass, M., & Heyes, C. M. (2008). Experience-based priming of body parts: a study of action imitation. Brain Research, 1217, 157-170. DOI: 10.1016/j.brainres.2007.12.076.
Gowen, E., Stanley, J., & Miall, R. C. (2008). Movement interference in autism-spectrum
disorder. Neuropsychologia, 46, 1060-1068. DOI:
10.1016/j.neuropsychologia.2007.11.004.
Heyes, C. M. (2001). Causes and consequences of imitation. Trends in Cognitive Sciences, 5, 253-261.
Heyes, C. M. (2010). Where do mirror neurons come from? Neuroscience and Biobehavioural Reviews, 34, 575-583.
Heyes, C. M. (2011). Automatic imitation. Psychological Bulletin, 137, 463-483. DOI: 10.1037/a0022288.
Heyes, C., Bird, G., Johnson, H., & Haggard, P. (2005). Experience modulates automatic imitation. Brain Research Cognitive Brain Research, 22, 233-240. DOI: 10.1016/j.cogbrainres.2004.09.009.
Hommel, B. (1994). Spontaneous decay of response-code activation. Psychological Research, 56, 261-268. DOI: 10.1007/BF00419656.
Iacoboni, M. (2009). Imitation, empathy and mirror neurons. Annual Review of Psychology,
60, 653–670. DOI: 10.1146/annurev.psych.60.110707.163604
Kilner, J. M., Paulignan, Y., & Blakemore, S. J. (2003). An interference effect of observed biological movement on action. Current Biology, 13, 522-525. DOI: 10.1016/S0960-9822(03)00165-9.
Leighton, J., & Heyes, C. M. (2010). Hand to mouth: automatic imitation across effector systems. Journal of Experimental Psychology: Human Perception and Performance, 36, 1174–1183. DOI: 10.1037/a0019953.
Lhermitte, F., Pillon, B., & Serdaru, N. (1986). Human autonomy and the frontal lobes: Part 1. Imitation and Utilization Behavior: A neuropsychological study of 75 patients.
Annals of Neurology, 19, 326-334.
Longo, M. R., Kosobud, A., & Bertenthal, B. I. (2008). Automatic imitation of biomechanically possible and impossible actions: effects of priming movements versus goals. Journal of Experimental Psychology: Human Perception and Performance, 34, 489-501. DOI: 10.1037/0096-1523.34.2.489.
McClelland, J. L. (1993). The GRAIN model: A framework for modeling the dynamics of information processing. In D. E. Meyer & S. Kornblum (Eds.), Attention and performance XIV: Synergies in experimental psychology, artificial intelligence, and cognitive neuroscience (pp. 655–688). Hillsdale, NJ: Erlbaum.
Meltzoff, A. N., & Moore, M. K. (1997). Explaining facial imitation: A theoretical model.
Early Development and Parenting, 6, 179-192.
Press, C., Bird, G., Walsh, E., & Heyes, C. (2008). Automatic imitation of intransitive actions. Brain and Cognition, 67, 44-50. DOI: 10.1016/j.bandc.2007.11.001.
Press, C., Gherri, E., Heyes, C., M. & Eimer, M. (2010) Action preparation helps and hinders perception of action. Journal of Cognitive Neuroscience, 22, 2198-2211.
Proctor, R. W., & Vu, K-P, L. (2006). Stimulus-response compatibility principles: Data, theory and application. Boca Raton: Taylor & Francis.
Ratcliff, R. (1979). Group reaction time distributions and an analysis of distribution statistics.
Psychological Bulletin, 86, 446-461.
Roberts, & Pashler, H. (2000). How persuasive is a good fit? A comment on theory testing.
Psychological Review, 107(2), 358-367.
Sauser, E. L. & Billard, A. G. (2006). Parallel and distributed neural models of the ideomotor principle: An investigation of imitative cortical pathways. Neural Networks, 19, 285-298.
Simon, J. R. (1969). Reactions toward the source of stimulation. Journal of Experimental Psychology, 81, 174-176. DOI: 10.1037/h0027448.
Stoianov, I. Umiltà, C., & M. Zorzi, M. (2005). Computational investigations of the Simon and the SNARC effects. In B. G. Bara, L. Barsolou & M. Bucciarelli (Eds.),
Proceedings of the Twenty Seventh Annual Conference of the Cognitive Science Society
(pp. 2080-2085).Mahwah, NJ: Erlbaum.
Stuermer, B., Aschersleben, G., & Prinz, W. (2000). Correspondence effects with manual gestures and postures: a study of imitation. Journal of Experimental Psychology: Human Perception and Performance, 26, 1746-1759. DOI: 10.1037/0096-1523.26.6.1746.
Weeks, D. J., & Proctor, R. W. (1990). Salient features coding in the translation between orthogonal stimulus and response dimensions. Journal of Experimental Psychology: General, 119, 355-366. DOI: 10.1037/0096-3445.119.4.355.
Yule, P. and Cooper, R. P. (2003): Express: A web-based technology to support human and computational experimentation. Behavior Research Methods, Instruments, and Computers, 35, 605–613.
Zhang, H., Zhang, J., & Kornblum, S. (1999). A parallel distributed processing model of stimulus-stimulus and stimulus-response compatibility. Cognitive Psychology, 38, 386-432.
Zorzi, M., & Umiltà, C. (1995). A computational model of the Simon effect. Psychological Research, 58, 193-205. DOI: 10.1007/BF00419634.
Footnotes
1. Response nodes require a larger negative bias than stimulus nodes because even when no stimulus is present response nodes receive some excitation from stimulus nodes (due to the stimulus nodes settling to positive base-line value of approximately 0.2). The bias of −6 counteracts this excitatory influence in the absence of a stimulus.
2. The resting activation of motor nodes is greater than that given by Equation 4 as they receive input from sensory nodes, which have non-zero resting activations. Allowing the model to settle for a few hundred cycles prior to stimulus presentation allows the activations of all nodes to stabalize.
3. Stimuli in flanker tasks consist of a central image that is ‘flanked’ on the left and right by distractor images which may be associated with a compatible or incompatible response. Compatible flankers have a facilitatory influence on response production while incompatible flankers interfere with response production.
4. Stimuli in the SNARC (Spatial Numerical Association of Response Codes) effect task are digits, and participants are required to make some binary judgment (e.g., odd/even) on those digits. Small digits are responded to more quickly with the left hand than large digits, and vice versa.
5. Applying the Sauser and Billard (2006) model to the Catmur and Heyes (2011) task would require an extension to the model for processing color, but this would presumably simply involve addition of a ‘color cue’ module within that part of the model implementing medial superior temporal cortex. Different parameter settings would presumably be required for this module to fit with differences in the speed of color processing compared to spatial and motor processing.