© 2016, IRJET ISO 9001:2008 Certified Journal
Page 1514
Predicting Traffic Flow by Analyzing the Flow of Vehicles Using
Big Data
K.Vijiyakumar
1,R.Rajkumar
2, K.Sanjaikumar
3, V.Sarathbabu
41
Assitant professor, Department of Information Technology, [email protected]
.2, 3, 4
B.TECH, 4
thyear student, Department of Information Technology, Manakula Vinayagar Institute of
Technology,Pondicherry,India.
---***---
Abstract:
Big data in the major technique to implement the data processing in handling large amount of data’s. There
are number of techniques that was updating in the big data in order to manage the data which was not handled by the normal human. Big data is used in many large scale industries which are containing millions of record. This is because of the increase in the population and the digitalize community. Our proposal is to using this big data to predict the vehicle flow in the cities. In Government sectors they are also using this prediction of flow of vehicles in developing countries. This Processed has been done by using the Graphical Information System (GIS) which is used for the tracking the movement of the vehicles in the cities. And the Artificial Neural Network (ANN) which is used to predicting the change of the vehicles in the particular route. In order to predict the one route the other directions are also to be considered. The Gaussian Mixture Model (GMM) is used to find out the patterns that how the vehicles are moving around the cities. And also to find out the time interval when the traffic will be high or low.Keywords:
Intelligent Transport System (ITS), Artificial Neural Network (ANN), Gaussian Mixture Model
(GMM), Traffic Flow Prediction
INTRODUCTION
The traffic is the main problem that occurs in the major cities. It will affect many of the Peoples day to day life and may cause major problem to heavy vehicles to reach the destination on time. Many Problems that will made the traffic flow difficult such as Weather, Road works, Accidents, vehicles that was repaired and make the traffic jam on the road. So, the future the world is going to face traffic problem which is the major problem for the normal peoples.
Many of the Projects are also available to control these kind of the traffic problems and still the research is going for these control traffic on Intelligent Traffic System (ITS). And our aim is to predict the traffic for frequent interval of time and also to give the suggestion to the people to reach the destination quickly. In other countries they have already some uses these type of prediction technique to help the peoples to reach the destination and also to reduce the traffic that occur in the cities. In this project the traffic signals are recorder with the cameras and sensors to know the Number of vehicles
and the speed of the vehicles. By knowing the Speed(S), Velocity (V), Distance (D) calculating the traffic for the next junction for next 30 minutes. For this calculating the Traffic for every 15 minutes is used to predict the current traffic flow. For the Four way road it has to calculate for the all the four route that available in that signal. By this the user may have a chance to avoid the signals and take the shortcuts to reach the destination. It also used for if traffic is occur in one signal again and again the incoming vehicles will leads to make the traffic big and take more time to clear the traffic. Thus by avoiding incoming vehicles to the same signal will reduce the traffic and also clear the traffic very easily. Basically, data in general needs to be analyzed in order to be useful.
© 2016, IRJET ISO 9001:2008 Certified Journal
Page 1515
Velocity: Large amount of data sometimes needs to be analyzed instantly. Examples include: stock quotes and banking frauds.
Variety: Would you rather have one source to write a paper on, or ten? Having multiple types of
data can be beneficial in analyzing. A department store chain can analyze how effective their marketing campaign which includes TV, Facebook, and mobile ads.
Veracity: How good is your data if you don’t trust it? Data needs to be secure in order to be taken seriously.
Now a days Enterprises are looking for actionable in their data. Specifically, 62 percent of respondents find that use of big data analytics will the improve speed and reduce complexity. By using big data analytics platforms the enterprise can boost sales, increase efficiency, and they will improve operations, customer service and risk management. Many big data projects are used for the accurate answers that they are required for the company. The business area getting more options to improve efficiency and the complexity in the company
Big Data Analytics consists of 5Cs in the integrated Industry 4.0 and Cyber Physical Systems environment. 5C system that is consist of Connection, Cyber Content/context, Community, and Customization. In this scenario and in order to provide useful insight to the industrial management and gain exact content, data has to be processed with advanced tools to generate accurate result. Gathering the presence of visible and invisible issues in an industrial factory, the information algorithm has the capable of detecting and addressing invisible issues such as machine degradation, component wear, etc. in the factory floor [2].
The Distributed Parallel architecture and that distributes data across multiple processing units and parallel processing units for provide data much faster, by improving processing speeds of the system. This type of architecture inserts data into a parallel database, which implements the use of Hadoop and MapReduce frameworks. This type of framework used to make the processing data transparent to the end user by using a front end application. Big data analysis is the process of applying advanced analytics process and visualization techniques for large data sets to discover the hidden patterns and the unknown correlations for effective decision making process. The analysis of Big Data involves multiple distinct phases which includes data acquisition method and recording, information extraction from content and cleaning, data integration, representation and aggregation, data modelling, query processing and analysis and Interpretation. Each of these phases introduces challenges.
Heterogeneity, timeliness, scale, privacy and complexity are certain challenges of big data mining. Big data has great potential to give useful information for companies which can benefit the way they manage their
problems. Big data analysis is becoming indispensable for automatic discovering of intelligence that is involved in the frequently occurring patterns and hidden rules. These massive data sets are too large and complex for humans to effectively extract useful information without the aid of computational tools. Emerging technologies such as the MapReduce and Hadoop framework offer new and exciting ways to process and transform big data, defined as complex, unstructured, or large amounts of data, into meaningful knowledge.
HDFS: A highly faults tolerant distributed file system that is responsible for storing data on the clusters.
MapReduce: A powerful parallel programming technique for distributed processing of vast amount of data on clusters.
HBase: A column oriented distributed NoSQL database for random read/write access.
Pig: A high level data programming language for analysing data of Hadoop computation.
Hive: A data warehousing application that provides a SQL like access and relational model.
Sqoop: A project for transferring/importing data between relational databases and Hadoop.
Oozie: An orchestration and workflow management for dependent Hadoop jobs.
2. LITERATURE REVIEW
2.1Traffic Flow Decomposition and Prediction Based on Robust Principal Component Analysis Traffic Flow Decomposition and Prediction is based on the research on traffic data analysis is becoming more available and important. One of the key challenges is how to accurately decompose the high-dimensional, noisy observation traffic flow matrix into sub-matrices that correspond to different classes of traffic flow which builds a foundation for traffic flow prediction, abnormal data detection and missing data imputation. While in traditional research, Principal Component Analysis (PCA) is usually used for traffic matrix analysis. However, the traffic matrix is usually corrupted by large volume anomalies, the resulting principal components will be significantly skewed from those in the anomaly-free case
© 2016, IRJET ISO 9001:2008 Certified Journal
Page 1516
structure analysis and improve the traffic flow predictionperformance. In this paper, we focus on the decomposition of traffic flow matrix and introduced RPCA to accurately decompose the observation traffic flow matrix into sub-matrices that correspond to different classes of traffic flow. In general, a traffic flow matrix is a superposition of different sub-matrices that correspond to different classes of flow. The observation traffic flow in highway demonstrates strong spatial and temporal patterns implying a low-rank traffic flow sub matrix which constitutes the major part of the observation traffic flow. Occasional incidents or events of long duration show as abnormal events on the background of periodic traffic patterns.
2.2 Traffic Flow Prediction with Big Data: A Deep Learning Approach
A deep learning approach with a SAE model for traffic flow prediction. This paper is proposed the nonlinear spatial and temporal which is better than the previous method where it is consider the shallow structure for the traffic data. For the deep network they are using the greedy layer learning algorithm and to improve the prediction process they are using the fine-tuning which update the model’s parameter. Traffic flow prediction heavily depends on historical data and real-time traffic data collected from various sensor sources, such as radars, inductive loops, traffic cameras, Mobile Global Positioning System (GPS), crowd sourcing, social media, etc. With the widespread traditional traffic sensors and new emerging traffic sensor technologies, traffic data are exploding, and they have entered the era of big data transportation. Transportation management and control is now becoming more data driven. Although there have been already many traffic flow prediction systems and models, most of them use shallow traffic models and are still somewhat unsatisfying. This inspires us to rethink the traffic flow prediction problem based on deep architecture models with such rich amount of traffic data. They evaluated the performance of the proposed method on a PeMS data set and compared it with the BP NN, the RW, the SVM, and the RBF NN model, and the results show that the proposed method is superior to the competing methods
2.3 PREDICTIVE ANALYTICS WITH AVIATION BIG DATA
Prediction analytics is describing that analytics system which enables the query processing and predictive analytics over streams of big aviation data. They are built the system in the part of Internal Research and Development such as Boeing Research and Technology (BR&T), Advanced Air Traffic Management (AATM) that makes the prediction process on descriptive patterns of massive aviation data. By receiving the
Aircraft Situation Display to Industry (ASDI) data lively and archiving it for two years [6]. There is no present mechanism to perform the analytics process which performs easily. Since the incoming ASDI data is compressed, large and requires correlation with the corresponding flights before it was analysed.
The uncompressed data inly exposed in this service. The correlated and the data stored in warehouse for the analysis using a descriptive, predictive analytics tools for the service. The request from the Boeing Commercial Aviation (BCA) for the analysis capacity and the flow in US National Airspace System (NAS) has been reposed by this service. The service utilizes a custom tool developed by Embry Riddle Aeronautical University (ERAU) that correlates the raw ASDI feed, WebSphere Message Broker for real-time message brokering, IBM Warehouse with DB2 for data management, Cognos BI for front-end business intelligence (BI) visualization tools and SPSS Modeler for statistical analysis. The architecture, implementation, and the value it adds the aviation domain was described in this service [6].
2.4 BIG DATA, BIG DATA QUALITY PROBLEM
There are four separate domain specific case studies about big data application are undertook by the MITRE research team sponsored by USAF. The questions are raised among the case studies as initial investigations and the quality issues of the big data are encountered in traditional data collections, the big data collections are in different cause such as manifestation or detection than those data quality issues. The big data quality at multiple levels such as collection processing and storage are addressed in this case study. Though not unexpected, the key findings of this study reinforce that the primary factors affecting Big Data reside in the limitations and complexities involved with handling Big Data while maintaining its integrity. The tools used to prepare, manipulate and store the data that concerns are of a higher magnitude. From the study’s findings, the “truth about Big Data” is there are no fundamentally new DQ issues in Big Data analytics projects. Some DQ issues exhibit return-s-to-scale effects, and become more or less pronounced in Big Data analytics, though. Big Data Quality varies from one type of Big Data to another and from one Big Data technology to another [7].
2.5 TRAFFIC PREDICTION SYSTEMS IN VEHICLES
© 2016, IRJET ISO 9001:2008 Certified Journal
Page 1517
A vehicle has a position unit, a digital map,and the current time. Additionally, the vehicle has an on board memory unit for historical travel time series (e.g., stored on CD). The linkage of the map information with stored traffic congestion information leads to an adequate choice of travel time prediction associated with the current time and the vehicle location. Subsequently, the driver can see this traffic prediction indicated in a vehicle monitor. Furthermore, the traffic prediction is used for dynamic route guidance. Results of traffic prediction can also be presented in different visualization forms. In the context of the work, the prediction software was implemented in a test vehicle. Output information in form of the visualization was put on the TV interface of the Bosch COMAND system (in the Mercedes E-Class in the market), so that the following picture gives a first impression to the visualization of traffic prediction on this COMAND display. The illustration shows the digital map marked by traffic prediction results in the variants arrival time zones [8].
3. EXISTING SYSTEM
The Existing system consists of only the static result. Such as Google map, it has the option to show the traffic flow in the available route map. But it just shown the recorded result only. The user does not know whether still there is traffic there. And there is no other Existing Project among this traffic flow in India because the live streaming through satellite is unofficial in India. In other countries different models and algorithms are used for this prediction of the traffic. They are using the Geographic Information System (GIS) to show the map route for the user and they recorded about the traffic by Artificial Neural Network (ANN), and identifying the Pattern for the flow by using the Gaussian Mixture Model (GMM) Clustering By this pattern only hey have the prediction on the traffic [1].
The Traditional Prediction System does not contain the Immediate Result, It will monitoring the traffic flow for every week and find out the traffic flow for the week wise through the flow charts and graphs. By this graph the user may know about when the traffic should will high and when it is low.
This Prediction is used as the application that consist of map of the particular city and that it contains the routs and shortcuts to reach the destination by calculating the traffic flow in all the four direction. If one is have high traffic jam and it will automatically search for the new route from any one the remaining ways.
To date, many models have been developed for traffic prediction. Existing traffic prediction studies can be classified into use of parametric methods (e.g., the time-series analysis (TSA) and support vector regression (SVR) models), non-parametric methods (e.g., the k -nearest neighbours (KNN) model), and artificial
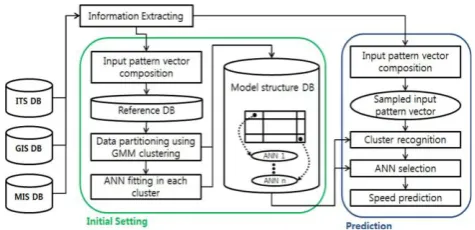
[image:4.595.313.551.261.376.2]intelligence methods (e.g., the artificial neural network (ANN) model). The most commonly applied parametric method is the TSA model. In particular, auto-regressive integrated moving average (ARIMA) TSA models have been widely used for traffic prediction using observed traffic variables. Furthermore, in many existing studies, changes of the ARIMA model have been conducted. Kamarianakis and Prastacos, and Min and Wynter, for example, respectively proposed the spacetime autoregressive integrated moving-average model to satisfy interrelations between links. The System Architecture of this existing system is shown in Figure 3.1.
Figure 3.1: Flowchart of the prediction system of this research
Moreover, Stathopoulos and Karlaftis developed a traffic congestion estimation model using a multivariate time-series state space model. This model employs as input variables the amount of traffic measured by loop detectors in five different points on a straight road. They proved that this method provides better results than the ARIMA method, which uses only one variable. In addition, some researchers have compared the seasonal ARIMA (SARIMA) model, which is a TSA model, with other methods and showed its excellent prediction performance. By comparing SARIMA and nonparametric (data driven regression) models. The authors in this research concluded that the SARIMA model has better performance than the nonparametric regression models. Lippi et al. additionally compared time-series analysis methods and SVR models and concluded that SARIMA showed the best performance.
4 PROBLEM DEFINITION
Traffic flow in Cities: Traffic roads are the great defects to cities and that all the peoples are taking wrong route that leads them stuck in the traffic. Many of the vehicles like Ambulance, Heavy vehicles and some peoples how need to go urgently are affected by this traffic. If some people want to go to some places immediately, if they are got up in traffic it may affect them seriously.
© 2016, IRJET ISO 9001:2008 Certified Journal
Page 1518
Our proposed to make the people to go in the routepeacefully and without any interrupt in it. And that make the path with shorter distance and without any interrupt to people to reach the destination.
This is measured by taking a reference area on the roadway over a short period of time. In practice, it is measured by the use of loop detectors and it is used to calculate the time taken to the vehicles to reach the next traffic signals and also to calculate the time when the traffic will be clear. The Decision that decide the time the traffic flow has been done by Artificial Neural Network. By using the Back-Propagation Algorithm to calculate the actual time taken for the vehicles to cross the signals. This ANN is used for identifying the pattern for the flow of traffic to predict the actual result. This will analyze the continuous flow of the vehicles and also for the prediction of future traffic control system.
And that if any one of the route is having unavailable interrupt it was intimated to the user and make them to take some other routes to reach the destination. It helps the ambulance, Heavy vehicles, and cars to have a freeway and make the public vehicles like buses to move in the particular.
The Prediction of the traffic control the data’s collected by cameras and sensors are stored in the referential data base which is helpful in predicting the traffic during the peak hours such as Monday – Friday and Saturday – Sunday.
The continuous flow in the traffic are monitored and stored in three different databases.And getting the data from the each database and comparing them with the historical data’s and predict the future flow of traffic in the user required location.
The Notifications was intimated to the user with the GPS system and also through the Mobile applications. To calculate the traffic flow to details of the vehicles and the speed of the vehicles are calculated for every half an hour. To calculate the traffic flow in any one direction the flow of all the other direction must also be calculated. For that, all the user ways are monitored using the security cameras and also the used for find the velocity of the vehicles.
The threshold function of the units was modified to be a function that is continuous derivative, the Sigmoid function. The use of the Sigmoid function is to give the extra information necessary for the network to implement the back-propagation training algorithm. Back-propagation is worked to finding the squared error
(the Error function) of the entire network, and then
calculating the error term for the each of the output and hidden units by using the output from the previous neuron layer. The weights of the entire network was then adjusted with dependence on the error term and the given learning rate.
Training continues in the training set until the error function reaches a certain minimum criteria. If the minimum is set too high criteria, the network might not
be able to correctly classify a pattern. But if the minimum is set too low criteria then the network will have difficulties in classifying noisy patterns.
6 CONCLUSION
From our project the prediction of the flow of traffic has been calculated earlier and that it will be helpful for the people to handle the future traffic that was created by this high population world. We proposed that minimizing the flow of vehicles will reduce the continuous traffic that was happed in the particular area or place which let the other peoples to move quickly from that place. The Prediction process is updated continuous will lead the change in the map regularly where the user will aware of the place where they want to go. From our literal research we presented that the implementation of this working process was not full filled by any countries. If it was implemented in any metro cities it will lead a rapid change in the flow of traffic in cities. For the future work, the traffic signal must be implemented by the Intelligent Traffic System (ITS). In order to calculate the flow of vehicles in the prediction process. And the data base have to be improved to store the large amount of data which contains all the video, images and other graphical elements have to store in that database.
REFERENCES
[1] Se-do Oh, Young-jin Kim, and Ji-sun Hong, “URBAN TRAFFIC FLOW PREDICTION SYSTEM USING A MULTIFACTOR PATTERN RECOGNITION MODEL”, March 26, 2015.
[2] Jaseena K.U and Julie M. David, “ISSUES, CHALLENGES, AND SOLUTIONS: BIG DATA MINING”, Department of Computer Applications, M.E.S College, Marampally, Aluva, Cochin, India pp. 131–140, 2014.
[3] Puneet Singh Duggal, Sanchita Paul, (2013), “BIG DATA ANALYSIS:CHALLENGES AND SOLUTIONS”, Int. Conf. on Cloud, Big Data and Trust, RGPV
[4] Xingxing Xing, Xiabing Zhou, Haikun Hong, Wenhao Huang, Kaigui Bian. and Kunqing Xie “TRAFFIC FLOW DECOMPOSITION AND PREDICTION BASED ON ROBUST PRINCIPAL COMPONENT ANALYSIS” Key Laboratory of Machine Perception (Ministry of Education), School of Electronics Engineering and Computer Science, Peking University, 100871, China, 2015
[5] Xingxing Xing, Xiabing Zhou, Haikun Hong, Wenhao Huang, Kaigui Bian∗ and Kunqing Xie, Andre Arcilla “ TRAFFIC FLOW DECOMPOSITION AND PREDICTION
BASED ON ROBUST PRINCIPAL COMPONENT
© 2016, IRJET ISO 9001:2008 Certified Journal
Page 1519
[6] Yisheng Lv, Yanjie Duan, Wenwen Kang, Zhengxi Li,and Fei-Yue Wang, Fellow, “TRAFFIC FLOW PREDICTION WITH BIG DATA: A DEEP LEARNING APPROACH” , IEEE , 1524-9050 © 2014
[7] Samet Ayhan, Boeing Research & Technology, Chantilly, VirginiaJohnathan Pesce, Embry-Riddle Aeronautical University, Daytona Beach, Florida Paul Comitz and David Sweet, Boeing Research & Technology, Chantilly, VirginiaSteve Bliesner, Avaliant LLC, Bellevue, WashingtonGary Gerberick, Boeing Research & Technology, Chantilly, Virginia “PREDICTIVE ANALYTICS WITH AVIATION BIG DATA”, IEEE, 978-1-4673-6253-5/13 ©2013
[8] David Becker The MITRE Corporation, Trish Dunn King The MITRE Corporation, Bill McMullen The MITRE Corporation, “BIG DATA, BIG DATA QUALITY PROBLEM “ Public release: 14-0121, 2015
[9] B. S. Kerner, H. Rehborn, M. Aleksi�, A. Haug, DaimlerChrysler AG., “TRAFFIC PREDICTION SYSTEMS IN VEHICLES “ September 13-16, 2005
[10] .Hao Wang SJTU and HKUST Li Chen HKUST Kai Chen HKUST .Ziyang Li NUDT and HKUST Yiming Zhang “NUDT FLOWPROPHET: GENERIC AND ACCURATE TRAFFIC PREDICTION FOR DATA-PARALLEL CLUSTER” Computing, 2015
[11] Z. Liu, M. Lin, A. Wierman, S. H. Low, and L. L.
Andrew,“GREENING GEOGRAPHICAL LOAD
BALANCING,” in Proceedings of International Conference
on Measurement and Modeling of ComputerSystems (SIGMETRICS). ACM, 2011, pp. 233–244.
[12] E. Chung and N. Rosalion, “SHORT TERM TRAFFIC FLOW PREDICTION,” presented at the 24th Australian Transportation Research Forum, Hobart, Tasmania, 2001.
[13] C. Chen, J. Hu, Q.Meng, and Y. Zhang, “SHORT-TIME TRAFFIC FLOW PREDICTION WITH ARIMA-GARCH MODEL,” in Proc. IEEE Intell. Veh. Symp., 2011, pp. 607– 612.
[14] M. Lippi, M. Bertini, and P. Frasconi, “SHORT-TERM TRAFFIC FLOW FORECASTING: AN EXPERIMENTAL COMPARISON OF TIME-SERIES ANALYSIS AND SUPERVISED LEARNING” IEEE Trans. Intell. Transp. Syst., vol. 14, no. 2, pp. 871–882, Jun. 2013.
[15] E. I. Vlahogianni, M. G. Karlaftis, J. C. Golias, ”SHORT-TERM TRAFFIC FORECASTING: WHERE WE ARE AND WHERE WE’RE GOING” Transportation Research Part C:
Emerging Technologies, vol. 43, pp. 3-9, 2014
[16] J. Rice and E. V. Zwet, “A simple and effective method for predicting travel times on freeways,” IEEE
Trans. Intell. Transp. Syst., vol. 5, no. 3, pp. 200–207, Sep.
2004.