© 2015, IRJET.NET- All Rights Reserved
Page 390
COMPARATIVE STUDY ON EXTENDED ENTITY RELATIONSHIP AND
UNIFIED MODELING LANGUAGE
*1
Mrs. Kavitha S., *
2Ms. Nancy A.,
*1
Assisant Professor, Department of Computer Science Auxilium College (Autonomous),
Vellore, TamilNadu, India
*2
M.Phil Research Scholar, Department of Computer Science Auxilium College (Autonomous),
Vellore, TamilNadu, India
---***---Abstract -
Entity Relationship modeling is the processof coming up with an abstract and conceptual representation of data. Entity Relationship diagrams ultimately model the databases. Entity Relationship model is generally better in relationship name and participation representation than the Unified Modeling Language diagram. In Extended entity relationship diagram is describing the data requirements for a new information system in a direct and easy to understand graphical notation. Unified Modeling Language has a direct relation with object oriented analysis and design to representation for the cardinality relationship compared with Entity Relationship diagrams. The fields are entities, attributes, relationship, cardinalities, identifiers to use the Extended Entity Relationship and Unified Modeling Language diagrams with the representing notation.
Key Words:
Entity Relationship model, Extended entityrelationship (EER), Unified Modeling Language, object oriented analysis and design.
I. INTRODUCTION
The Extended entity relationship (EER) model is a conceptual (or semantic) data model, capable of describing the data requirements for a new information system in a direct and easy to understand graphical notation. Data requirements for a database are described in terms of a conceptual schema, using the EER model. EER model of EER schemas are comparable to UML class diagrams. Actually, what will be discussing is an extension of Peter Chen’s proposal (hence “extended” ER). These represent classes of objects (facts, things, people...) that have properties in common and an autonomous existence. The EER model is very different from the relational model in a number of ways; for example, in EER it is not possible
to represent an object without knowing its properties, but in the relational model need to know its key attributes.
Specialization
Specialization Process of defining a set of subclasses of an entity type. Defined on the basis of some distinguishing characteristic of the entities in the super class. Describing the relationship Super class/subclass or Class/subclass Super type/subtype or Type/subtype. Subclass can define: Specific attributes Specific relationship types. Subclass can be subclass write more than one super class.
Generalization
Generalization Process of defining a more general entity type from given entity types reverse process of specialization. Generalize into a single super class. Original entity types are specialized subclasses. Entities in generalization must all come from subclasses generalization is the reverse of the specialization process. Several classes with common features are generalized into a super class; original classes become its subclasses.
1.1 Unified Modeling Language
UML is a standard language for specifying, visualizing, constructing, and documenting the artifacts of software systems. UML stands for Unified Modeling Language. UML is different from the other common programming languages like C++, Java, COBOL, etc.UML is a pictorial language used to make software blue prints so UML can be described as a general purpose visual modeling language to visualize, specify, construct and document software system.
1.2 UML Class Diagram
© 2015, IRJET.NET- All Rights Reserved
Page 391
is not only used for visualizing, describing anddocumenting different aspects of a system but also for constructing executable code of the software application. The class diagram shows a collection of classes, interfaces, associations, collaborations and constraints. It is also known as a structural diagram.
1.3 UML Object Diagram
Object diagrams are derived from class diagrams so object diagrams are dependent upon class diagrams. Object diagrams represent an instance of a class diagram. The basic concepts are similar for class diagrams and object diagrams. Object diagrams are used to render a set of objects and their relationships as an instance.
II. Related work
The evaluation process of conceptual specifications developed using either Extended Entity-Relationship (EER) or Unified Modeling Language (UML) conceptual models. It provides a comprehensive framework for evaluating EER and UML conceptual schemas. Furthermore, it defines classes of metrics facilitating the evaluation process and leading to the choice of the appropriate representation among several schemas describing the same reality. Based on quality criteria proposed in the literature to select a subset of criteria relevant to conceptual EER schema quality evaluation. Finally, this evaluation process to UML schemas Following the development of framework, analyze a case study and provide evidence in the support of the usefulness of the framework.
The EER contains all concepts of ER. EER adds more concepts like Specialization/Generalization, Subclass/Super Class, Categories and Inheritance to get more accuracy than ER. UML includes a set of graphic notation techniques to create visual models of Object-oriented software intensive systems. Unified Modeling Language is a standard for software development. EER Diagram on the other hand is used for database design.
Executable UML is fundamental approach to Model Driven Architecture a new way of writing specifications and developing applications, based on a platform-independent model (PIM).In software engineering, many industries used to build systems by soldering wires together to form hard-wired programs. Notion of object-orientation, an approach for structuring data and behavior together into classes and objects. Its moved from one language to another, Increased the level
of abstraction at which the developer operates, requiring the developer to learn a new higher-level language that may then be mapped into lower-level.
The experiment and two replications aimed at comparing the support provided by ER and UML class diagrams during comprehension activities by focusing on the single building blocks of the two notations. The results reveal that UML class diagrams are generally more comprehensible than ER diagrams, even if the former has some weaknesses related to three building blocks. These findings suggest that a UML class diagram extension should be considered to overcome these weaknesses and improve the comprehensibility of the notation. A data model is a set of concepts that can be used to describe both the structure of and the operations on a database.
UML can be used to study mappings to different types of database systems. Introducing UML through a comparison to the EER model, UML diagrams are used to teach different approaches for mapping conceptual designs to the relational model. It cover object-oriented and object-relational database systems, different features of UML are used over the same enterprise to understand mapping alternatives for each model for object-oriented and object-relational database systems. In the relational and object-relational models that require the development of code to maintain inverse relationships to address the mapping techniques from the point of view.
III. PREVIOUS IMPLEMENTATIONS
© 2015, IRJET.NET- All Rights Reserved
Page 392
Attributes
These describe the elementary properties of entities or relationships. An attribute associates with each instance of an entity (or relationship) a value belonging to a set known as the domain of the attribute. The domain contains the admissible values for the attribute.
For example, Surname, Salary and Age are possible attributes of the Employee entity, while Date and Mark are possible attributes for the relationship Exam between Student and Course.
Composite Attributes
It is sometimes convenient to group attributes of the same entity or relationship that closely connected meanings or uses. Such groupings are called composite attributes.
Cardinalities
[image:3.595.311.552.223.376.2]These are specified for each entity participating in a relationship and describe the maximum and minimum number of relationship occurrences in which an entity occurrence can participate. Cardinalities state how many times an entity instance can participate in instances of a given relationship.
Fig. 3.3 Cardinalities
Modeling an Application with Identifiers
Identifiers constitute a powerful mechanism for modeling an application. Assume a database storing information about lecture meetings. Suppose first that we use the identifier course name, course name day, hour for the Meeting entity. It says, that there can only be one meeting at any one time for a given course name, day, hour; in other words can’t have two sections of the same course meeting at the same day hour. Suppose now use only course name as identifier for Meeting.
IV. SYSTEM IMPLEMETNATION
UML stands for Unified Modeling Language which is used in object oriented software engineering. Although typically used in software engineering it is a rich language that can be used to model an application structures, behavior and even business processes. There
are 14 UML diagram types to help you model this behavior. They can be divided into two main categories structure diagrams and behavioral diagrams.
4.1 Class Diagram
[image:3.595.101.221.441.500.2]Class diagrams are used UML diagram type. It is the main building block of any object oriented solution. It shows the classes in a system, attributes and operations of each class and the relationship between each class.
Fig. 4.1 Class Diagram
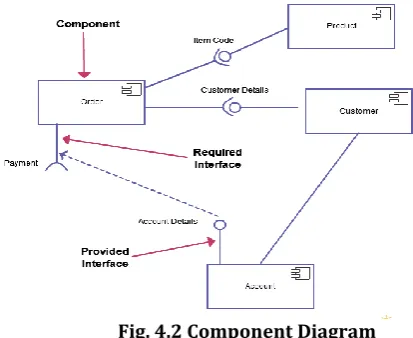
4.2 Component Diagram
A component diagram displays the structural relationship of components of a software system. These are mostly used when working with complex systems that have many components.
Fig. 4.2 Component Diagram
4.3 Deployment Diagram
[image:3.595.310.517.473.642.2]© 2015, IRJET.NET- All Rights Reserved
Page 393
4.4 Object Diagram
[image:4.595.76.257.171.268.2]Object Diagrams, sometimes referred as Instance diagrams are very similar to class diagrams. As class diagrams they also show the relationship between objects but it use real world
Fig. 4.4 Object Diagram
4.5 Package Diagram
A package diagrams shows the dependencies between different packages in a system. Check out to learn more about the dependencies and elements found in package diagrams.
4.6 Profile Diagram
Profile diagram is a new diagram type introduced in UML. This diagram type that is very rarely used in any specification. For more detailed technical information about this diagram.
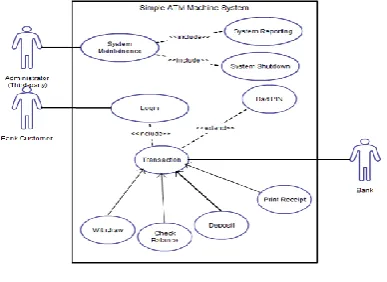
4.7 Use Case Diagram
Use case diagrams gives a graphic overview of the actors involved in a system, different functions needed by those actors and how these different functions are interacted.
Fig. 4.8 Use case Diagram
4.8 Activity Diagram
[image:4.595.333.511.205.325.2]Activity diagrams represent workflows in a graphical way. They can be used to describe business workflow or the operational workflow of any component in a system. Sometimes activity diagrams are used as an alternative to State machine diagrams.
Fig. 4.9 Activity Diagram
4.9 State Machine Diagram
State machine diagrams are similar to activity diagrams although notations and usage changes a bit. In sometime known as state diagrams or start chart diagrams as well.
4.10 Sequence Diagram
Sequence diagrams in UML shows how object interact with each other and the order those interactions occur. It’s important to note that show the interactions for a particular scenario. The processes are represented vertically and interactions are show as arrows.
4.11 Communication Diagram
Communication diagram was called collaboration diagram in UML. It is similar to sequence diagrams but the focus is on messages passed between objects. The same information can be represented using a sequence diagram and different objects.
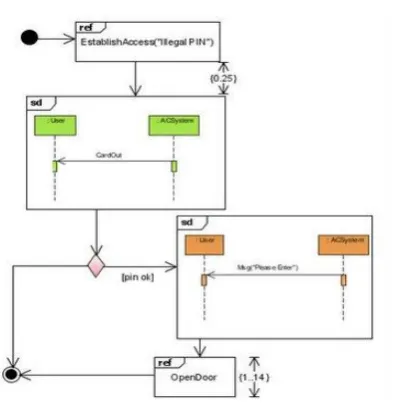
4.12 Interaction Overview Diagram
[image:4.595.76.270.547.688.2]© 2015, IRJET.NET- All Rights Reserved
Page 394
Fig. 4.13 Interaction Overview Diagram
4.13 Timing Diagram
Timing diagrams are very similar to sequence diagrams. It represents the behavior of objects in a given time frame. It’s only one object the diagram is straight forward but if more than one object are involved they can be used to show interactions of objects during that time frame as well.
EVALUATION RESULT:
The comparison table based on the Software Engineering course to design notation used is EER while for the Databases course the design notation is UML. The numbers of subjects involved in the original experiment of 37 fresher students. The selection of the objects for each experiment is performed ensuring that the data models to a comparable level of time complexity.
[image:5.595.69.275.91.297.2]Table. 5.1 Descriptive Statistics of the Results
Fig. 5.3 Line Chart
Fig. 5.4 Pie Chart
CONCLUSION
© 2015, IRJET.NET- All Rights Reserved
Page 395
In another conceptual data model is OO/OMTModel, object oriented (OO) data modeling represents the object identities, and separation of public and private portions of objects. OO model its advantages in ease for object structure identification in a system, inheritance of properties and methods, ability to the model complex objects. The technique: Semantic Object Model (SOM), Object Role Modeling (ORM), Unified Modeling Language (UML) and Object Modeling Technique (OMT).
REFERENCES:
1. Abiteboul S, Hull R, Vianu V, “Foundations of databases”, Addison Wesley, USA, 1995.
2. Samira S, Jacky D, Isabelle W, “Conceptual Modeling Quality From EER to UML Schemas Evaluation”, LNCS 2503, Berlin Heidelberg, 2002.
3. Baader F, Calvanese D, McGuinness D.L, Nardi D, Patel-Schneider P, “Description Logics Handbook”, Cambridge University Press, 2003.
4. Davor Gornik, “Entity Relationship Modeling with UML”, IBM,2003.
5. Helen C, Ray Welland, Matthew McGill and Linda Colpoys, “Comprehension of diagram syntax: an empirical study of Entity Relationship notations”, International Journal of Human-Computer Studies, 2004.
6. Andrea De Lucia, Carmine Gravino, Rocco Oliveto, “An experimental comparison of ER and UML diagrams for data modeling”, Springer Science+Business Media, LLC,2009. [email protected].
7. Bhandare Milind, Deshmukh Dipali, Jagtap Rajnandini, Kolhal Devyani, “Generation of UML Class Diagram, Database & Workspace from EER Diagram”, International Journal of Emerging Technology and Advanced Engineering, ISSN 2250-2459.2012, www.ijetae.com.
8. Susan D, UrbanSuzanne W, Dietrich S,“Using UML Class Diagrams for a Comparative Analysis of Relational,
Object-Oriented, and Object-Relational Database
Mappings”, Arizona State University Tempe, 2013. 9. Shivaji Arjun Kakad, Prof. Y. N. Patil, “EER To UML
Model Transformation Using Atlas Transformation
Language (ATL)”, International Journal for
Technological Research, ISSN (Online): 2347 – 4718, 2014.
10. Ahmad A, Shamailh, “An Experimental Comparison of ER and UML Diagrams” Mutah University, Jordan, 2015, [email protected].