© 2016, IRJET ISO 9001:2008 Certified Journal
Page 428
COST ANALYSIS OF SOLAR POWER GENERATION SYSTEM USING
HOMER OPTIMIZATION SOFTWARE
Nandita Rana
1, Mamta chamoli
21
M.tech Scholar, EED, Uttarakhand Technical University, Dehradun, Uttarakhand, India
2Assistant Professor, EED, Uttarakhand Technical University, Dehradun, Uttarakhand, India
---***---Abstract – As the most important issues of the world now a days is the depletion of the fossil fuel reserves so we need to find out a solution to conserve such non renewable resource and change them from other renewable resource such as solar power. The next concern is the rising level of the unwanted gases such as carbon dioxide or carbon monoxide. There is a need of controlling the level of such gases. In this paper we discusses that how the level of carbon emission can be controlled by changing the grid supply with the solar panels to power the campus of Uttarakhand Technical University. India today stands number one in terms of solar electricity production per watt installed having a total of 300 sunny days. This gives us a good opportunity to use solar power for electricity generation. The increase in interest in solar energy is due to asset subsidies, duty holidays and government action towards renewable energy playing a big part in nation’s energy system therefore solar power plant is used in this study of cost based analysis. HOMER model is used for optimization which shows that the level of carbon emission reduces from 20,520 kg/year to 83.3 kg/year when we install the solar panel in the campus.
Key Words: Solar Power Plant, HOMER, Carbon Emission, Systems
1. INTRODUCTION
Electricity has been around us for centuries, growing and changing day by day. Without electricity the world would have not been the same. The human relies on electricity to be always available and to perform its functions. Usage of electricity has been increased every year since 1949. Not only has electricity usage been rapidly increasing, energy cost is rising and energy possibility is decreasing. With this consecutive growth in electricity usage as well as in its cost, new and unique methods of producing electricity are being developed constantly. Moving to alternative energies to produce electricity is from all the way back to the 18th century but has gained thrust recently. This energy comes from the sources that renew themselves, such as the sun, rivers, wind, ocean waves and tides. Our Uttarakhand Technical University in Dehradun has seen the solar potential and has decided to invest in solar powered systems. This study
will determine if it will be beneficial to install solar panels, thus making a sustainable environment. The type of panels needed to power the campus will be determined. It will prove as an analysis not only for the campus investment, but any other institution considering the integration of solar energy.
1.1 Indian Potential
Estimation of the India’s Energy Portal states that if only 10% of the land comes into usage for the solar energy then the installed capacity may become 8000GW which is around 50 times more than the current installed capacity of the country. For example, if the conversion efficiency for PV module be only 10% than also it will be thousand times greater than the electricity demand in India. The production during daytime makes it coincide with the electricity demand that is the solar becomes ideal for the supply to grid.
The main strategy of India is to balance the grid (arrest around Rs 5/KWH) by 2022 and balance the coal generation (presently around Rs 4/KWH) by 2030, which will be the most important element in India’s long term strategy. If we consider the solar annual isolation then the solar power could easily manage the long term energy requirement of India. Despite it can be cost competitive.
2. HOMER SOFTWARE
© 2016, IRJET ISO 9001:2008 Certified Journal
Page 429
Fig- 1 Model of Load connected to Grid
Fig-2 Model of Load connected to Solar PV and Grid
3. ENERGY ANALYSIS
3.1 LOAD PROFILE
The load profile of the assumed load is shown in the Fig- 3 and is based on the main building of the campus. A load of around 1KW remains throughout the day in the 24 hour profile while a maximum load of 13KW appears at the noon. The daily average load is 94KWh.
Fig-3 Hourly load profile
3.2 SOLAR RADIATION PROFILE
In the Fig-4, the solar radiation data for a time period of one year for Uttarakhand is shown which is obtained from the NASA surface Meteorology website. The location of Uttarakhand is approximated to 300 59’ N to 770 59’ E. The average clearness index is estimated as 0.625 while the average daily radiation is 5.42 KWH/m2/Day.
Fig-4 Solar Radiation Profile for Uttarakhand
4. IMPLEMENTATION OF HOMER
4.1 System Layout
The project implemented consists of equipments such as photovoltaic solar cell, a battery, a converter and the load. The cost and size of equipment are entered in the HOMER software as the inputs which are shown in the Table-1 while the Fig-5 shows the various components.
4.2 System Performance
4.2.1 Solar PV system
The capital and replacement cost of the solar PV panels is estimated at $371/KW while the operating and maintenance cost is $10/KW. The derating factor of 80% and life span of 30 years was assumed. The panels are fixed and tilted as specified in the Fig-7
4.2.2 Battery System
A single EXIDE of 12V and capacity of 250Ah is used
and shown in Fig- 84.2.3 Converter and Inverter
© 2016, IRJET ISO 9001:2008 Certified Journal
Page 430
4.2.4 Load Details
The UTU load consists of various tube lights, motors, streetlights etc. The load detail is shown in the Fig-10
[image:3.595.85.537.41.750.2]Fig-5 Equipment used in the system
Table -1 System Components
Component Size Capital Cost Replacement Cost
O&M Cost
Lifetime
PV Panel 20KW $ 371/KW $ 371/KW $ 10/ year
30 years
Battery 250Ah/ 12V , 1-10
batteries
$197/battery $152/battery $7.20/ year
Lifetime throughput
1000KWH
Converter 10-30 KW $76/KW $76/KW $3/KW 15 years
[image:3.595.37.264.159.316.2]
Fig- 7 PV Inputs
[image:3.595.31.293.372.683.2]Fig-8 Battery Input
Fig-9 Converter Input
Fig-10 UTU load
[image:3.595.309.538.446.688.2]© 2016, IRJET ISO 9001:2008 Certified Journal
Page 431
[image:4.595.36.286.135.191.2]proposed model. Here, in this paper we have compared the net present cost and the carbon emission.
Fig-6 Net Present Cost of the only Grid system
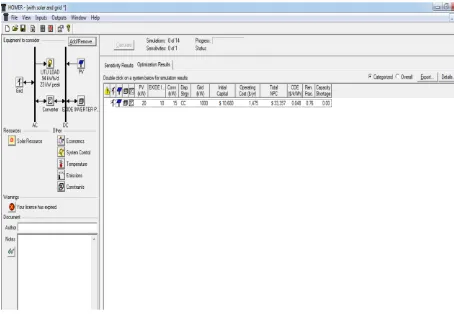
[image:4.595.308.539.245.365.2]The Net Present Cost of the only grid system is $33,876. While the Net Present cost of the Solar PV system is $33,357.
Fig-11 Net Present Cost of the solar and grid system
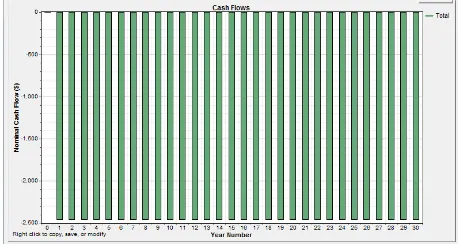
[image:4.595.37.267.274.336.2]The overall cash flow analysis of the two systems is showed in the Fig-5 and Fig-6 respectively.
Fig-12 The cash flow of the grid system
Fig-13 The cash flow of the solar PV system
[image:4.595.36.265.404.527.2]Fig- 14 Emissions in Grid system
Fig- 15 Emission in solar and grid system
5. RESULT DISCUSSION
The total output of the optimization depends on Net
Present Cost. All other parameters are defined according to the Net Present Cost and an overall result is obtained. The initial capital cost was $7420 while the total cost comes out to be $33.357 in the solar PV system. The savings in this new system is not only through the cost but also through the carbon emission. The carbon emission result shows a huge difference of 24,254 kg/year.Table – 2: Comparison of the two systems
Comparison of the two systems
Particulars Grid only With solar and grid
Savings
Net Present Cost $ 33,876 $ 33,357 $ 510
Operating and Maintenance Cost
2,461 $/yr 2,170 $/yr 246 $/yr
Emission kg/yr 24,353 kg/yr 98.867 kg/yr 24254 kg/yr
Carbon Content 20,520 kg/yr 83.3 kg/yr 20436.7 kg/yr
6. CONCLUSION
[image:4.595.34.559.555.708.2]© 2016, IRJET ISO 9001:2008 Certified Journal
Page 432
the University to save their money after sometime of installation. But the most impactful result is the control of carbon emission which 20,520 kg/year using the grid while it is only 83.3 kg/year if we install the system. This concludes that our system installation will really help in the control of emission which is the most important concerns of the environment in today’s world.
REFERENCES
[1] H. Al-Badi, M. AL-Toobi, S. AL-Harthy, Z. Al-Hosni, A. AL-Harthy, 2012. Hybrid systems for decentralized power generation in Oman, International Journal of Sustainable Energy, Vol. 31, Issue 6, pp 411-421.
[2] Bindu U Kansara and B.R. Parekh, 2011. Modeling and Simulation of Distributed Generation System Using HOMER Software, International Conference on Recent Advancements in Electrical, Electronics and Control Engineering,, IEEE, p-328-332.
[3] Deepak Kumar Lal, et al., “Optimization of PV/wind/Micro-Hydro/Diesel Hybrid Power System in HOMER”, International Journal on Electrical Engineering and Informatics, vol. 3, pp.307–325, 2011.
[4] Munuswamy, S., Nakamura, K., Katta, A., “Comparing the cost of electricity sourced from a fuel cell-based renewable energy system and the national grid to electrify a rural health centre in India: A case study”, Renewable Energy, vol. 36, pp. 2978–2983, 2011.
[5] J.B. Fulzele and Subroto Dutt, “Optimum Planning of Hybrid Renewable Energy System Using HOMER”,
International Journal of Electrical and Computer Engineering, vol. 2, pp.68-74, Feb. 2012.