© 2015, IRJET ISO 9001:2008 Certified Journal
Page 582
OPTIMAL FEATURE SELECTION BY GENETIC ALGORITHM FOR
CLASSIFICATION USING NEURAL NETWORK
Swati N.Moon
1, Dr. Narendra Bawane
21
Student, Department of Electronics Engineering, S.B. Jain Institute of Technology Management
&Research, Maharashtra, India
2
Principal, Department of Electronics Engineering, S.B. Jain Institute of Technology Management &
Research, ,Maharashtra ,India
---***---Abstract -
The present study considers three mentaltasks which includes left hand movement imagination ,right hand movement imagination and generation of words beginning with the same random letter. These tasks are
classified by using neural network(NN).For good
classification the features should be properly extracted and classified both of which are crucial process. These processes greatly affects the performance of the classifier. Numerous methods for feature extraction are available. In the present study the electroencephalographic(EEG) data samples are obtained from BCI III dataset V. The dataset provides pre-computed features which are pre-computed by using PSD. The feature vector contains 96 features. The irrelevant and superfluous features affects the performance of the classifier. To improve the performance of the classifier it is necessary to select only the important features. The present study uses Genetic Algorithm (GA) for selecting the useful and important features. These features are then fed to the classifier and performance of the classifier is estimated. The focus of the present work is to reduce the dimension of feature space and improve the performance of the classifier.
Key Words:
EEG, Genetic Algorithm ,Mental task,
Neural Network ,PSD .
1.INTRODUCTION
A brain-computer interface is an interface system which allows users to control devices without using the normal output pathways of peripherals, instead, by using neural activity generated by the brain [2] . It offers an alternative to natural communication and control. BCI directly measures brain activity associated with the user’s intent and translates the recorded brain activity into corresponding control signals for BCI applications. Since the measured activity originates directly from the brain and not from the peripheral systems or muscles, the system is called a Brain–Computer Interface[2].A BCI may also be known as a Mind-Machine Interface [3].BCI technology can be extremely useful in assisting, augmenting or repairing human cognitive or sensory-
motor functions. An electroencephalogram (EEG) is the basic building block for Brain-Computer Interfaces. EEG is used to measure the brain signals pertaining to various activities like imagining hand movements, leg movement etc. The EEG recognition procedure mainly involves feature extraction from EEG and classification of mental task. The useful EEG signals contain huge data of brain signals. Numerous methods have been used to extract feature vectors from the EEG. In this study features are extracted by PSD using Welch Periodogram Method. The extracted features contains a feature vector of large dimension. The study is to reduce the dimension of feature vector at the cost of improving the accuracy of the classifier. For this purpose a good feature selection technique is required. Genetic Algorithm is one such technique which helps to select the optimal features .These selected features are then fed to the classifier for classification. Three layer feed forward neural network is used in the study to classify these tasks.
2.PROPOSED WORK
This study includes:
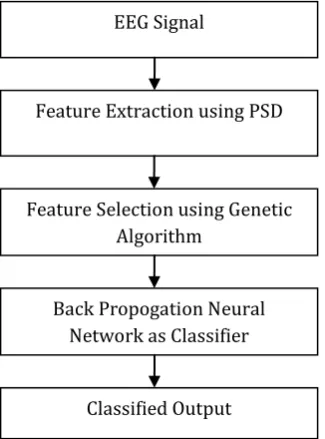
1. Obtaining EEG data samples from BCI database. 2. Extracting features using PSD technique. 3. Selecting the most important features using genetic Algorithm.
4. Classifying the given mental task by using neural network back propagation algorithm.
The block diagram of the proposed method is shown in Fig.1.
3. METHODOLOGY
© 2015, IRJET ISO 9001:2008 Certified Journal
Page 583
Fig -1: Block Diagram of the Proposed Method3.1 Dataset
The dataset contains data from three normal subjects .The subject were told to sit with the relaxed arms on a chair. For each subject four sessions were conducted on the same day. Each session was 4 min long with 5-10 min break in between each session. The subject performed a given task for 15 mins and then switch to another task as instructed by the
operator. Three mental tasks were
considered [5].
1. Left-hand movement Imagination (left). 2. Right-hand movement Imagination (right).
3. Word generation beginning with the same random letter (word).
[image:2.595.66.229.123.343.2]Fig.2 shows the placements of electrodes used in this study.
Fig- 2: Placement of Electrodes
In this case the EEG signals were recorded with a Biosemi system using a cap having 32 integrated electrodes. These electrodes are located according to the standard positions of the International 10–20 system. The sampling rate was 512 Hz. EEG data was not split into trials. The dataset contained pre-computed features. The raw EEG data was firstly spatially filtered by surface Laplacian. [4]. The PSD was estimated after every 62.5ms (i.e., 16 times per second) in the 8–30 Hz band .Frequency resolution of 2 Hz is used for the eight centro-parietal channels. The channels used are C3, Cz, C4, CP1, CP2, P3, Pz, and P4. The PSD was estimated by Welch periodogram method [5]. Finally an EEG sample data of dimension 96 is obtained[6].
3.2 Data Pre-Processing
The dataset contains large no of training and testing samples. If these samples are fed to the classifier directly then it takes more time for classification. Thus the data is first pre-processed. The step size is set to 8.Mean of the successive 8 samples is taken. Thus the training samples and testing samples are reduced from higher dimension to lower dimension. These reduced training samples are used for classification. The performance of the network is tested on pre-processed test data samples.
3.3 Feature Extraction
Various methods are available for extracting features from the raw EEG signal such as time domain, frequency domain, and time-frequency domain. In this work we used PSD for feature extraction.
Welch allows the data segments to overlap and window the data segments prior to computing periodogram. Here the 256 point sequence is subdivided into 8 overlapping segments with 50% overlap; each segment is windowed by hamming window. Then PSD is calculated in the frequency band of 8 Hz to 30 Hz. Thus 12 PSD components were calculated for each channel. Therefore for 8 channels 96 PSD components was obtained. Welch method have two basic modifications to the Bartlett method. These are it allowed the data length to overlap. The data segment can be represented as
Where iD is the starting point for the ith sequence. If D = M, the segment do not overlap and the L of data sequence is identical to the data segment of Bartlett method. The second change in Welch method is to window the data segments prior to computing the periodogram.
Feature Extraction using PSD
Feature Selection using Genetic Algorithm
Back Propogation Neural Network as Classifier
© 2015, IRJET ISO 9001:2008 Certified Journal
Page 584
Where U is a normalization factor for the powerThe Welch power spectrum estimate is the average of modified periodogram
Mean value of Welch estimate
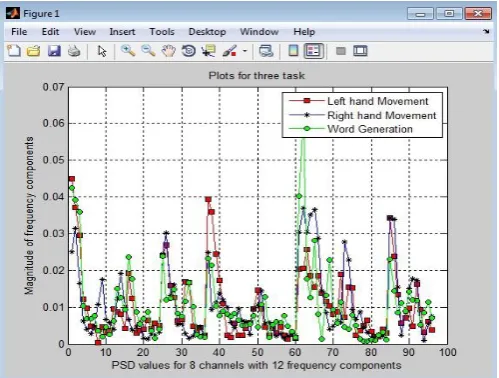
[image:3.595.37.287.441.630.2]The resolution of estimated power estimation is determined by the spectral resolution of each segment which is of length L, it is window dependent.The PSD plot obtained using Welch Method is shown in Fig 3.
Fig -3: PSD plot for three tasks(left hand movement imagination, right hand movement imagination and word generation)
3.4
Feature Selection
Feature selection is one of the major tasks in classification problems. The main purpose of feature selection is to choose a subset of features that improves the performance of the classifier specially in case of high dimensional data.
Reducing the dimension of the feature space not only reduces the computational complexity, but also increases estimated performance of the classifiers. In the past, various algorithms have been used for feature selection. Among them GA is one of the best methods that can be used for feature selection. The GA is a powerful tool for selecting features, particularly when the dimensions of the original feature set are large .
Genetic Algorithms are adaptive heuristic search algorithm premised on the evolutionary ideas of natural selection and genetic .In the past decades it had been widely used in various fields as an optimization technique. In this study it is used as an optimization tool to optimize the features. The feature vector contains 96 features. This study focuses on reducing the dimension of the feature vector without affecting the performance of the classifier. In the present study GA runs for 10 generations. In each generation it randomly generates 10 chromosomes. Each chromosome is encoded in binary string of length 8 bit. These chromosomes are first converted into decimal. In each generation the NN is run 10 times for 10 chromosomes. Each time NN takes input as features randomly generated by GA. The NN is initially run on only 30 data samples to reduce the computational time of NN. The Fitness value(Fv) consists of the mean square error (mse) generated by the NN. Fitness value is calculated for 10 chromosomes. These values are then sorted in order to find the Fv with least mse. This value is then selected as parent. The parent chromosome then undergoes crossover and mutation. Either single point or double point crossover can be used. This process is repeated for 10 generations. At the end of 10th generation best
[image:3.595.312.557.547.703.2]chromosome i.e besti with least fitness value is obtained. Now the network is trained on complete training samples which are obtained after pre-processing for the besti features. The performance of the network is tested on test data samples. The flowchart of GA is shown in Fig 4.
Fig-4: Flowchart of Genetic Algorithm
© 2015, IRJET ISO 9001:2008 Certified Journal
Page 585
In this study classification is the last step which is done toevaluate the performance of the system. Three mental tasks are considered which include left hand movement imagination, right hand movement imagination and generation of words. The features extracted by PSD contains large dimension i.e 96 features. In order to improve the performance of the classifier and reduce its computational time only the important and distinguished features are considered whereas the irrelevant and superfluous features are not considered. For this purpose Genetic Algorithm is used . Finally the features selected by GA ie besti are applied to the input of classifier. Feed forward neural network is used for classification. It consists of two hidden layers and one output layer. The hidden layers contains 10 and 6 neurons respectively .The output layer contains 1 neuron. Tansig and logsig activation functions are used for hidden layer. Three layer feed forward neural network is used as shown in Fig 5[12].
Fig- 5:Three-layer feed-forward neural network
In the above figure Kln and nHid represent the number of input nodes and hidden nodes respectively. The features selected by GA are applied to the input layer. These inputs are then distributed to each unit in the hidden layer. The learning rate is set to be 0.1.In one iteration the NN runs 10 times as the number of chromosomes are 10. This process is repeated for 10 iterations. After training the NN is tested on the test data samples and the accuracy is estimated.
4.RESULT
In this work three tasks left hand and right hand imaginary movement and word generation has been classified using Back propagation neural network .The features are extracted using PSD and the features are selected using Genetic Algorithm. Table I below shows the
comparison between different number of features and the classification accuracy.
Table- I: Comparative results for different features and
their classification accuracy
Sr.No Features Classification Accuracy
1 47 72.37
2 60 78.08
3 63 73.97
4 73 74.42
5 89 74.65
The GA is run for 10 generations. After 10 generations the GA selected 60 features for which the classification accuracy of 78.08% is obtained.
5. CONCLUSIONS
The present study uses EEG signals from BCI III dataset V. GA is used for selecting the most relevant features.GA generates different number of features randomly. In each iteration 10 features are randomly generated. These features are then fed to the classifier. Fitness function is calculated for 10 chromosomes. This process is repeated for 10 generations. After 10 generation the best chromosome which gives least fitness value is obtained i.e besti. Then the performance of the network is tested on test data samples and the classification accuracy is estimated.
6. FUTURE WORK
The future work focuses on using different methods for selecting the features and improving the accuracy of the classifier . Also the experiment is performed on the standard BCI database. In future the experiment can be performed on EEG data recorded using experimental setup.
ACKNOWLEDGEMENT
© 2015, IRJET ISO 9001:2008 Certified Journal
Page 586
REFERENCES
[1] Swati Moon, Narendra Bawane, Pratik Hazare “Selection of Optimum Features for Neural Network Using Genetic Algorithm in Classification of Brain Computer Interface Data”,IJARCCE 2015.
[2] Bernhard Graimann, Brendan Allison, and Gert Pfurtscheller “Brain–Computer Interfaces: A Gentle Introduction”, Springer-Verlag Berlin Heidelberg 2010.
[3] Anupama.H.S, N.K.Cauvery, Lingaraju.G.M “Brain Computer Interface and its Types-A study”, International Journal of Advances in Engineering & Technology, Vol. 3, pp. 739-745May 2012.
[4] D.J. McFarland, L.M. McCane, S.V. David, J.R. Wolpaw, Spatial filter selection for EEG-based communication, Electroen. Clin. Neurophysiol. 103 (1997) 386–394. [5] S.K. Mitra, Digital Signal Processing: A Computer- Based Approach, second ed, McGraw-Hill, Inc., New York, 2001.
[6] http://www.bbci.de/competition/iii/desc_V.html [7] Jaime F. Delgado Saa, Miguel Sotaquirá Gutierrez
“EEG Signal Classification Using Power Spectral Features and linear Discriminate Analysis: A Brain Computer Interface Application” Eighth LACCEI Latin American and Caribbean Conference for
Engineering and Technology (LACCEI’2010)
“Innovation and Development for the Americas”, June 1-4, 2010, Arequipa, Perú.
[8] Rebeca Corralejo, Roberto Hornero, Daniel Alvarez “Feature Selection using a Genetic Algorithm in a Motor Imagery based Brain Computer Interface”, Interntional Conference of IEEE,September 2011. [9] L.M. Patnaik , Ohil K.Manyam “Epileptic EEG
detection using neural networks and post-classification”,Elsevier ,Computer Methods and Programs in Biomedicine,2008.
[10] K.V.R.Ravi and R.Palaniappan “A Minimal Channel Set for Individual Identification with EEG Biometric Using Genetic Algorithm”, International Conference on Computational Intelligence and Multimedia Applications ,IEEE 2007.
[11] Jianhua Yang, Harsimrat Singh, Evor L. Hines, Friederike Schlaghecken , Daciana D. Iliescu, Mark S. Leeson, Nigel G. Stocks “Channel Selection and Classification of electroencephalogram signals: An artificial neural network and genetic algorithm based approach”, Elsevier, Artificial Intelligence in Medicine,2012.
[12] Cheng-Jian Lin , Ming-HuaHsieh “Classification of mental task from EEG data using neural networks based on particle swarm optimization” , Elsevier, Neurocomputing ,2009.
[13] S.Ramat, N Caramia “A General Purpose Approach to BCI Feature Computation Based on a Genetic Algorithm: Preliminary Results”, XIII Mediterranean