Journal of Chemical and Pharmaceutical Research
__________________________________________________
ISSN No: 0975-7384 CODEN(USA): JCPRC5
J. Chem. Pharm. Res., 2011, 3(6):348-360
Formulation development of bi-layer acetaminophen tablets for
extended drug release
Hosna Banu, Mostafa Reaj Sahariar, Muhammad Shahdaat Bin Sayeed, Irin Dewan and S.M. Ashraful Islam*
Department of Pharmacy, University of Asia Pacific, Dhanmondi, Dhaka, Bangladesh ______________________________________________________________________________
ABSTRACT
The objective of this study was to design acetaminophen extended release bi layer tablets containing immediate release layer and extended release layer. Tablets were prepared by wet granulation technique using different grades of hydroxypropylmethyl cellulose (HPMC 15 cps, HPMC 100 cps and Methocel K4m CR) as release rate retardant and tablets were evaluated for hardness, friability, weight variation, thickness and drug content uniformity. In vitro release studies were performed using USP type II apparatus (paddle method) in 900 mL of 0.1N HCl at 50 rpm for 4 hours and compared with USP specification. In vitro release studies revealed that the release rate decreased with increase of polymer loading and viscosity. Formulation ER-4 (containing 10% HPMC 100 cps and 1.5% sodium starch glycolate) and ER-6 (containing 1.5% Methocel K4M CR and 0.5% sodium starch glycolate) were found to follow compendial specification for drug release profile. Drug release was analyzed using zero-order, first order, Higuchi and Korsmeyer-Peppas equations to explore and explain the mechanism of drug release from the bi layer matrix tablets. Mathematical analysis of the release kinetics indicated that release from the matrix tablets followed Fickian diffusion. So the bi-layer tablets could be a potential dosage form for delivering acetaminophen.
Keywords: Acetaminophen, Bi Layer tablet, Extended drug release, Dissolution comparison.
______________________________________________________________________________
INTRODUCTION
drug concentration for a short period of time. Conventional formulations are required to be administered in multiple doses and therefore have several disadvantages. Extended release (ER) tablet formulations are preferred in some cases because they maintain uniform drug levels, reduce dose and side effects, increase the safety margin for high-potency drugs and thus offer better patient compliance [1-2].
Acetaminophen has analgesic, antipyretic properties with weak anti-inflammatory activity and it is used in the symptomatic management of moderate pain and fever [3]. When taken at recommended doses it has an excellent safety profile with less gastrointestinal (GI) side effects [4].
Acetaminophen is one of the most popular over-the-counter drugs. It is available in different dosage forms: tablet, capsules, drops, elixirs, suspensions and suppositories [5]. The drug is official in different pharmacopeia [6-7]. USP contain monograph both immediate and extended release acetaminophen tablet. Now, immediate release acetaminophen tablets as weal as extended release acetaminophen tablets are available in the market. USP describes multipoint dissolution study for extended release acetaminophen tablets. Incompliancy of dissolution profile of extended release acetaminophen tablets has already been reported. So attempt has been taken to develop extended release acetaminophen bilayer tablet for better patient compliance.
Bilayer tablets concept has long been utilized to develop extended release and immediate formulation for a single drug or combination of drugs [8]. Bi-layer extended release tablet generally has a fast releasing layer and control releasing layer to sustain the drug release. The pharmacokinetic advantage relies on the criterion that, drug release from the fast releasing layer leads to a sudden rise in the blood concentration and the blood level is maintained at steady state by the sustained release layer [9]. The present study is planned to evaluate the suitability of different polymers for bilayer matrix tablets. Formulations were evaluated with respect to various parameters like weight variation, hardness, friability, thickness, content uniformity and in vitro dissolution rate.
The immediate release layer and extended release layer were prepared by wet granulation technique. Hydroxypropylmethyl cellulose (HPMC 15 cps, HPMC 100 cps and Methocel K4M CR) was used as release rate retardant. Hydroxypropylmethyl cellulose (HPMC) is used frequently as a rate-controlling polymer in matrix tablets [10]. HPMC offers the advantages of being non-toxic and relatively inexpensive; it can be compressed directly into matrices and is available in different chemical substitution and hydration rates and viscosity grades [11-12].
EXPERIMENTAL SECTION
Materials
analytical-reagent grade and purchased from E. Merck, Darmstadt, Germany. Water was deionised and double distilled.
Preformulation studies
Study was carried out by using infrared spectrophotometer to find out if there is any possible chemical interaction of acetaminophen with micro crystalline cellulose, HPMC, aerosil 200, sodium starch glycolate and Magnesium stearate. Weighed amount of drug (3 mg) was mixed with 100 mg of potassium bromide (dried at 40 to 500C). The mixture was taken and compressed under 10-ton pressure in a hydraulic press to form a transparent pellet. The pellet was scanned in Schimadzu FTIR 8400S spectrophotometer. The same procedure was repeated for the excipients and the physical mixture of drug and excipients.
Preparation of acetaminophen bilayer matrix tablets
The bilayer matrix tablets of acetaminophen were prepared by the wet granulation technique. Acetaminophen, polymers and other excipients for both fast release and sustaining release layer were passed through sieve #80 before their use in the formulation.
Formulation of the fast release layer
[image:3.595.77.522.475.596.2]Half of the dose of drug in the formulation (332.5mg acetaminophen) was used for fast release layer. The fast release granules were prepared as per composition in table 1. Acetaminophen was mixed uniformly with microcrystalline cellulose and colloidal anhydrous silica. Aqueous solution of povidone k- 30 was added to the powder to make it cohesive mass that was passed through # 16 to form granules and the granules were dried at 60°C for 1 hr in a hot air oven. The dried granules were passed through # 20 and lubricated with magnesium stearate by further blending for 3 min. Sodium starch glycolate was added in final blending.
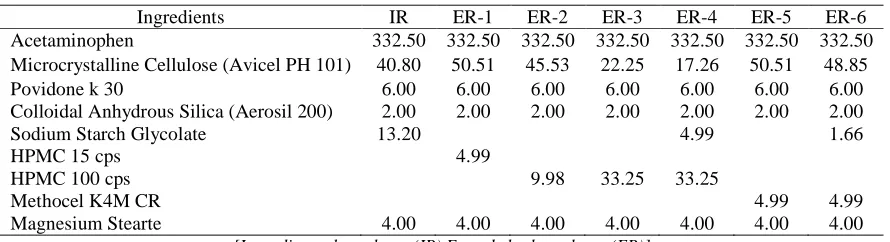
Table 1 Composition of acetaminophen bi-layer tablets (mg/tablet)
Ingredients IR ER-1 ER-2 ER-3 ER-4 ER-5 ER-6 Acetaminophen 332.50 332.50 332.50 332.50 332.50 332.50 332.50 Microcrystalline Cellulose (Avicel PH 101) 40.80 50.51 45.53 22.25 17.26 50.51 48.85
Povidone k 30 6.00 6.00 6.00 6.00 6.00 6.00 6.00
Colloidal Anhydrous Silica (Aerosil 200) 2.00 2.00 2.00 2.00 2.00 2.00 2.00
Sodium Starch Glycolate 13.20 4.99 1.66
HPMC 15 cps 4.99
HPMC 100 cps 9.98 33.25 33.25
Methocel K4M CR 4.99 4.99
Magnesium Stearte 4.00 4.00 4.00 4.00 4.00 4.00 4.00
[Immediate release layer (IR) Extended release layer (ER)]
Formulation of the sustained release layer
Compression of bilayer tablets
Sustained release layer was compressed first followed by immediate release layer. The quantity of granules for the sustained release layer was compressed lightly using 13 mm-diameter die of an infrared hydraulic press. Over this compressed layer, required quantity of the immediate release layer was placed and compressed with a compression force of 4 ton to obtain hardness in the range of 180-220 N.
Physical evaluation of granules and tablets
Bulk Density
Loose Bulk Density (LBD) and Tapped Bulk Density (TBD) were determined by Digital Automatic Tap Density Test Apparatus (Vegoo, VTAP/ MATCO-II, India). 2 g of powder from each formula (previously lightly shaken to break any agglomerates formed) were taken into a 10 ml measuring cylinder. After the initial volume was observed, the equipment was on and the cylinder was allowed to fall under its own weight onto a hard surface. The reading of tapping was continued until no further change in volume was noted. Using the following equation LBD and TBD was calculated:
LBD = Weight of the powder / volume of the packing.
TBD = Weight of the powder / Tapping volume of the packing.
Compressibility Index
The compressibility index of the granules was determined by Carr’s compressibility index [13]: Carr’s index (%) = {(TBD – LBD) X 100}/TBD
Angle of Repose
Funnel method was used to measure the angle of repose of granules [14]. The accurately weighed granules were taken in a funnel. The height of the funnel was adjusted in such a way that the tip of the funnel just touched the apex of the heap of the granules. The granules were allowed to flow through the funnel freely onto the surface. The diameter of the powder cone was measured and angle of repose was calculated using the following equation:
Angle of Repose θ = tan-1 h/r
Where, h = Height of the powder cone. r = Radius of the powder cone
Uniformity of weight
20 tablets from each of the formulation were weighed individually with an analytical weighing
balance (Model: AY-200, SHIMADZU Corporation, JAPAN). The average weights for each brand as well as the percentage deviation from the mean value were calculated.
Hardness test
Friability test
20 tablets of each formulation were weighed and subjected to abrasion by employing a Veego
friabilator (VFT-2, India) at 25 rev/min for 4 min. The tablets were then weighed and compared with their initial weight and percentage friability was obtained.
Drug content
Ten tablets were powdered in a mortar. An accurately weighed quantity of powdered tablets (100 mg) was extracted with 0.1N HCl (pH 1.2 buffer) and the solution was filtered through 0.45 µ membranes. Each extract was suitably diluted and analyzed by a Shimadzu HPLC system. The drug analysis data were acquired and processed using LC solution (Version 1.2, Shimadzu, Japan) software running under Windows XP on a Pentium PC. Mobile phase consisting mixture of methanol and water (70:30 v/v) at the flow rate of 1mL/min ratio was used. Injection volume was 20 µL and λmax of UV detection was 243 nm. Temperature was kept ambient (25 °C) and the sensitivity was 0.0005. Retention time of acetaminophen was found to be at 2.7 min. Potency was calculated by comparison of peak area of standard preparation and sample preparation.
In vitro drug release study
The dissolution test was undertaken using tablet dissolution tester (TDT-08L, Electrolab, India) in 6 replicates for each formulation. Dissolution media were USP buffer solutions at pH 1.2 (hydrochloric acid solution). The medium was maintained at 37 ± 0.5°C. In all the experiments, 5 ml of dissolution sample was withdrawn at 0, 15 min, 1 hr, 2 hr, 3 hr and 4 hr and replaced with equal volume to maintain sink condition. Samples were filtered and assayed by measuring absorbance at 243 nm. The concentration of each sample was determined from a calibration curve obtained from pure samples of acetaminophen.
Drug release kinetics
To study the release kinetics, data obtained form in vitro drug release study were tested with the Zero order equation, First order equation, Higuchi square root law and Korsmeyer–Peppas equation.
Zero order equation assumes that the cumulative amount of drug release is directly related to time. The equation may be as follows:
C = K0 t--- (1)
Where, K0 is the zero order rate constant expressed in unit concentration/time and t is the time in hour. A graph of concentration vs time would yield a straight line with a slope equal to K0 and intercept the origin of the axes.
The release behavior of first order equation is expressed as log cumulative percentage of drug remaining vs time. The equation may be as follows [15].
Where,
C = The amount of drug un-dissolved at t time, C0 = Drug concentration at t = 0,
k = Corresponding release rate constant.
The Higuchi release model describes the cumulative percentage of drug release vs square root of time. The equation may be as follows [16].
Q = K√t --- (3)
Where, Q = the amount of drug dissolved at time t. K is the constant reflecting the design variables of the system. Hence, drug release rate is proportional to the reciprocal of the square root of time.
Korsmeyer et al developed a simple, semi-empirical model relating exponentially the drug release to the elapsed time [17]. The equation may be as follows:
Q/Q0 = Ktn --- (4)
Where,
Q/Q0 = The fraction of drug released at time t
k = Constant comprising the structural geometric characteristics n = The diffusion exponent that depends on the release mechanism.
If n≤0.5, the release mechanism follows a Fickian diffusion, and if 0.5<n<1, the release follows a non-Fickian diffusion or anomalous transport [18]. The drug release follows zero order drug release and case II transport if n=1. But when n>1, then the release mechanism is super case II transport. This model is used in the polymeric dosage form when the release mechanism is unknown or more than one release phenomena is present in the preparation.
Stability studies
Stability studies were done according to ICH guidelines to assess the drug and formulation stability [19]. All the formulations were subjected to stability study at 40 ± 2ºC and 75 ± 5% RH for 90 days. The samples were evaluated for physical changes, hardness, friability, drug content and percentage drug release during the stability studies.
Data Analysis
The uniformity of weight was analyzed with simple statistics – percentage deviation while the dissolution profiles were analyzed with difference factor (f1), similarity factor (f2) and dissolution efficiency (%DE).
RESULTS AND DISCUSSION
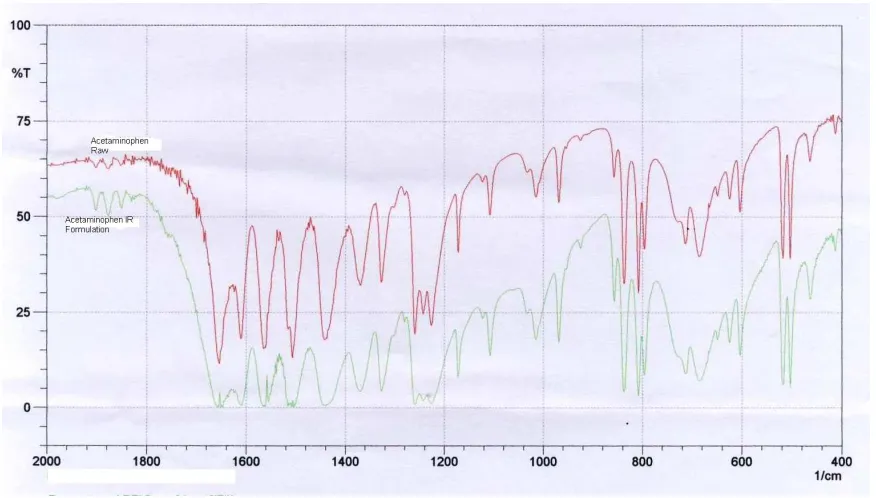
FT-IR study was carried out to know the compatibility.
Figure 1 FTIR spectrum of immediate release layer along with acetaminophen
FTIR spectrum of immediate release formulation and extended release formulation along with acetaminophen were shown in Figure 1 and 2. Peaks of pure drug were unchanged in spectrum of immediate release and extended release formulations which prove that there is no interaction between drug and excipients.
Characterization of granules
[image:8.595.128.467.316.375.2]Granules prepared for compression of bilayer matrix tablets were evaluated for their flow properties like angle of repose, loose bulk density, tapped density and compressibility index. The results of granular properties of formulation IR and ER-1 to ER-6 were shown in table 2. Angle of repose was in the range of 22-26. The bulk density of the granules was in the range of 0.43 ± 0.004 to 0.5 ± 0.009 gm/ml; the tapped density was in the range of 0.506 ± 0.013 to 0.569 ± 0.015gm/ml which indicates that the granules were not bulky. The compressibility index was found to be in the range of 11.49 ± 1.06 to 14.89 ± 1.23.
Table 2 Physical properties of the prepared granules of different formulations
Parameters IR ER-1 ER-2 ER-3 ER-4 ER-5 ER-6 LBD (g/cm3) 0.430 0.479 0.484 0.478 0.478 0.500 0.479 TBD (g/cm3) 0.506 0.548 0.555 0.544 0.549 0.569 0.542 Compressibility Index (%) 14.89 12.63 12.77 12.18 12.83 12.09 11.49 Angle of Repose 26.57 22.45 22.54 22.20 22.45 22.37 22.20
Compressibility index values up to 15% result in good to excellent flow properties. So the granules showed good flow properties. The results of angle of repose (<30°) indicate good flow properties of granules which was supported the results found from compressibility index. All these results indicate that the granules possessed satisfactory flow properties and compressibility.
Physicochemical evaluation of tablets
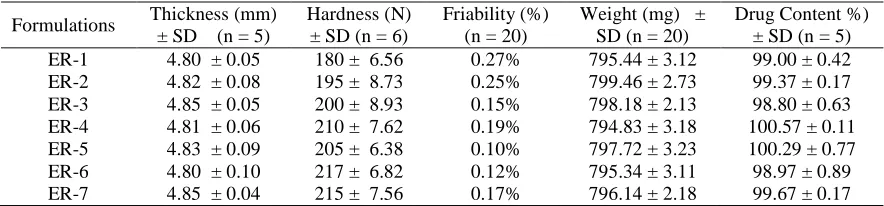
The results of physical parameters (weight, hardness, thickness, friability) and drug content of the prepared matrix tablets are shown in Table 3. The thickness of the tablets were found between 4.80 ± 0.01 mm to 4.85 ± 0.09 mm, hardness of the tablets ranged from 180 ± 0.52 N to 217 ± 0.14 Nand friability ranged from 0.10% to 0.27%.The weight variations of prepared tablets complied with the pharmacopoeial specifications. The drug content of every formulation was found about to 100% of labeled content. So it can be said that physical properties and drug content of the compressed matrix tablets were satisfactory.
Table 3 Physical properties of the prepared tablets of different formulations
Formulations Thickness (mm) ± SD (n = 5)
Hardness (N) ± SD (n = 6)
Friability (%) (n = 20)
Weight (mg) ± SD (n = 20)
[image:8.595.69.511.596.699.2]In vitro drug release study
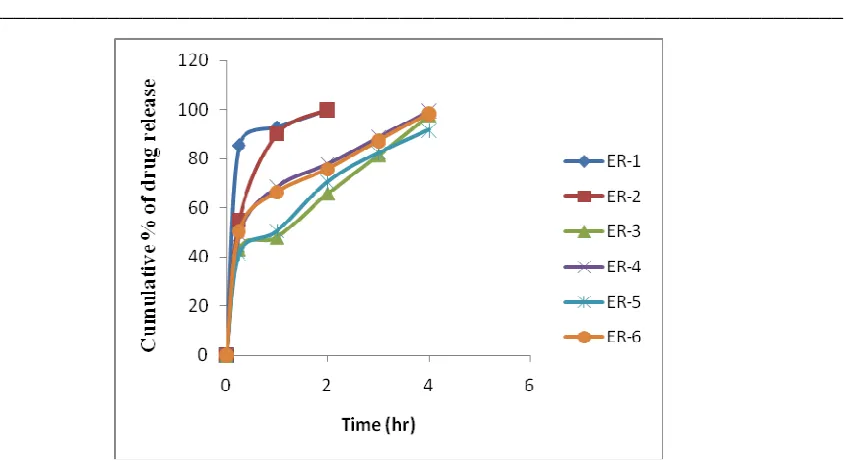
The release profiles of different formulations (ER-1 to ER-6) of acetaminophen bi-layer matrix tablets are shown in Figure 3. All dissolution data are based on the actual drug content of the test tablets as calculated from the assay results.
Figure 3 illustrated the effect of various viscosity grade HPMC and super disintegrating agent on the release profile of acetaminophen from bi-layer matrix tablets. The overall release rate of acetaminophen from formulation containing different grade of HPMC was found to be significantly different (P < 0.0001). This indicates that, modulation of viscosity property in the delivery system would impart a significant impact on the rate and extent of drug release.
Tablets of formulation ER-1 released acetaminophen very rapidly. Virtually, the total content of drug in this formulation was released within 2 hours. USP specification for drug release from acetaminophen extended release tablets is 45-65% in 15 min, 60-80% in 1 hour and not less than 80% in 3 hour. Formulation ER-1 contain lower viscosity grade HPMC (15 cps) and the formulation did not comply USP specification at any time point.
Tablets of formulation ER-2 containing 100 cps HPMC (3% w/w of acetaminophen) released acetaminophen at a slower rate than ER-1 but it did not comply USP drug release specification completely. From this formulation 55.07% acetaminophen was released within 15 min which meets the specification at 15 min time point, but drug released at 1 hour time point (90.05%) crossed the USP limit (60-80%).
Then content of HPMC 100 cps was increased in different formulations and finally it was found that 10% w/w loading of HPMC 100 cps in ER-3 released acetaminophen slightly lower than USP specification. To get USP specified drug release profile of acetaminophen different concentration of sodium starch glycolate (0.5% to 2%) was used as super disintegration agent with 10% w/w loading of HPMC 100 cps and it was found that formulation ER-4 containing 1.5% sodium starch glycolate meets all the USP release criteria. This may be due to the combine action of HPMC 100 cps as release retardant and sodium starch glycolate as disintegrating agent. Use of Sodium starch glycolate with different drugs such as famotidine to decrease the disintegration time has also been reported [20].
Another higher viscosity grade HPMC (Methocel K4M CR) was used in different concentration to find out alternative formulation for acetaminophen extended release tablets. ER-5 containing 1.5% Methocel K4M CR released slightly lower acetaminophen than USP limit. To get USP specified drug release different concentration of sodium starch glycolate (0.25% to 1%) was added as super disintegration agent with 1.50% w/w loading of Methocel k4M CR and it was found that formulation ER-6 containing 0.5% sodium starch glycolate meets all the USP release criteria.
Figure 3 Drug release from different formulations (ER-1 to ER-6)
Drug Release Kinetics
[image:10.595.104.527.87.323.2]The drug release data were fitted to different model equations representing zero order (cumulative amount of drug released vs. time), first order (log percentage of drug unreleased vs. time), Higuchi’s (cumulative percentage of drug released vs. square root of time), and Korsmeyer’s equation (log cumulative percentage of drug released vs. log of time) to know the release mechanisms. The results were shown in table 4 and 5.
Table 4 Kinetic values obtained from different plots of formulations (ER-1 to ER-6)
Formula Zero Order 1st Order Higuchi Model
[image:10.595.98.498.466.559.2]Y equation R2 Y equation R2 Y equation R2 ER-1 y = 35.86x + 40.23 0.478 y = -0.874x + 1.712 0.904 y = 65.27x + 21.82 0.737 ER-2 y = 43.15x + 26.18 0.737 y = -1.412x + 2.088 0.971 y = 71.29x + 9.306 0.937 ER-3 y = 20.00x + 21.85 0.86 y = -0.338x + 2.019 0.863 y = 43.88x + 7.420 0.952 ER-4 y = 19.54x + 30.63 0.747 y = -0.482x + 2.029 0.839 y = 45.33x + 13.80 0.925 ER-5 y = 19.19x + 23.32 0.831 y = -0.242x + 1.930 0.974 y = 43.02x + 8.445 0.961 ER-6 y = 19.12x + 30.47 0.745 y = -0.380x + 1.960 0.889 y = 44.27x + 14.09 0.919
Table 5 Drug release rate parameters
Formulation K n R2 T80% MDT ER-1 1.972 0.068 0.987 0.094 0.159 ER-2 1.928 0.296 0.971 0.824 0.400 ER-3 1.762 0.288 0.86 3.065 1.487 ER-4 1.835 0.245 0.99 1.879 0.919 ER-5 1.764 0.293 0.938 2.983 1.448 ER-6 1.832 0.231 0.976 2.011 0.992
The data from Table 4 shows that most of the formulations were found to follow 1st order and Higuchi release model. As the formulation contain first release layer and sustain release layer they did not follow first order release equation.
To confirm the drug mechanism, the data were fitted into Korsmeyer–Peppas equation (table 5). Formulation ER-1 to Er-6 showed exponent (n) values ranging from 0.068 to 0.299 indicating Fickian diffusion type drug release as when n≤0.5, the release mechanism follows a Fickian diffusion, and if 0.5<n<1, the release follows a non-Fickian diffusion or anomalous transport.
Analysis of Dissolution data
To compare the dissolution profiles of different formulation, a model independent approach of difference factor f1 and similarity factor f2 and % dissolution efficiency (%DE) were employed. Difference factor f1 is the percentage difference between two curves at each point and is a measurement of the relative error between the two curves. The similarity factor (f2) is a logarithmic reciprocal square root transformation of the sum of squared error and is a measurement of the similarity in the percent (%) dissolution between two curves. USP drug release specification for acetaminophen extended release tablet (average 55% in 15 min, 72.5% in 1 hour and 90% in 3 hour) was used as reference value for f1 and f2 calculation. Difference factor f1 and similarity factor f2 were calculated by using the following formulas:
where n is the number of time points, Rt is the dissolution value of reference product at time t and Tt is the dissolution value for the test product at time t.
Similarity factor f2 has been adopted by FDA and the European Agency for the Evaluation of Medicinal Products (EMEA) by the Committee for Proprietary Medicinal Products (CPMP) as a criterion to compare the similarity of two or more dissolution profiles. Similarity factor f2 is included by the Centre for Drug Evaluation and Research (CDER) in their guidelines such as guidance on dissolution testing of immediate release solid oral dosage forms (FDA, 1997) and guidance on Waiver of In Vivo Bioavailability and Bioequivalence Studies for Immediate Release Solid Oral Dosage Forms Based on a Biopharmaceutics Classification System (FDA, 2000)[21-23]. Two dissolution profiles are considered similar and bioequivalent, when f1 is between 0 and 15 and f2 is between 50 and 100 (FDA, 1997).
Where y is the percentage dissolved at time t.
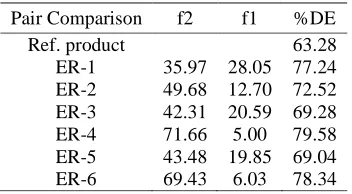
[image:12.595.211.387.284.381.2]Table 6 shows the f1, f2 and % DE of different formulation in respect of USP average limit. Formulation ER-4 and ER-6 having f2 value more than 50 are similar with the USP limit. All other formulations having f2 value less than 50 are not similar with the reference limit. % DE of ER-4 and ER-6 are also higher than other formulations.
Table 6 Comparison of dissolution (f1, f2 and %DE) data with reference product
Pair Comparison f2 f1 %DE
Ref. product 63.28
ER-1 35.97 28.05 77.24 ER-2 49.68 12.70 72.52 ER-3 42.31 20.59 69.28 ER-4 71.66 5.00 79.58 ER-5 43.48 19.85 69.04 ER-6 69.43 6.03 78.34
Stability study
[image:12.595.61.534.468.595.2]Drug release and potency of different formulations (ER-1 to ER-6) after 90 days are summarized in table 7. Potency and drug release were almost similar with the initial values (Table 3 and Fig 1) which indicates that the there is no interaction between drug and polymer.
Table 7 Drug release and potency from different formulations (ER-1 to ER-6) after 90 days
Time (Hour) Cumulative % of drug release (After 3 months)
ER-1 ER-2 ER-3 ER-4 ER-5 ER-6 USP Limit
0 0 0 0 0 0 0
0.25 85.57 55.07 43.16 49.14 41.43 50.53 45-65
1 92.93 90.05 48.12 68.67 50.53 66.52 60-85
2 99.00 99.87 65.86 77.96 70.65 75.85
3 81.43 88.81 82.36 87.34 80-100
4 97.65 99.57 91.68 98.56
After 3 months
Potency 99.60 ±
0.52
99.56 ± 0.46
98.80 ± 0.34
99.67 ± 0.34
99.27 ± 0.53
99.00 ± 0.49
CONCLUSION
Acknowledgement
The authors are thankful to the Management of Aristo Pharma Limited, Dhaka, Bangladesh for providing working standard of acetaminophen to carry out this work.
REFERENCES
[1] TJ Mehta, M R Patel, K R Patel, N M Patel and AD. Patel. J. Chem. Pharm. Res., 2011, 3(2), 747-752.
[2] DB Raju, SMM Kiran Babu and MM Varma. J. Chem. Pharm. Res., 2010, 2(2), 90-96. [3] JG Hardman; LG Limbird; PBMolinoff; RW Ruddeon. Gilman AG. Goodman & Gilman’s the Pharmacological Basis of Therapeutics. Electronic version. McGraw–Hill; New York; 2001. [4] LF Prescott. Am J Ther., 2000, 7(2),143-7.
[5] SC Sweetman. Martindale: The Complete Drug Reference; Electronic version The Pharmaceutical Press; Great Britain; 2002.
[6] United States Pharmacopoeia, CD, 30, NF 25, The USP Convention; Rockville 2007.
[7] British Pharmacopoeia CD version 2; The British Pharmacopoeia Commission; London;
2009.
[8] 8.RT Jadhav1, PH Patil and PR. Patil. J. Chem. Pharm. Res., 2011, 3(3):423-431. [9] PL Ritger and NA and Peppas. J Contr Rel., 1987, 5 (1), 23‐36.
[10]M Labanaand and B Srivatava. J. Chem. Pharm. Res., 2011, 3(3), 348-352.
[11]B Perez-Marcos; JL Ford; DJ Amstrong; PNC Elliott; C Rostron; JE Hogan. Int J Pharm.,
1994, 111(3), 251-259.
[12]K Mitchell; JL Ford; DJ Armstrong; PNC Elliot; C Rostron; JE Hogan.; Int J Pharm.,1993, 100(1-3), 143-154.
[13]ME Aulton and T I well. Pharmaceutics: The Sciences of Dosage form Design, London, England, Churchill Livingstone; 1998
[14]J Cooper and G gunn Powder flow and compaction, In Tutorial pharmacy (carter SJ; Eds) New Delhi India, CBS Publishers and distributers, 1986, p 211-233
[15]JG Wagner. J Pharm Sc., 1969, 58(10), 1253 – 1257. [16]T Higuchi. J. Pharm. Sci., 1961, 50 (10), 877-875.
[17]RW Korsmeyers; R Gumy ; EM Doelker; P Buri and NA Peppas. Int. J. Pham.,1983, 15(1), 25-35.
[18]NA Peppas. Pharm Acta Hel 1985,60 (4),110 -111.
[19]JT Cartensen. Drug Stability: Principle and Practices, Marcel Dakker; New Work; 2nd Ed;
1995, p 538-550.
[20] SC Jagdale, NC. Fernandes, BS Kuchekar, TP.Shah and AR. Chabukswar. J. Chem. Pharm. Res., 2010, 2(2), 65-72.
[21]US Food and Drug Administration, Center for Drug Evaluation and Research, Guidance for industry: Dissolution testing of immediate release solid oral dosage forms.1997. (http://www.fda.Gov/cder/guidance/1713bp1. pdf)
[22]US Food and Drug Administration, Center for Drug Evaluation and Research, Guidance for industry- Waiver of in vivo bioavailability and bioequivalence studies for immediate-release solid oral dosage forms based on a biopharmaceutical classification system, 2000.
(http://www.fda.gov/cder/guidence/3618fnl.pdf).