A Reliability Comparison of Different Methods for
Detecting Step Rate and Foot Strike Pattern in
Runners Using Two-dimensional Video
Miller Erin*, Morris Jamie, Watson Daniel, Goss Donald
Baylor University – Keller Army Community Hospital D1 Sports Physical Therapy Fellowship, West Point, NY, United States
Copyright©2018 by authors, all rights reserved. Authors agree that this article remains permanently open access under the terms of the Creative Commons Attribution License 4.0 International License
Abstract
Two-dimensional (2D) video is often used to evaluate running gait. Cost effective and clinically applicable methods have not been validated. The objective of this study was to evaluate the concurrent validity and agreement of methods used to determine step rate (SR) and foot strike pattern (FSP) during running using 2D video. We observed excellent agreement assessing SR from a 30 Hertz (Hz) video for 10 seconds (s) and multiplying it by 6. We observed excellent interrater agreement assessing FSP for 10s at 240 Hz. These 10s methods for assessing running may be used to inform clinical decision making when evaluating running gait. Key point’s Two-dimensional video assessment at 30 Hz demonstrated high intra- and interrater reliability for detecting step rate; the 10-second method is valid and reliable for detecting step rate when compared to the 60-second method; Detecting foot strike using a 2-point scale is more reliable at 240Hz rather than 30Hz.Keywords
Gait, Analysis, Biomechanics1. Introduction
Running is a popular and cost-effective method to maintain aerobic fitness. However, annual running injury incidence has been reported between 19-79% with approximately 40% of all running-related injuries occurring at the knee.1,2 Although causative factors of running injuries are multifactorial, most agree that running biomechanics play a key role in injury development.3 Several popular biomechanical interventions have been proposed to reduce loads to the lower extremity, and in turn running-related injury risk, to include alterations in step rate (SR) and foot strike pattern (FSP).4-9
Alterations in SR have consistently demonstrated the ability to reduce lower extremity loads associated with
injury development to include; average vertical loading rate (AVLR),10 shock attenuation,11 and energy absorbed at the hip, knee, and ankle joints during running.6 Individuals recovering from anterior exertional compartment syndrome,12,13 tibial stress fracture,14 anterior shin pain,15 and patellofemoral pain16,17 have reported reductions in running pain after gait retraining to increase their SR. By increasing one’s preferred SR by 10% or greater (assuming a constant speed), reduced impact load on the body can be achieved.6,10
A runner’s FSP and the resulting loading properties may also be a principal factor in lower extremity injury. Individuals who run with a rearfoot strike (RFS) pattern versus a non-rearfoot strike (NRFS) pattern have demonstrated substantially greater AVLR during running.18-20 Additionally, RFS runners typically run with less knee flexion at initial contact exposing themselves to increased knee extensor moments which may increase their risk of knee injuries.6,7 Overall, gait retraining to alter SR and/or FSP may prove to be a beneficial tool for clinicians seeking to reduce the risk of their patients developing a running-related injury or facilitating recovery from an existing injury.6,20
analysis. Hand-held smart devices with high-speed capability are a slightly more expensive option (between $280-$700). Visual inspection is widely used as it is the most convenient option. While opportune, the visual inspection of FSP and SR is not validated for detecting FSP and SR and may not be accurate.27
Though 2D methods are cost-effective and clinically applicable, clinicians above all, require outcomes that may be measured accurately. Knowledge of the reliability of visual identification of running related variables from 2D video recordings is limited. To our knowledge, no studies exist to date examining the reliability of video-based identification of SR. Additionally, only two studies have examined the reliability of video-based identification of FSP,24,25 and only one of those studies evaluated reliability during treadmill running. The purposes of this study were; (1) To determine the inter and intra-rater agreement (and concurrent validity) of counting SR using 10 seconds (s) of video running data multiplied by 6 (10s method) compared to 60s of video data sampling at 30 Hz (60s method; the gold-standard); and (2) To determine the inter and intra-rater agreement of characterizing FSP using three different video data collection methods: 30 Hz for 10s, 30 Hz for 60s and 240 Hz for 10s video running data.
2. Methods
Participants
Forty participants were recruited from the West Point, NY community and consisted of Department of Defense (DOD) beneficiaries (cadets, active duty Soldiers, and active duty immediate family members) between 18 and 50 years of age who self-reported weekly running mileage (mpw) of at least 12 miles. Potential participants were excluded from the main study if they reported (1) a current pregnancy or had been pregnant or given birth in the previous 6 months, (2) lower extremity or low back pain in the previous 3 months, (3) lower extremity or low back surgery in the previous 6 months, (4) previous stress fracture of the foot, and (5) insufficient English-language skills to complete all questionnaires and training. Thirty-two men (mean age 25.8 +/- 9.2 years, mean height 177.1 +/- 4.6 cm, mean weight 76.5 +/- 7.7 kg) and 8 women (mean age 34.38 +/- 9.3 years, mean height 164.5 +/- 6.9 cm, mean weight 62.1 +/- 10.3 kg) with a combined mean running mpw of 15.49 +/- 6.5 miles, were included in the study.
Instrumentation
All participants were asked to run on a Life Fitness 97TI treadmill (Rosemont, USA) at their self-selected 2-mile run pace for 5 minutes. During the final minute of running FSP and SR were recorded by 2 high-speed video cameras
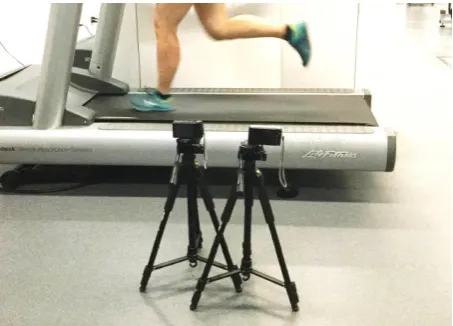
(Casio Exilim HS EX-ZR200, Tokyo, Japan) mounted to 2 separate Vivitar (Santa Monica, USA) tripods. Both high-speed video cameras were fixed to a height of 57 cm, measured by a measuring tape, from the floor to the middle of the camera lens. Camera 1 was fixed at a distance of 58 cm from the treadmill and Camera 2 was fixed at 62 cm from the treadmill, measured by a measuring tape, from the camera lens to the nearest edge of the treadmill (Figure 1). Camera 1 sampled at 30 Hz with a resolution of 1920 x 1080 pixels and shutter speed of 1/250s. Camera 2 sampled at 240 Hz with a resolution of 512 x 384 pixels and shutter speed of 1/1000s. Both camera 1 and camera 2 were placed perpendicular to the treadmill, as measured by a protractor, capturing sagittal plane video from the hip down to preserve the identity of the runners.
Figure 1. Data Collection Laboratory Set-Up.
Tasks
Participants were instructed to take as little or as much time to warm-up as needed. The warm-up consisted of a treadmill run at the participant’s self-selected speed (mean speed 2.8 +/- 0.5 meters per second) and self-selected duration (mean warm-up duration 6 +/- 1.5 minutes). Once the participants indicated to the study personnel that they were comfortably warmed up and running at their self-selected 2-mile run pace (mean speed 3.1 +/- 0.4 meters per second) the 5-minute timer was started. At the 4-minute mark camera 1 and camera 2 were started simultaneously and recorded for duration of 60s at which time both camera 1 and camera 2 were stopped simultaneously.
Procedures
The study protocol, all informed consent documents and case report forms were approved by the Institutional Review Board at Keller Army Community Hospital, West Point, NY, and all participants provided written consent prior to study enrollment. Windows Movie Maker 7.0 (available for free download at
[image:2.595.308.535.266.429.2]edit and evaluate each video. Two video clips were derived from the camera 1, 30 Hz recording; one clip was kept at its original length of 60s and one was cut down into a 10s clip. The camera 2, 240 Hz recording, was cut down into a 10s clip. All videos were edited by deleting footage starting from the beginning of the video recordings thereby using the last 10s of video data. After all videos clips were edited to their respective lengths, they were copied and put onto two separate hard drives and distributed to the raters.
Two medical professionals evaluated the video clips, an athletic trainer (Rater 1) and a physical therapist (Rater 2). Rater 1 and Rater 2 were experienced in the use of high-speed video for the evaluation of running mechanics; including but not limited to SR and FSP. Rater 1 and Rater 2 assessed SR in the 30 Hz 10s video clip and once in the 30 Hz 60s video clip. FSP was evaluated once in all clips; the 30 Hz 10s, 30 Hz 60s and 240 Hz 10s video clips. Video clips were reviewed by each rater independent of each other and blinded to each other’s assessments. Each rater kept a private Microsoft Excel spreadsheet until all video analysis and data reduction were complete. These spreadsheets were then combined by the third investigator for data analysis.
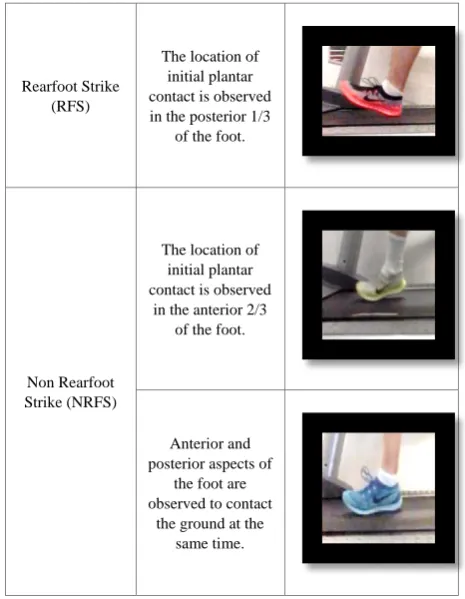
There is no consensus in the literature on how to measure SR effectively in a clinical setting. SR was evaluated in the 30 Hz 60s clip by counting all steps taken by both the left and right feet (60s method). SR was evaluated in the 30 Hz 10s clip by counting all steps taken by both the left and right feet and multiplying this number by 6 (10s method). Methods to characterize FSP in the literature vary, and there is no consensus on how to define and measure them. The 2-point scale used for the characterization of FSP, defined by Warr et al.26, was used to categorize foot strikes dichotomously into one of two groups; rearfoot strike or non-rear foot strike (Table 1). Location of initial plantar contact observed in the posterior 1/3 of the foot was considered a RFS. Location of initial plantar contact observed in the anterior 2/3 of the foot was characterized as a NRFS. If both anterior and posterior aspects of the foot made initial contact with the ground simultaneously, the foot strike was considered a NRFS.22,23,26 FSP was determined by whichever FSP characterization (RFS or NRFS) made up the majority of foot strikes of the left foot (subject’s foot closest to the camera) in a clip.
Statistical Analysis
To assess intra-rater agreement, we calculated Intraclass Correlation Coefficients (ICC (3, 1)) for SR comparisons and Cohen’s Kappa values for FSP. ICC (3, 1) estimates and their 95% confident intervals were calculated based on a single measurement, absolute-agreement, 2-way mixed-effects model. Measure of agreement between raters for SR was calculated on a continuous scale using ICC (2, 1) based on a single rater, absolute-agreement, 2-way
mixed-effects model. All statistical analyses were performed using SPSS v.19 (SPSS Inc, Chicago, IL) with a significance level of 0.05 (95% confidence intervals).
Table 1. Foot Strike Pattern Characterization.
Rearfoot Strike (RFS)
The location of initial plantar contact is observed in the posterior 1/3
of the foot.
Non Rearfoot Strike (NRFS)
The location of initial plantar contact is observed
in the anterior 2/3 of the foot.
Anterior and posterior aspects of
the foot are observed to contact
the ground at the same time.
3. Results
Step Rate
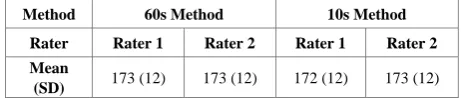
[image:3.595.305.538.134.434.2]Excellent intra-rater agreement [ICC (3, 1) 0.94-0.99] and inter-rater agreement [ICC (2, 1) 0.97-0.99] were demonstrated comparing both SR calculation methods evaluated in this study (Table 2).28 The means and standard deviations for Rater 1 and Rater 2 for the 60s SR calculation method were 173 +/- 12 steps per minute and 173 +/- 12 steps per minute respectively (Table 3). The means and standard deviations for Rater 1 and Rater 2 for the 10s SR calculation method were 172 +/- 12 steps per minute and 173 +/- 12 steps per minute respectively.
Table 2. Intra-rater and Inter-rater agreements (ICC 2,1) comparing the step rate of a 30 Hz 60 second (s) video (60s Method) to the step rate of a 30 Hz 10s video multiplied by 6 (10s Method).
Intra-rater Agreement Inter-rater Agreement
Method 10s Method versus 60s Method
10s Method
60s Method Rater Rater 1 Rater 2 1 versus 2 1 versus 2
ICC (2,1) [95% CI]
0.97 (0.94-0.99)
0.98 (0.96-0.99)
0.98 (0.97-0.99)
0.99 (0.99-0.99)
[image:3.595.307.538.654.744.2]Table 3. An inter-rater (Rater 1 vs. Rater 2) and inter-method (60s Method vs. 10s Method) comparison of the mean step rate of all 40 runners.
Method 60s Method 10s Method Rater Rater 1 Rater 2 Rater 1 Rater 2 Mean
(SD) 173 (12) 173 (12) 172 (12) 173 (12)
Hz, frames per second; s, second; SD, standard deviation
Foot Strike Pattern
[image:4.595.58.289.109.158.2]Perfect inter-rater agreement was demonstrated characterizing FSP using 240 Hz frame rate video; kappa 1.00 (Table 4).28 Moderate inter-rater agreement was demonstrated characterizing FSP using 30 Hz frame rate video for 10s (kappa .58) and 60s (kappa .63).
Table 4. Inter-rater reliability comparing the foot strike pattern (FSP) characterizations of 40 runners between two raters of a 10 second (s) video at 30 frames per second (Hz), 60s video at 30 Hz and 10s video at 240 Hz.
Method 30 Hz 10s 30 Hz 60s 240 Hz 10s
Cohen’s Kappa .58 .63 1
% Agreement 80% 83% 100%
4. Discussion
Excellent inter and intra-rater agreement outcomes were expected in evaluating the 60s method as this is the definition of SR measurement; counting all steps taken in one minute. The 10s method was chosen to be compared to the 60s method because of its high relevance to clinical practice, ease of application, and timeliness of the method. Our results demonstrated excellent agreement between the two methods indicating the 10s method can be used as an appropriate SR estimate.
Better agreement was demonstrated between raters in the characterization of foot strike pattern when 240 Hz frame rate videos were used (Table 4). The kappa values for the identification of FSP using a 2-point characterization scale showed greater inter-rater agreement (kappa 1.00; perfect agreement) using 240 Hz frame rate video data than using 10s or 60s of 30 Hz frame rate video data (0.58 and 0.63; fair agreement). Our results suggest that 240 Hz high speed video is more reliable in the identification of FSP compared to 30 Hz. The fair agreement demonstrated at the 30Hz frame rate versus the perfect agreement demonstrated at 240 Hz suggests there may be greater benefit and superior accuracy using 2D high-speed video versus lower frame rates for detecting FSP.
Inter-rater agreement using 240 Hz video data in the present study revealed similar reliability compared to Bertelsen et al. who demonstrated inter-rater agreement of FSP characterization ranging between kappa values 0.76 and 0.92; substantial to almost perfect agreement.24 Bertelsen et al. used a similar high-speed video data
collection frequency (300 Hz) to the present study, however utilized a 4-point scale as opposed to a 2-point scale. Based on the notion that a greater number of categories will, most likely, result in poorer reliability,28 we suggest our 2-point grading scale was a factor influencing our slightly higher kappa values.
Limitations
This study has several limitations. The quality of our video recordings was influenced by poor lighting. This limitation was compounded by the high shutter speeds (1/1000s) needed to collect adequate high-speed video (240 Hz). While we utilized a 40W lighting fixture to illuminate the treadmill in addition to the already adequately lit lab, a stronger fixture would likely result in an increase in rater reliability. While this was an acknowledged limitation, our findings demonstrated that high-speed video was associated with higher reliability values. A second limitation is the kinematic and spatiotemporal differences that have been observed to exist between treadmill and over-ground running. In the literature, SR has been observed to be significantly higher and stride length significantly shorter when running on a treadmill.29-31 As such, it must be considered that the present results only cover the reliability of identifying SR and FSP during treadmill running.
Clinical Implications
For clinicians looking to reliably evaluate multiple running characteristics to include SR and FSP, the authors recommend investing in any video camera with the capability to capture at both 30 Hz and 240 Hz frame rate, like the one described in this project. Additionally, with technology continuing to advance and the recent emergence of high speed cameras in smart phones and smart devices, the accessibility of video capture at multiple frame rates using one device is rapidly increasing.
Future Research
accurate.27 The 10s method described in this study could be used as a reference for exploring the accuracy of clinicians using real-time visual inspection as an outcome tool for detecting FSP and SR. Lastly, with recent advancements in mobile video and tele-medicine technology there has been a push in the military for long-distance health education and intervention. With reliable methods to identify SR and FSP using 2D video, medical professionals can be provided the opportunity to evaluate the running gait of deployed and off-site soldiers to inform clinical decision making.
5. Conclusions
As running injuries have failed to decline,34 there is an ever-increasing need to effectively examine individual running technique with the goal of better informing risk factors potentially related to injury prediction, prevention, and rehabilitation. This study demonstrates that there is greater clinical benefit from using 2D 240 Hz high speed video for the detection of FSP versus 30 Hz standard capture rate. Additionally, with advances in the reliable identification of running related factors, medical professionals can be provided with valuable information to inform clinical decision making when evaluating running gait.
Conflicts of Interest
None.
Funding
This research did not receive any specific grant from funding agencies in the public, commercial, or not-for-profit sectors.
REFERENCES
[1] Van Gent RN, Siem D, van Middelkoop M, van Os AG, Bierma-Zeinstra SMA, Koes BW. Incidence and determinants of lower extremity running injuries in long distance runners: a systematic review. British Journal of Sports Medicine. 2007; 41(8):469-480; discussion 480. [2] Taunton J.E. RMR, Clement D.B., McKenzie D.C.,
Lloyd-Smith D.R., Zumbo B.D. A retrospective case-control analysis of 2002 running injuries. Br J Sports Med. 2002; 36:95-101.
[3] Souza RB. An evidence-based videotaped running biomechanics analysis. Physical medicine and
rehabilitation clinics of North America. 2016;
27(1):217-236.
[4] McDougall. Born to Run. Alfred A. Knopt; 2009.
[5] Dreyer D. Chi Running. New York, NY: Fireside; 2009. [6] Heiderscheit BC, Chumanov ES, Michalski MP, Wille CM,
Ryan MB. Effects of Step Rate Manipulation on Joint Mechanics during Running. Medicine & Science in Sports & Exercise. 2011; 43(2):296-302.
[7] Daoud AI, Geissler GJ, Wang F, Saretsky J, Daoud YA, Lieberman DE. Foot Strike and Injury Rates in Endurance Runners: A Retrospective Study. Medicine & Science in Sports & Exercise. 2012; 44(7):1325-1334.
[8] Lieberman DE, Venkadesan M, Werbel WA, et al. Foot strike patterns and collision forces in habitually barefoot versus shod runners. Nature. 2010; 463(7280):531-535. [9] Goss DL, Gross MT. A review of mechanics and injury
trends among various running styles. DTIC Document; 2012 2012.
[10] Schubert AG, Kempf J, Heiderscheit BC. Influence of stride frequency and length on running mechanics: a systematic review. Sports health. 2014; 6(3):210-217.
[11] Derrick TR, Hamill J, Caldwell GE. Energy absorption of impacts during running at various stride lengths. Medicine and science in sports and exercise. 1998; 30(1):128-135. [12] Diebal AR, Gregory R, Alitz C, Gerber JP. Forefoot
Running Improves Pain and Disability Associated With Chronic Exertional Compartment Syndrome. The American Journal of Sports Medicine. 2012; 40(5):1060-1067. [13] Breen DT, Foster J, Falvey E, Franklyn‐Miller A. GAIT
RE‐TRAINING TO ALLEVIATE THE SYMPTOMS OF ANTERIOR EXERTIONAL LOWER LEG PAIN: A CASE SERIES. International journal of sports physical therapy. 2015; 10(1):85.
[14] Willy RW, Buchenic L, Rogacki K, Ackerman J, Schmidt A, Willson JD. In-field gait retraining and mobile monitoring to address running biomechanics associated with tibial stress fracture. Scandinavian journal of medicine & science in sports. 2016; 26(2):197-205.
[15] Luedke LE, Heiderscheit BC, Williams DS, Rauh MJ. Influence of Step Rate on Shin Injury and Anterior Knee Pain in High School Runners. Med Sci Sports Exerc. 2016; 48(7):1244-1250.
[16] Roper JL, Harding EM, Doerfler D, et al. The effects of gait retraining in runners with patellofemoral pain: A randomized trial. Clinical Biomechanics. 2016;35:14-22. [17] Goss DL, Lewek M, Yu B, Ware WB, Teyhen DS, Gross
MT. Lower Extremity Biomechanics and Self-Reported Foot-Strike Patterns among Runners in Traditional and Minimalist Shoes. Journal of Athletic Training. 2015; 50(6):603-611.
[18] Davis IS, Bowser BJ, Hamill J. Vertical impact loading in runners with a history of patellofemoral pain syndrome: 2597: Board# 205 June 4 9: 00 AM-10: 30 AM. Medicine & Science in Sports & Exercise. 2010; 42(5):682.
[19] Florkiewicz EM, Crowell M, Morris JB, Dolbeer J, Zifchock R, Goss D. A Case Series of Previously Injured Runners Transitioning to a Non-rearfoot-strike Running Pattern. Journal of Orthopaedic & Sports Physical. 2017; 47(1):A38-A39.
and vertical ground reaction force loading rates in Chi runners and rearfoot-striking runners. Journal of
Orthopaedic & sports physical therapy. 2013;
43(10):685-692.
[21] Ogueta-Alday A, Rodriguez-Marroyo JA, Garcia-Lopez J. Rearfoot striking runners are more economical than midfoot strikers. Med Sci Sports Exerc. 2014; 46(3):580-585. [22] Cavanagh PR LM. Ground reaction forces in distance
running. J Biomech. 1980; 13(5):397–406.
[23] Bertelsen ML, Jensen JF, Nielsen MH, Nielsen RO, Rasmussen S. Footstrike patterns among novice runners wearing a conventional, neutral running shoe. Gait Posture.
2013; 38(2):354-356.
[24] Damsted C, Larsen LH, Nielsen RO. Reliability of video-based identification of footstrike pattern and video time frame at initial contact in recreational runners. Gait Posture. 2015; 42(1):32-35.
[25] Warr BJ, Fellin RE, Sauer SG, Goss DL, Frykman PN, Seay JF. Characterization of Foot-Strike Patterns: Lack of an Association with Injuries or Performance in Soldiers.
Military medicine. 2015; 180(7): 830-834.
[26] Goss DL, Gross MT. Relationships among self-reported shoe type, footstrike pattern, and injury incidence. US Army Med Dep J. 2012:25-30.
[27] Portney LG, Watkins MP. Foundations of clinical research: applications to practice. FA Davis; 2015.
[28] Riley PO, Dicharry J, Franz J, Della Croce U, Wilder RP, Kerrigan DC. A kinematics and kinetic comparison of overground and treadmill running. Medicine & Science in Sports & Exercise. 2008; 40(6):1093-1100.
[29] Elliott B, Blanksby B. A cinematographic analysis of overground and treadmill running by males and females.
Med Sci Sports. 1976; 8(2):84-87.
[30] Schache AG, Blanch PD, Rath DA, Wrigley TV, Starr R, Bennell KL. A comparison of overground and treadmill running for measuring the three-dimensional kinematics of the lumbo–pelvic–hip complex. Clinical Biomechanics.
2001;16(8):667-680.
[31] Lenhart RL, Smith CR, Vignos MF, Kaiser J, Heiderscheit BC, Thelen DG. Influence of step rate and quadriceps load distribution on patellofemoral cartilage contact pressures during running. J Biomech. 2015; 48(11):2871-2878.
[32] Lenhart RL, Thelen DG, Wille CM, Chumanov ES, Heiderscheit BC. Increasing running step rate reduces patellofemoral joint forces. Medicine and science in sports and exercise. 2014; 46(3):557.
[33] Hauret KG, Bedno S, Loringer K, Kao TC, Mallon T, Jones BH. Epidemiology of Exercise- and Sports-Related Injuries in a Population of Young, Physically Active Adults: A Survey of Military Servicemembers. Am J Sports Med.