RESEARCH
First-line HIV treatment failures in non-B
subtypes and recombinants: a cross-sectional
analysis of multiple populations in Uganda
Art F. Y. Poon
1,2,3*, Emmanuel Ndashimye
2,4, Mariano Avino
1, Richard Gibson
2, Cissy Kityo
4, Fred Kyeyune
5,6,
Immaculate Nankya
5,7, Miguel E. Quiñones‑Mateu
5,7,8, Eric J. ARTS
2,5and The Ugandan Drug
Resistance Study Team
Abstract
Background: Our understanding of HIV‑1 and antiretroviral treatment (ART) is strongly biased towards subtype B, the predominant subtype in North America and western Europe. Efforts to characterize the response to first‑line treatments in other HIV‑1 subtypes have been hindered by the availability of large study cohorts in resource‑limited settings. To maximize our statistical power, we combined HIV‑1 sequence and clinical data from every available study population associated with the Joint Clinical Research Centre (JCRC) in Uganda. These records were combined with contemporaneous ART‑naive records from Uganda in the Stanford HIVdb database.
Methods: Treatment failures were defined by the presence of HIV genotype records with sample collection dates after the ART start dates in the JCRC database. Drug resistances were predicted by the Stanford HIVdb algorithm, and HIV subtype classification and recombination detection was performed with SCUEAL. We used Bayesian network analysis to evaluate associations between drug exposures and subtypes, and binomial regression for associations with recombination.
Results: This is the largest database of first‑line treatment failures ( n=1724 ) in Uganda to date, with a predicted sta‑
tistical power of 80% to detect subtype associations at an odds ratio of ≥1.2 . In the subset where drug regimen data
were available, we observed that use of 3TC was associated with a higher rate of first line treatment failure, whereas regimens containing AZT and TDF were associated with reduced rates of failure. In the complete database, we found limited evidence of associations between HIV‑1 subtypes and treatment failure, with the exception of a significantly lower frequency of failures among A/D recombinants that comprised about 7% of the population. First‑line treatment failure was significantly associated with reduced numbers of recombination breakpoints across subtypes.
Conclusions: Expanding access to first‑line ART should confer the anticipated public health benefits in Uganda, despite known differences in the pathogenesis of HIV‑1 subtypes. Furthermore, the impact of ART may actually be enhanced by frequent inter‑subtype recombination in this region.
Keywords: HIV‑1 subtypes, Sub‑Saharan Africa, Drug resistance, Treatment failure, Recombination
© The Author(s) 2019. This article is distributed under the terms of the Creative Commons Attribution 4.0 International License (http://creat iveco mmons .org/licen ses/by/4.0/), which permits unrestricted use, distribution, and reproduction in any medium, provided you give appropriate credit to the original author(s) and the source, provide a link to the Creative Commons license, and indicate if changes were made. The Creative Commons Public Domain Dedication waiver (http://creat iveco mmons .org/ publi cdoma in/zero/1.0/) applies to the data made available in this article, unless otherwise stated.
Open Access
*Correspondence: [email protected]
1 Department of Pathology and Laboratory Medicine, Health Sciences
Background
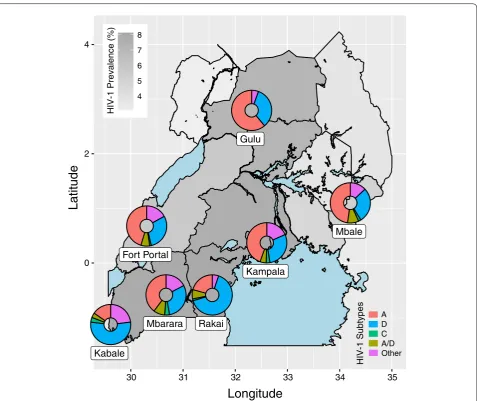
East Africa was one of the first regions in the world to experience high rates of HIV infection [1]. In 1990, for instance, some antenatal clinics in Uganda recorded adult HIV prevalences among women exceeding 30% [2]. Currently, the adult prevalence of HIV in Uganda is about 7.1% [3]. Increasing the coverage of combination antiretroviral therapy in Uganda is a crucial public health objective to not only reduce HIV-related morbidity and mortality, but also to prevent the onward transmission of HIV by reducing plasma viral loads [4, 5]. However, the enormous genetic diversity of the HIV-1 subtypes has been a persistent concern for antiretroviral treatment, especially in low- and middle-income countries like Uganda with multiple prevalent subtypes [6]. Antiret-roviral drugs have generally been developed and tested on HIV subtype B [7], which is the predominant sub-type in North America and western Europe [8]. HIV-1 infections in Uganda are predominated by subtypes A and D [9], with a low frequency of subtype C that is the predominant subtype in southern Africa. In addition, recombinants of subtypes A and D have historically been observed in about 10% to 30% of HIV infections sampled in Uganda [10, 11]. Based on a phylogenetic analysis of dated HIV sequences, subtype A likely migrated into Uganda around the 1950s before subtype D entered about a decade afterwards [12]. To date, subtype A HIV-1 infec-tions are more prevalent in the east and north regions of Uganda, while subtype D dominates in the west and south of this small country [13].
There is accumulating evidence of clinically-signifi-cant differences among the HIV-1 subtypes. For exam-ple, multiple studies have observed that subtype D is associated with a faster rate of disease progression rela-tive to subtype A in the absence of treatment [14–16]. Our previous 15-year natural history study of HIV dis-ease progression confirmed these observations, but also described a significantly slower rate of disease progres-sion in subtype C HIV-1 infected individuals over those infected with subtype A or D [16, 17]. Previous studies of serodiscordant couples have also reported that subtype D has a lower transmission rate than subtype A [18], which is consistent with a decline in the overall prevalence of subtype D in the region [19]. In addition, HIV subtype variation can have an impact on the emergence of drug resistance mutations. For example, the HIV-1 RT muta-tion K65R emerges more rapidly in subtype C infecmuta-tions due to variation among subtypes in a homopolymeric region that interrupts reverse transcription and induces a higher rate of base misincorporation [20].
Evaluating the clinical significance of HIV non-B sub-types in the context of antiretroviral treatment (ART) remains a significant challenge and few studies have
the necessary sample sizes in resource-limited settings, let alone in any specific region. In a recent systematic review of switching to second-line treatments in sub-Saharan Africa [21], the estimated incidence averaged about 2.6 first-line treatment failures per 100 person-years and ranged between 2 to 5 per 100 person-person-years. Consequently, prospectively enrolling patients on first-line treatment can severely limit the expected number of treatment failures in the sample population. In this study, we have combined HIV sequence and clinical data associ-ated with first-line treatment failures from multiple study cohorts and clinical sites based in Uganda ( n=1724 ). These data were supplemented with drug-naive (base-line) HIV sequence data from the same clinical sites ( n=968 ) and location-time matched records from the Stanford HIV drug resistance database ( n=1462 ) [22] for a combined total of 4154 patient records. To date, this represents the largest retrospective multi-site analysis of HIV first-line treatment failures in Uganda, and likely in all of sub-Saharan Africa. The primary objective of our study was to assess the clinical significance of HIV-1 sub-types in the context of first-line treatment failure. Results from our investigation then motivated a deeper analysis on the impact of frequent inter-subtype recombination in this region where both subtypes A and D are prevalent. Here we report evidence that first-line treatment failure in Uganda is generally more strongly associated with drug regimens than HIV-1 subtypes. By expanding our database, however, we observe that A/D recombinants are significantly less associated with first-line treatment failure, and that this effect is more pronounced with an increasing number of putative recombination break-points in HIV-1 pol.
Methods
Data collection
committees at the collaborating sites and the Academic Medical Center (AMC) of the University of Amsterdam, and all participants provided written informed consent. Samples from the Joint Clinical Research Centre (JCRC), the main HIV care provider in Uganda, included patient samples from the JCRC clinics (2005–2016, DR) and the Monitoring Antiretroviral Resistance in Children (2010–
2011, MARCH) observational cohort study [26] with
informed consent provided by parent(s)/guardian(s); the sample collection protocol was approved by the ethical committees at the JCRC and the AMC. Our analysis of these anonymized data was collectively approved by the institutional review board of the JCRC (EM10-07).
Samples collected in countries other than Uganda (e.g., Zimbabwe, Malawi) were excluded from further analyses. First-line treatment failures were defined by the presence of an HIV drug resistance genotype record in the data-base subsequent to start of treatment, which implied a detectable viral load ( >50 copies/mL plasma). Drug
exposures were recorded as the drug regimen at the start of treatment for baseline samples, and the regimen at the time of virological failure otherwise. The median collec-tion year of samples was 2010, with the earliest sample collected in 2005 and the most recent in 2016; this study was initiated in August 2016.
Data processing
We used a rules-based record linkage algorithm to asso-ciate these sequence-derived data to clinical variables in a separate database, with a customized rule set for the sequence/patient label nomenclature of each study population. This record linkage was determined to be a necessary processing step when initial analyses found dis-cordant patient identifiers between databases that were likely the result of errors during manual data entry. The clinical data included cohort study, region, gender, age at enrollment, plasma viral load and CD4 cell count at base-line, and first-line ART regimen. To augment the number of baseline samples in the data, we merged the sequence database with the genotype-treatment correlation dataset published by the Stanford HIVdb database [22], which we reduced to only drug-naive records collected in Uganda ( n=1462 ). Note that our linkage algorithm was applied only to anonymized data collected from clinical sites and cohort studies associated with the JCRC; no linkage was applied to any data from the Stanford database. Since the Stanford HIVdb records spanned a broader range of sample collection dates, we excluded all HIVdb records that were sampled prior to 2005 to ensure that the HIVdb sequences were contemporaneous with samples from our multi-cohort study. We verified that none of the HIVdb sequences duplicated records in the JCRC database. Resistance predictions for HIV sequences were generated
with the Stanford HIVdb algorithm [22]. Subtype pre-dictions from nucleotide sequences were obtained using SCUEAL [27] and verified with REGA (version 3.0) [28] and by phylogenetic reconstruction. Complete details on the sequence analysis methods are provided as Addi-tional file 1: Text S1.
Statistical analysis
All statistical analyses, including generalized linear mod-els (GLMs), were performed in the R computing envi-ronment unless noted otherwise. Associations between categorical variables were evaluated using Fisher’s exact tests. We used a log-transformation of plasma viral loads and a cubic root transformation of CD4 cell counts to accommodate the normality assumption of parametric tests. To fit GLMs to the genotypic susceptibility score (GSS) data [29], which are calculated to a resolution of 0.25 units, we rounded these outcomes to the nearest integer and used a binomial logit-link function. Statisti-cal tests were generally reported by 95% confidence inter-vals; in cases where we reported P-values, significance was interpreted at a threshold of α=0.05 unless other-wise noted. Cases with missing data were dropped from the respective analyses. A Bayesian network analysis was performed using a custom implementation in HyPhy [30] (see Additional file 1: Text S2).
Results
Subtype distribution
between the SCUEAL and REGA algorithms in assign-ing subtype A, C and D and A/D recombinants was 96.4% (Cohen’s κ =0.94 ; Additional file 1: Table S2).
Treatment failure and drug resistance
We observed significant regional differences in drug exposure: for example, 3TC was more frequently pre-scribed in Kampala than other regions (Fisher’s exact test, odds ratio OR=2.45 , 95% CI = [1.95, 3.07]) and EFV was prescribed less frequently ( OR=0.61 [0.50,
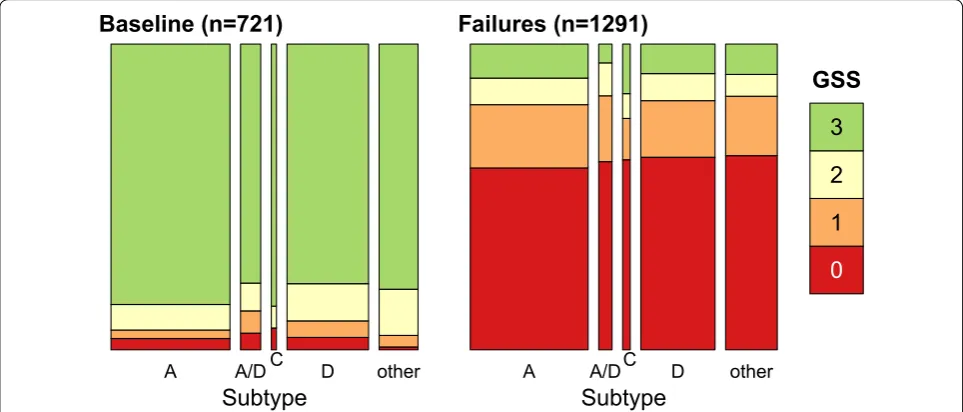
0.75]). To evaluate whether drug resistance patterns were consistent with treatment failures, we calculated the genotypic susceptibility score (GSS) for each indi-vidual with a known drug regimen ( n= 2012). The GSS can be interpreted as the number of effective drugs in an individual’s regimen, given the genetic makeup of their virus population [29], where drug effectiveness is based on the Stanford HIVdb resistance score. The mean GSS among failure samples (0.77) was significantly lower than the mean among baseline samples (2.71; binomial GLM
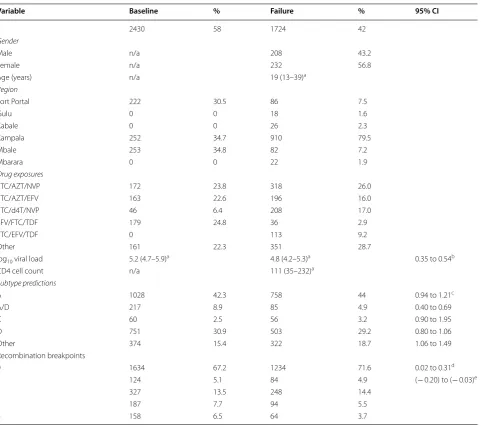
Table 1 Summary table for HIV-1 baseline and treatment failure samples
Table counts do not include cases with missing data on region, drug exposure, viral load or CD4 cell counts
n/a indicates that no data were available for the variable and group, 3TC lamivudine, AZT zidovudine, NVP nevirapine, EFV efavirenz, d4T stavudine, FTC emtricitabine, TDF tenofovir
a Numbers correspond to the median and interquartile range (in parentheses). 95% confidence intervals are reported for the following test statistics: b the difference
between the means of two groups from Student’s t-test. c the odds ratio for Fisher’s exact test; d the difference in treatment failures in log odds of structural zeroes in a
zero-inflated Poisson (ZIP) model, and; e the decrease in the log-transformed number of breakpoints among treatment failures under the ZIP model
Variable Baseline % Failure % 95% CI
2430 58 1724 42
Gender
Male n/a 208 43.2
Female n/a 232 56.8
Age (years) n/a 19 (13–39)a
Region
Fort Portal 222 30.5 86 7.5
Gulu 0 0 18 1.6
Kabale 0 0 26 2.3
Kampala 252 34.7 910 79.5
Mbale 253 34.8 82 7.2
Mbarara 0 0 22 1.9
Drug exposures
3TC/AZT/NVP 172 23.8 318 26.0
3TC/AZT/EFV 163 22.6 196 16.0
3TC/d4T/NVP 46 6.4 208 17.0
EFV/FTC/TDF 179 24.8 36 2.9
3TC/EFV/TDF 0 113 9.2
Other 161 22.3 351 28.7
log10 viral load 5.2 (4.7–5.9)a 4.8 (4.2–5.3)a 0.35 to 0.54b
CD4 cell count n/a 111 (35–232)a
Subtype predictions
A 1028 42.3 758 44 0.94 to 1.21c
A/D 217 8.9 85 4.9 0.40 to 0.69
C 60 2.5 56 3.2 0.90 to 1.95
D 751 30.9 503 29.2 0.80 to 1.06
Other 374 15.4 322 18.7 1.06 to 1.49
Recombination breakpoints
0 1634 67.2 1234 71.6 0.02 to 0.31d
1 124 5.1 84 4.9 (− 0.20) to (− 0.03)e
2 327 13.5 248 14.4
3 187 7.7 94 5.5
effect estimate = −1.27 log odds, 95% CI = [ −1.32 ,
−1.23 ]; Fig. 2), which was consistent with the virus
popu-lations accumulating resistance mutations in response to each patient’s drug regimen. We found no significant effect of subtype on GSS when this term was added to the model, which implied that patterns of drug resistance in treatment failures were similar across subtypes.
Next, we used Markov chain Monte Carlo sampling to fit a Bayesian network model [31] with baseline/failure as a binomial variable to evaluate associations between specific drugs and treatment failure, while accommodat-ing for potential subtype differences, geographic regional differences, and drugs employed in combination therapy
(Fig. 3). Convergence between replicate chain samples was accessed with respect to posterior probability using the Gelman-Rubin diagnostic (upper confidence limit
= 1.01). The model was fit to the subset of records with
complete information about sampling region, subtype classification and drug exposures ( n=1750 ). Of this
sub-set, n=721 represented baseline records and n=1029
represented treatment failures (Table 1). The distribu-tion of edges among nodes representing antiretroviral drugs was consistent with common drug combinations. For example, we obtained well-supported edges con-necting the nodes representing the drugs 3TC, AZT and NVP. Our network model suggests that, once regional
Kampala
Mbale
Fort Portal
Kabale
Mbarara
Gulu
Rakai
Longitude
Latitude
HIV-1 Prevalence (%)
4 5 6 7 8
A D C A/D Other
se
pyt
bu
S
1-VI
H
0 2 4
30 31 32 33 34 35
Fig. 1 Regional distribution of HIV‑1 subtypes in Uganda. The country sub‑regions are shaded with respect to the estimated HIV‑1 prevalence (%) among adults aged 15–64 from the 2017 Uganda Population‑Based HIV Impact Assessment (UPHIA). Subtype frequencies (by colour, see legend)
for population centres represented in our database are depicted with ring charts mapped to their geographic locations: Fort Portal ( n=308 ); Gulu
differences and drug combinations were accounted for, only 3TC was positively associated with treatment failure (marginal posterior probability, MPP=0.95 ). Similarly,
the model predicted that AZT and TDF were negatively associated with failures (both MPP=0.91 ). Our
consen-sus Bayesian network did not detect any significant asso-ciations between HIV-1 subtypes and any other variables
in the network, including first-line treatment failures (Fig. 3). This result indicated that any statistical associa-tion between first-line treatment failure and HIV-1 sub-types was overwhelmed by the effects of drug exposures. Overall, when accounting for subtype, regional sites in Uganda, and drug regimens, the most significant corre-late of first line treatment failure appeared to be the use of 3TC. These results imply that associations between HIV-1 subtypes and first-line treatment failure, if any, were not driven by drug exposure or resistance.
Clinical differences among HIV‑1 subtypes
Plasma viral load (pVL) measurements were available for 579 baseline samples and 962 failure samples. The mean difference in pVL between baseline and failures samples was 0.44 log10 units, and statistically significant
(Table 1). There was not significant variation in log10
pVL among subtypes at baseline (ANOVA, P=0.85 ),
but marginally significant variation in failure samples ( P=0.04 ; Additional file 1: Figure S3). Within
treat-ment failures, individuals with subtype C infections tended to have lower pVL than the other subtypes (mean difference = −0.38 log10 units; Student’s t test,
95% CI = [ −0.75 , −0.02]); this result is consistent with
previous work in this population [16]. CD4 cell counts were only available for 141 failure samples, and no counts were available for baseline samples (Table 1). We observed no significant variation in CD4 among subtypes (ANOVA, P =0.09).
A A/D D other
Subtype
Baseline (n=721)
C A A/D D other
Subtype
Failures (n=1291)
C
0
1
2
3
GSS
Fig. 2 Genotype susceptibility scores (GSS) by group and HIV‑1 subtype. GSS was calculated from the Stanford resistance scores and drug regimens; to facilitate visualization, the scores were rounded to the nearest integer and capped at a maximum of 3 (highly susceptible genotype, green). Each set of stacked bars represents the proportion of sequences in each GSS category for a given subtype. The area of each set of stacked bars is proportional to the total number of individuals in each subtype category
LPV
ABC 3TC
NVP
DDI
EFV TDF
FTC AZT
D4T
region failure subtype
Fewer recombinants among treatment failures
Table 1 and Additional file 1: Figure S4 depict the over-all distribution of HIV-1 subtypes between baseline and failure samples in the entire database ( n=4154 ).
We found that SCUEAL-defined A/D recombinants ( n=302 ) were significantly less frequent in failure sam-ples (Fisher’s exact test, odds ratio OR=0.53 , 95% CI = [0.40, 0.69]). A similar association was obtained with REGA-defined A/D recombinants ( n=284 , OR=0.34
[0.25, 0.46]); for brevity, the remainder of our analysis will utilize the SCUEAL predictions. To assess whether this effect was caused by combining the Uganda clini-cal and study population data with published sequences from the Stanford HIVdb database, we repeated our analysis excluding the HIVdb data. The frequency of A/D recombinants remained significantly lower among failure samples in this reduced data set ( OR=0.58
[0.41, 0.80]). We also observed that sequences classified by SCUEAL into the ‘other’ category, which comprises subtype U (unclassified) and inter-subtype recom-binants other than A/D, were significantly more likely to occur in failure samples ( OR=1.3 [1.07, 1.49];
Addi-tional file 1: Figure S4). However, the reproducibility of classifying sequences into the ‘other’ category was low (Additional file 1: Table S2). Unexpectedly, subtype U sequences alone were significantly more frequent among failure samples ( OR=2.0 [1.38, 3.03]); no such
association was observed for sequences categorized as subtype A ( OR=1.07 [0.94, 1.21]). Thus, although the
subtype U sequences appear to be evolutionarily related to subtype A (Additional file 1: Figure S2), our data sug-gest that these unclassified variants may be associated with increased rates of first-line treatment failure.
The number of inferred breakpoints in A/D recom-binants was significantly negatively associated with first-line treatment failures (binomial GLM effect estimate
=−0.39 [ −0.67 , −0.12 ] log odds per breakpoint). For
instance, HIV-1 sequences with more than two recombi-nation breakpoints were about 60% less likely to appear in failure samples than expected by chance. This effect was not influenced by sequence length (likelihood-ratio test, P=0.94 ). We also found that the number of
break-points remained significantly lower in failure samples when we expanded our analysis to the entire database including non-recombinants and other inter-subtype recombinants. Since this distribution included a large class of zero breakpoints, we fit a zero-inflated Poisson model to these counts [32]. We found that treatment fail-ures had a significantly greater chance of carrying a non-recombinant strain (log odds =+0.16 , 95% CI = [0.02, 0.31]) and a significantly reduced number of breakpoints
when carrying a recombinant strain (log odds =−0.12 ,
[ −0.2 , −0.03 ]; Table 1).
Since we found a significantly lower frequency of A/D recombinants in the sample population of first-line treatment failures, we further examined associations between HIV-1 recombination and treatment failures. First, we visualized the distribution of inferred recom-bination breakpoints and assignments of recombinant fragments to HIV-1 subtypes A and D (Additional file 1: Figure S5). This plot implies a complex evolu-tionary history of A/D recombinants in Uganda, with recombinants arising from multiple events. Next we examined whether particular A/D recombinant frag-ments were more associated with first-line treatment failures using a series of nucleotide-level association tests along the length of the HIV-1 pol sequence. This analysis revealed that associations between subtype A-derived fragments and treatment failures tended to cluster towards the 3′end/C-terminus of RT, just down-stream of the resistance associated sites in RT (Fig. 4).
0 200 400 600 800 1000 1200
0.
20
.5
1.
02
.0
5.
01
0.
0
Nucleotide position
Odds rati
o
0.01 0.05 0.1 0.5 1
Subtype A associated with failures
Subtype D associated with failures
PR RT
Fig. 4 Nucleotide‑level associations between HIV‑1 subtype and
first‑line treatment failures in HIV‑1 A/D recombinants (n = 302).
Each circle represents the result of a Fisher’s exact test at a specific
nucleotide position in the HIV‑1 pol reference sequence (x‑axis).
The locations of resistance‑associated sites (triangles) within HIV‑1 protease (PR) and reverse transcriptase (RT) are indicated at the bottom of the plot region. The area of circles were scaled in
proportion to the sample size (range n = 79–302) at the respective
nucleotide site, due to the varying coverage of partial sequences.
Circles were coloured with respect to the P‑value of each test (see
Discussion
This study represents the largest database of first-line treatment failures in Uganda to date, drawing from every available study cohort associated with the JCRC. In a pre-vious cross-sectional study of a clinical HIV database in Uganda, we reported a statistical association between HIV subtype D infections and treatment failures on sec-ond-line and salvage therapies ( n=843 ) [33], which are
generally associated with higher failure rates than first-line therapies [34]. Furthermore, suboptimal modification of drug regimens in second-line and salvage therapies may allow substantial virus replication to amplify incipi-ent differences among HIV-1 subtypes. In this study, we observed limited evidence for significant variation with respect to genotype susceptibility scores and plasma viral loads among HIV-1 subtypes within the first-line treat-ment failures. We acknowledge some insurmountable limitations in this retrospective cross-sectional study of all available records of first-line treatment failures in the JCRC databases. For instance, matched baseline and fail-ure samples or duration of treatment were not available for the majority of cases, which would have permitted a longitudinal analysis of these populations. Moreover, our Bayesian network analysis was limited to the n=1750
(42%) records with complete information on drug regi-mens and sampling region.
Examining the marginal distribution of subtypes and failures in the entire database ( n=4154 ), we recovered a
significant and unexpected negative association between A/D recombinants and first-line treatment failures (Addi-tional file 1: Figure S4). We found no significant associa-tion of other inter-subtype recombinants with first-line treatment failures, although the relatively low frequencies of such recombinants in the database limited our power to detect such associations. Inter-subtype HIV-1 recom-binants, estimated to comprise roughly 20% of all infec-tions worldwide, are increasingly significant to global public health [35]. The effective rate of recombination in HIV is comparable to the mutation rate [36]. Recombina-tion of divergent subtypes does not necessarily confer a fitness advantage to the virus; for instance, it may disrupt co-adapted combinations of genetic differences unique to the respective subtypes [37]. We note that in the field of HIV-1, the term ‘fitness’ tends to be reserved for the rep-lication of the virus in the absence of treatment. However, variation in viral fitness is biologically and clinically rele-vant even in the context of treatment, which constitutes a shift in the environment that modulates the fitness of dif-ferent genotypes. Since a large number of genetic differ-ences are fixed among subtypes, recombination between specific subtypes will predictably generate certain geno-type combinations. Hence, even if recombination among subtypes has no net effect on virus fitness, it is reasonable
for recombinants of particular subtypes (e.g., A and D) to be, on average, less fit or more fit than their respective parental variants. Several groups have constructed inter-subtype recombinants and performed functional assays or competitive growth experiments in vitro against the parental strains [38, 39]. Overall, the experimental results are equivocal with some recombinants displaying a slight but significant fitness advantage over the parental strains, while other recombinants are less fit [40]. Our results predict that recombination experiments in pol between subtypes A and D should tend to produce less fit recom-binant viruses on average, and that variation in fitness among recombinants may be predictable from the com-position of the recombinant HIV-1 pol gene sequence.
Overall, our findings are consistent with findings suggesting rates of disease progression among HIV-1 subtypes does not have major impact on response to treatment [6, 16]. With any difference in treatment regi-men, our Bayesian network analysis on a subset of the data indicates that specific drug usage would mask any subtype effect. Only by expanding to the entire database and masking the drug regimens do we detect evidence of reduced failures in patients infected with A/D recom-binants. Based on the analyses and models described above, it is remarkable to observe that relatively frequent recombination between the prevalent subtypes A and D may actually promote the effectiveness of first-line treat-ment regimens in Uganda.
Additional file
Additional file 1. Additional text, figures and tables are provided in sup‑ port of results in the main text, including methodological details on HIV‑1 sequence processing.
Abbreviations
ART : antiretroviral treatment; JCRC : Joint Clinical Research Centre in Uganda; SCUEAL: Subtype Classification Using Evolutionary Algorithms; EARNEST: Europe‑Africa Research Network for Evaluation of Second‑line Therapy trial; PASER: Pan‑African Studies to Evaluate Resistance network; AMC: Academic Medical Center of the University of Amsterdam; MARCH: Monitoring Antiret‑ roviral Resistance in Children observational cohort study; GS: the Hormonal Contraception and HIV‑1 Genital Shedding and Disease Progression among Women with Primary HIV Infection study; DR: clinical samples collected for drug resistance testing at the JCRC ; REGA: not an abbreviation, refers to the Rega Institute for Medical Research of the Katholieke Universiteit Leuven; GLM: generalized linear model; GSS: genotypic susceptibility score; 3TC: lamivu‑ dine; AZT: zidovudine; NVP: nevirapine; EFV: efavirenz; d4T: stavudine; FTC: emtricitabine; TDF: tenofovir; MPP: marginal posterior probability; pVL: plasma viral load; ANOVA: analysis of variance; CI: confidence interval; RT: reverse transcriptase.
Authors’ contributions
drafted the manuscript. All authors contributed to the writing of the report. All authors read and approved the final manuscript.
Author details
1 Department of Pathology and Laboratory Medicine, Health Sciences Addi‑
tion, H422, Western University, London, ON N6G 2R5, Canada. 2 Department
of Microbiology and Immunology, Western University, London, Canada.
3 Department of Applied Mathematics, Western University, London, Canada. 4 Joint Clinical Research Centre, Kampala, Uganda. 5 Center for AIDS Research
Uganda Laboratories, Joint Clinical Research Centre, Kampala, Uganda.
6 Department of Molecular Biology and Microbiology, Case Western Reserve
University, Cleveland, OH, USA. 7 Department of Medicine, Case Western
Reserve University, Cleveland, OH, USA. 8 Department of Pathology, Case
Western Reserve University, Cleveland, OH, USA.
Acknowledgements
The Ugandan Drug Resistance Study Team comprises the following investiga‑ tors: Dr. Nicholas I. Paton, Dr. Sarah Walker, Dr. Anne Hoppe (Medical Research Council Clinical Trials Unit, University College London, London, United Kingdom); Prof. Tobias F. Rinke de Wit, Dr. Kim C. E. Sigaloff, Dr. Raph Hamers, Dr. T. Sonia Boender, Dr. Ragna S. Boerma, Dr. Pascale Ondoa, Marloes Nijboer, Stefanie Kroeze, Seth Inzaule (Amsterdam Institute for Global Health and Development, Department of Global Health, Amsterdam, Netherlands); Dr. Cissy Kityo Mutuluuza (Joint Clinical Research Centre, Kampala, Uganda); and Dr. Alani Sulaimon Akanmu (Department of Haematology & Blood Transfusion, College of Medicine of the University of Lagos, Lagos, Nigeria).
Competing interests
The authors declare that they have no competing interests.
Availability of data and materials
The data that support the findings of this study are available from Ugandan Drug Resistance Study Team but restrictions apply to the availability of these data, and so are not publicly available. Data are however available from the authors upon reasonable request and with permission of the Ugandan Drug Resistance Study Team.
Consent for publication
Not applicable.
Ethics approval and consent to participate
Samples from the EARNEST trial were collected under a protocol approved by the research ethics committee at University College London, with written informed consent provided by patients, or by caregivers for patients under 18 years of age. The sample collection protocol for the GS study was approved by the institutional review boards of the collaborating institutions, and all participants provided informed consent. Samples from the PASER network were collected under a protocol approved by research ethics committees at the collaborating sites and the AMC, and all participants provided written informed consent. Samples from the JCRC, including DR samples and samples from the MARCH study were collected with informed consent provided by parent(s)/guardian(s); the sample collection protocol was approved by the ethical committees at the JCRC and the AMC. Our analysis of these anonymized data was collectively approved by the institutional review board of the JCRC (EM10‑07).
Funding
This study was supported by grants from the National Institutes of Health (AI49170, AI36219 and AI‑71747), the Case Western Reserve University/ University Hospitals Center for AIDS Research (P30 AI036219), the Canadian Institutes of Health Research (CIHR BOP‑149562, PJT‑155990 and PJT‑156178), and in part by the Government of Canada through Genome Canada and the Ontario Genomics Institute (OGI‑131). EN was supported by a Queen Elizabeth II Diamond Jubilee Scholarship (Western University DLI O19375892122). AFYP was supported by a CIHR New Investigator Award (FRN‑130609).
Publisher’s Note
Springer Nature remains neutral with regard to jurisdictional claims in pub‑ lished maps and institutional affiliations.
Received: 26 August 2018 Accepted: 8 January 2019
References
1. Saxinger WC, Levine PH, Dean AG, de Thé G, Lange‑Wantzin G, Moghissi J. Evidence for exposure to HTLV‑III in Uganda before 1973. Science. 1985;227(4690):1036–8.
2. Stoneburner RL, Low‑Beer D. Population‑level HIV declines and behavio‑ ral risk avoidance in Uganda. Science. 2004;304(5671):714–8.
3. Uganda AIDS Commission. The HIV and AIDS Uganda Country Progress Report 2014. Kampala: Uganda AIDS Commission; 2015.
4. Quinn TC, Wawer MJ, Sewankambo N, Serwadda D, Li C, Wabwire‑ Mangen F. Viral load and heterosexual transmission of human immu‑ nodeficiency virus type 1. Rakai Project Study Group. N Engl J Med. 2000;342(13):921–9.
5. Montaner JSG, Hogg R, Wood E, Kerr T, Tyndall M, Levy AR. The case for expanding access to highly active antiretroviral therapy to curb the growth of the HIV epidemic. Lancet. 2006;368(9534):531–6.
6. Bhargava M, Cajas JM, Wainberg MA, Klein MB, Pant Pai N. Do HIV‑1 non‑B subtypes differentially impact resistance mutations and clinical disease progression in treated populations? Evidence from a systematic review. J Int AIDS Soc. 2014;17:18944.
7. Lessells RJ, Katzenstein DK, de Oliveira T. Are subtype differences impor‑ tant in HIV drug resistance? Curr Opin Virol. 2012;2(5):636–43. 8. Tebit DM, Arts EJ. Tracking a century of global expansion and evolution
of HIV to drive understanding and to combat disease. Lancet Infect Dis. 2011;11(1):45–56.
9. Kaleebu P, French N, Mahe C, Yirrell D, Watera C, Lyagoba F. Effect of human immunodeficiency virus (HIV) type 1 envelope subtypes A and D on disease progression in a large cohort of HIV‑1‑positive persons in Uganda. J Infect Dis. 2002;185(9):1244–50.
10. Eshleman SH, Gonzales MJ, Becker‑Pergola G, Cunningham SC, Guay LA, Jackson JB. Identification of Ugandan HIV type 1 variants with unique patterns of recombination in pol involving subtypes A and D. AIDS Res Hum Retroviruses. 2002;18(7):507–11.
11. Harris ME, Serwadda D, Sewankambo N, Kim B, Kigozi G, Kiwanuka N. Among 46 near full length HIV type 1 genome sequences from Rakai District, Uganda, subtype D and AD recombinants predominate. AIDS Res Hum Retroviruses. 2002;18(17):1281–90.
12. Gray RR, Tatem AJ, Lamers S, Hou W, Laeyendecker O, Serwadda D. Spatial phylodynamics of HIV‑1 epidemic emergence in East Africa. AIDS. 2009;23(14):F9–17.
13. Kaleebu P, Kirungi W, Watera C, Asio J, Lyagoba F, Lutalo T. Virological response and antiretroviral drug resistance emerging during antiret‑ roviral therapy at three treatment centers in Uganda. PLOS ONE. 2015;10(12):e0145536.
14. Baeten JM, Chohan B, Lavreys L, Chohan V, McClelland RS, Certain L. HIV‑1 subtype D infection is associated with faster disease progres‑ sion than subtype A in spite of similar plasma HIV‑1 loads. J Infect Dis. 2007;195(8):1177–80.
15. Kiwanuka N, Laeyendecker O, Robb M, Kigozi G, Arroyo M, McCutchan F. Effect of human immunodeficiency virus Type 1 (HIV‑1) subtype on disease progression in persons from Rakai, Uganda, with incident HIV‑1 infection. J Infect Dis. 2008;197(5):707–13.
16. Venner CM, Nankya I, Kyeyune F, Demers K, Kwok C, Chen PL. Infecting HIV‑1 subtype predicts disease progression in women of sub‑Saharan Africa. EBioMedicine. 2016;13:305–14.
17. Abraha A, Nankya IL, Gibson R, Demers K, Tebit DM, Johnston E. CCR5‑ and CXCR4‑tropic subtype C human immunodeficiency virus type 1 iso‑ lates have a lower level of pathogenic fitness than other dominant group M subtypes: implications for the epidemic. J Virol. 2009;83(11):5592–605. 18. Kiwanuka N, Laeyendecker O, Quinn TC, Wawer MJ, Shepherd J, Robb M. HIV‑1 subtypes and differences in heterosexual HIV transmission among HIV‑discordant couples in Rakai, Uganda. AIDS. 2009;23(18):2479–84. 19. Conroy SA, Laeyendecker O, Redd AD, Collinson‑Streng A, Kong X,
•fast, convenient online submission •
thorough peer review by experienced researchers in your field • rapid publication on acceptance
• support for research data, including large and complex data types •
gold Open Access which fosters wider collaboration and increased citations maximum visibility for your research: over 100M website views per year •
At BMC, research is always in progress.
Learn more biomedcentral.com/submissions
Ready to submit your research? Choose BMC and benefit from:
20. Coutsinos D, Invernizzi CF, Xu H, Brenner BG, Wainberg MA. Factors affect‑ ing template usage in the development of K65R resistance in subtype C variants of HIV type‑1. Antivir Chem Chemother. 2010;20(3):117–31. 21. Madec Y, Leroy S, Rey‑Cuille MA, Huber F, Calmy A. Persistent difficulties in
switching to second‑line ART in sub‑Saharan Africa—a systematic review and meta‑analysis. PLOS ONE. 2013;8(12):e82724.
22. Rhee SY, Gonzales MJ, Kantor R, Betts BJ, Ravela J, Shafer RW. Human immunodeficiency virus reverse transcriptase and protease sequence database. Nucleic Acids Res. 2003;31(1):298–303.
23. Paton NI, Kityo C, Hoppe A, Reid A, Kambugu A, Lugemwa A. Assessment of second‑line antiretroviral regimens for HIV therapy in Africa. N Engl J Med. 2014;371(3):234–47.
24. Morrison CS, Demers K, Kwok C, Bulime S, Rinaldi A, Munjoma M. Plasma and cervical viral loads among Ugandan and Zimbabwean women during acute and early HIV‑1 infection. AIDS (London, England). 2010;24(4):573–82.
25. Hamers RL, Straatsma E, Kityo C, Wallis CL, Stevens WS, Sigaloff KCE. Build‑ ing capacity for the assessment of HIV drug resistance: experiences from the PharmAccess African studies to evaluate resistance network. Clin Infect Dis. 2012;54(Suppl 4):S261–5.
26. Boender TS, Sigaloff KC, Kayiwa J, Musiime V, Calis JC, Hamers RL. Barriers to initiation of pediatric HIV treatment in Uganda: a mixed‑method study. AIDS Res Treatment. 2012;2012:817506.
27. Kosakovsky Pond SL, Posada D, Stawiski E, Chappey C, Poon AFY, Hughes G. An evolutionary model‑based algorithm for accurate phylogenetic breakpoint mapping and subtype prediction in HIV‑1. PLoS Comput Biol. 2009;5(11):e1000581.
28. Pineda‑Peña AC, Faria NR, Imbrechts S, Libin P, Abecasis AB, Deforche K. Automated subtyping of HIV‑1 genetic sequences for clinical and surveil‑ lance purposes: performance evaluation of the new REGA version 3 and seven other tools. Infect Genet Evol. 2013;19:337–48.
29. Van Laethem K, De Luca A, Antinori A, Cingolani A, Perna CF, Vandamme AM. A genotypic drug resistance interpretation algorithm that signifi‑ cantly predicts therapy response in HIV‑1‑infected patients. Antivir Ther. 2002;7(2):123–9.
30. Poon AFY, Lewis FI, Pond SLK, Frost SDW. An evolutionary‑network model reveals stratified interactions in the V3 loop of the HIV‑1 envelope. PLoS Comput Biol. 2007;3(11):e231.
31. Friedman N, Koller D. Being Bayesian about network structure. A Bayes‑ ian approach to structure discovery in Bayesian networks. Mach Learn. 2003;50(1–2):95–125.
32. Lambert D. Zero‑inflated Poisson regression, with an application to defects in manufacturing. Technometrics. 1992;34(1):1–14.
33. Kyeyune F, Nankya I, Metha S, Akao J, Ndashimye E, Tebit DM, et al. Treat‑ ment failure and drug resistance is more frequent in HIV‑1 subtype D versus subtype A‑infected Ugandans over a 10‑year study period. AIDS. 2013;27(12):1899–909.
34. Pujades‑Rodríguez M, Balkan S, Arnould L, Brinkhof MA, Calmy A. Treat‑ ment failure and mortality factors in patients receiving second‑line HIV therapy in resource‑limited countries. JAMA. 2010;304(3):303–12. 35. Ward MJ, Lycett SJ, Kalish ML, Rambaut A, Leigh Brown AJ. Estimating the
rate of intersubtype recombination in early HIV‑1 group M strains. J Virol. 2013;87(4):1967–73.
36. Neher RA, Leitner T. Recombination rate and selection strength in HIV intra‑patient evolution. PLoS Comput Biol. 2010;6(1):e1000660. 37. Otto SP, Lenormand T. Evolution of sex: resolving the paradox of sex and
recombination. Nat Rev Genet. 2002;3(4):252.
38. Bagaya BS, Tian M, Nickel GC, Vega JE, Li Y, He P, et al. An in vitro model to mimic selection of replication‑competent HIV‑1 intersubtype recombina‑ tion in dual or superinfected patients. J Mol Biol. 2017;429:2246–64. 39. Simon‑Loriere E, Galetto R, Hamoudi M, Archer J, Lefeuvre P, Mar‑
tin DP. Molecular mechanisms of recombination restriction in the envelope gene of the human immunodeficiency virus. PLoS Pathog. 2009;5(5):e1000418.