2016 International Conference on Artificial Intelligence: Techniques and Applications (AITA 2016) ISBN: 978-1-60595-389-2
Identification of Rice Storage Quality Based on Computer Vision
Li-li WU*, Bao-zhou ZHENG, Yu-qing XING and Ai-ying LIN
College of Sciences, Henan Agricultural University, Zhengzhou, 450002, China *Corresponding author
Keywords: Computer vision, Color feature, Texture feature, Probabilistic neural network, Back propagation network.
Abstract. Computer vision technology was introduced in this paper to discriminate the rice storage quality. The rice images of ten categories were obtained by the computer vision hardware device, and the total number of images was 160, of which 100 were used as training samples and 60 as test samples. The 20 feature parameters of color and texture features were extracted from all the samples, which were classified by the BP neural network, and probabilistic neural network (PNN) respectively, and the rate of identification was 85%, 91.67%. Compared to the BP neural network, PNN has better classification results. The experimental results showed that the method based on color and texture feature is effective in the identification of rice storage quality.
Introduction
Computer vision is also called machine vision, which is an interdisciplinary subject involving neural biology, physics, computer science, image processing, pattern recognition and artificial intelligence fields. The computer vision system uses image sensor (instead of human eyes) to acquire the object image, and converts the analog image into a digital image signal, then completes the processing and interpretation of information by computer (instead of human brain), which can simulate or reproduce the human visual behavior by computer.
Since 1980s, domestic and overseas scholars have begun to study the identification and classification of rice by computer vision technology. The researches on the quality of rice mainly focused on the appearance and processing quality, yet the storage quality was very little. Nowadays the rice quality detection researches in China mainly concentrated in the appearance quality of rice outline, chalkiness, yellow grains, grain type, precision machining, head milled rice rate [1,2], et al. The color, texture and other macro characteristics quality of rice have rarely been studied. In order to recognize the early moldy rice during storage, an identification method of rice storage quality based on color and texture features was proposed in this paper.
Acquiring and Processing of Rice Image
Experimental Material
The experimental sample was the Yuanyang Rice produced in 2013, which was provided by Henan Academy of Agricultural Sciences. All rice samples were placed in the biochemical incubators under different storage conditions. The rice samples were 100g, and the relative humidity was 15% in each incubator. The storage temperature of incubator No.1~No.5 was 15℃. The storage time of sample No.1 was 3 months, No. 2 was 5 months, No. 3 was 7 months, No. 4 was 9 months, and No. 5 was 12 months. The storage temperature of incubator No.6~No.10 was 20℃. The storage time of sample No.6 was 3 months, No. 7 was 5 months, No. 8 was 7 months, No. 9 was 9 months, and No. 10 was 12 months.
Acquisition of Rice Image
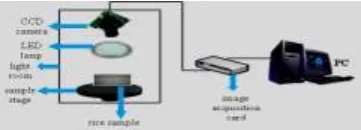
stage is black. The black bottom plate was covered with a thick layer of rice, who was not exposed. These ensured that the image was not affected by the background interference, and the image segmentation process was omitted in the subsequent image recognition. So the detection speed was greatly improved. The schematic diagram of the machine vision hardware system was shown in Fig.1. The CCD camera converted the optical signals of rice image into the analog signals, which was expressed as R, G, B color value, and these signals were input image acquisition card. Then the input analog signals were converted into digital signals (A/D conversion of rice images) and input computer for subsequent processing. In the experiments the number of collected images for each rice sample was 16 frames, and the total number was 160 pieces. Each image size is 640×480, of which the first 10 images of each sample would be used as training samples, the rest of 6 images as test samples.
Figure 1. The schematic diagram of the machine vision hardware system.
Image Preprocessing
In the process of image formation, transmission, reception and processing, it can be inevitably affected by the noise interference[3], therefore image de-noising is necessary before feature extraction. The algorithms commonly used are mean filter, median filter, Gauss filter and frequency domain low-pass filter, etc. The median filter algorithm was used to smooth the image in this paper because it could protect the image details while removing the noise. Median filter is essentially a statistical sort filter. There is a point (i,j) in the original image, the median filter sorts all pixels in this point centered area[7]. The effect of median filtering depends on the size of the filter window, if the window size is too large, the edge of the filtered image will be blurred, on the contrary, too small, the effect of de-noising is poor.
Feature Extraction
In order to identify the categories of the image, it needs to be distinguished from other different types of images, which requires that the selected feature is not only a good description but also an obvious discrimination of the image. The selection of characteristic value directly affects the recognition rate of machine vision. The parameters of color and texture feature were extracted in this paper.
Color Feature Extraction
The color change of rice during storage is one of the most direct appearance of quality change. According to the change of rice color, we can determine the rice freshness and moldy degree in some extent. Compared with the geometrical features, the color feature is less dependent on the size, direction and angle of view, so it has strong robustness.
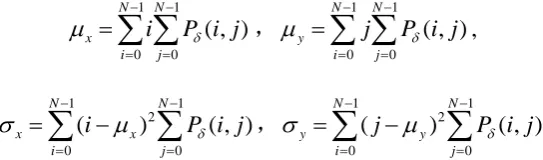
A very simple and effective color feature is the color matrix, which carries out statistical calculation according to the distribution information of different color components. Because the color distribution information is mainly concentrated in the low order matrix, the color feature extraction of the rice images is based on the first and second order moment in the experiment. The formulas for calculation are shown in formula (1) and formula (2) [4].
(i) First order moment (mean value)
1
1
i i D
X N
(1)
22 1
1
i i D
X N
(2)where 1 is the first order central moment in a certain region, D is a certain target area, Xi is the color value of a pixel in the D area, and N is the number of pixels in the D area.
The color image of rice samples obtained by the camera was RGB model, but HIS model was consistent with the observed pattern of the human eyes, therefore the HSI and RGB models were all used to extract the characteristic parameters of rice images in this paper.
In the experiments, the first and second order moments of R, G, B, H, I and S components were extracted from the images of rice samples after pretreatment, and the total number of color characteristic parameters of each sample was 12. In order to facilitate the subsequent pattern recognition, the characteristic parameters were normalized. Table 1 listed the color feature values of the first 10 images as training samples in the No.1 rice sample.
Table 1. The mean values of the color characteristic parameters of No.1 rice sample.
No.1 rice sample
1 2 3 4 5 6 7 8 9 10
R 0.649726 0.655893 0.648886 0.659039 0.64081 0.660551 0.661044 0.657703 0.64587 0.650005 G 0.650651 0.65601 0.649023 0.659193 0.639042 0.660883 0.660626 0.657394 0.656012 0.660388 B 0.629107 0.634782 0.627659 0.637548 0.614978 0.639454 0.643745 0.639872 0.639249 0.644419 H 0.226784 0.224667 0.228775 0.225134 0.205337 0.224145 0.242768 0.239267 0.292213 0.305771 S 0.026114 0.025864 0.026389 0.026086 0.02972 0.025761 0.022798 0.023366 0.022745 0.02249
I 0.643161 0.648895 0.641856 0.651926 0.63161 0.65363 0.655138 0.651656 0.647044 0.651604 R 0.075274 0.068719 0.084041 0.072754 0.075839 0.06639 0.06813 0.075142 0.066923 0.066800 G 0.07088 0.064496 0.079321 0.06863 0.070908 0.062845 0.064038 0.070494 0.062452 0.062392 B 0.074394 0.067597 0.081583 0.072541 0.073821 0.066819 0.067961 0.073262 0.066645 0.067274 H 0.180155 0.184835 0.185984 0.183889 0.171944 0.180905 0.214581 0.208195 0.166723 0.170663 S 0.021017 0.021741 0.022015 0.021661 0.023457 0.021498 0.020443 0.020643 0.017671 0.017485 I 0.072639 0.065887 0.080802 0.070357 0.072533 0.064283 0.065686 0.072054 0.064379 0.064529
Texture Feature Extraction
Texture is an important basis for the human visual system to distinguish the natural objects. The methods of texture feature mainly include structural, statistical, model and spectral method. The gray level co-occurrence matrix (GLCM) is an important method for the analysis of image texture features proposed by Haralick[8], which is one of the most commonly used methods for statistical analysis of texture.
In order to describe the texture state more intuitively, some parameters were derived from the GLCM, and formed the final feature vectors to represent the texture features through the combination of these parameters. Considering the classification effect and the time consuming, angular second order moment, correlation, contrast, and homogeneity were selected to represent the texture features. The formulas for the calculation of these four characteristics are as follows [12]:
(i) Angular second order moment
1 1
2 1
0 0
( , ) N N
i j
T P i j
(3)Angular second order moment is a measurement of the uniformity to the image gray level distribution, which is the square sum of the element values in the GLCM, so it is also called energy. (ii) Correlation
1 1
2
0 0
( , )
N N
x y
i j x y
ijP i j
T
where x is the gray mean value, y is smoothing mean, x is the gray scale variance, and y is smoothing variance. 1 1 0 0 ( , ) N N x i j
i P i j
, 1 1 0 0 ( , ) N N y i jj P i j
, 1 1 2 0 0 ( ) ( , ) N N x x i ji P i j
, 1 1 2 0 0 ( ) ( , ) N N y y i jj P i j
The correlation reflects the similarity degree of rows and columns in the co-occurrence matrix. (iii) Contrast
1 1 2 3 0 0 ( ) ( , ) N N i j
T i j P i j
(5)Contrast refers to the difference in the brightness level of the image between the most white and the most dark, which can be understood as the image clarity and texture depth.
(iv) Homogeneity
1 1
4 2
0 0
( , ) 1 ( ) N N
i j
P i j T i j
(6) Homogeneity is used to measure whether the local variation of image texture is uniform or not. These parameters represent the some properties of the image texture features, so they can reflect the difference of the texture characteristics of the different images and realize the images classification. [image:4.595.169.441.118.198.2]In the experiment, the RGB images of rice samples were converted to gray level images. In order to reduce the computation time, the gray level of the sample (256) was quantified as 16. Then the GLCMs in the direction of 0°, 45°, 90° and 135° were calculated and normalized by the Gauss function respectively. The four statistical characteristics (angular second order moment, correlation, contrast, and homogeneity) of the GLCMs were calculated, and then the mean and standard deviation of each characteristic were computed, so the 8 dimensional vectors were the final texture feature vectors. Table 2 listed the texture feature values of the first 10 images as training samples in the No.1 rice sample.
Table 2. Mean value of texture characteristic parameters of No.1 rice sample.
Mean value
No.1 rice sample 1 2 3 4 5 6 7 8 9 10
angular second
order moment 0.373362 0.40591 0.371331 0.392372 0.382064 0.424271 0.415756 0.39221 0.410203 0.421503 correlation, 0.867914 0.851471 0.893111 0.864774 0.878221 0.849596 0.852165 0.875706 0.85317 0.849517 Contrast 0.110704 0.10352 0.105506 0.106221 0.096584 0.100543 0.102624 0.101535 0.100139 0.099845 Homogeneity 0.946277 0.949778 0.94908 0.948608 0.953239 0.951406 0.950316 0.95078 0.951316 0.951313
Standard deviation
angular second
order moment 0.011724 0.011847 0.010910 0.011615 0.010538 0.011467 0.011561 0.010951 0.011698 0.011813 correlation 0.025129 0.028485 0.020592 0.026017 0.023547 0.028541 0.028085 0.023784 0.027957 0.028747 Contrast 0.020892 0.019745 0.020046 0.020253 0.018440 0.019000 0.019389 0.019254 0.018991 0.018979 Homogeneity 0.009476 0.008989 0.009035 0.009137 0.008363 0.008561 0.008771 0.008735 0.008705 0.008779
Identification of Rice Storage Quality Based on Artificial Neural Network
Identification Based on BP Network
Using BP network to identify the quality of rice storage, color features and texture features were the 20 dimensional input vectors, and the types to be identified were the 8 dimensional output vectors. In BP network, the hidden layer of S type excitation function was adopted, and the number of neurons in the hidden layer was 12 (the correct recognition rate is the highest). The Levenberg-Marguardt optimization algorithm was used in the network training function, the network maximum training step size was set to 5000, and the target error was 0.0001.
[image:5.595.141.456.306.467.2]BP algorithm was used to train network parameters for each kind of rice samples, and then identify the other. In each of the 16 rice samples, 10 were taken as training samples, and the total number of training samples was 100. The remaining 6 images were taken as test samples, and the total number was 60. The identification results were shown in table 3. When the training samples were identified by the BP network, the classification results were good. However, when the test samples were classified, the identification results were not very satisfactory by modifying the number of hidden layer units and the weight learning algorithm. These showed that the generalization ability of BP network was low in the case of small samples.
Table 3. Identification results of BP network.
Rice sample type
Recognition rate of training samples
(%)
Recognition rate of testing samples
(%)
1 100 100
2 90 90
3 100 100
4 100 90
5 100 80
6 100 90
7 90 80
8 100 90
9 90 90
10 100 100
total 96 85
Identification Based on PNN Network
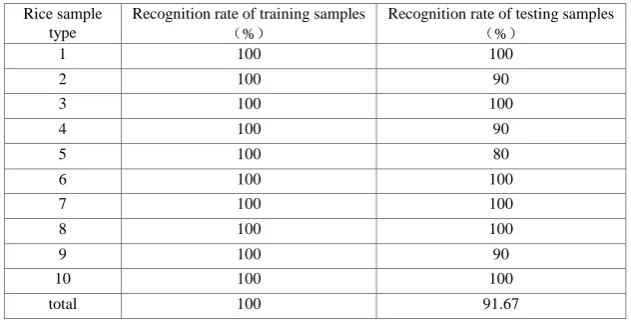
[image:5.595.140.456.636.798.2]Using PNN network to identify the rice storage quality, the same input training samples (100 images) and test samples (60 images) with BP network were adopted. In the design of PNN, the distribution density (expressed by Spread) of the radial basis function had a great influence on the classification performance. When Spread was close to 0, PNN became a nearest neighbor classifier. When Spread was increased, PNN needed to consider the vector nearby. In the training of the network, when the value of Spread was in 0.003~0.05, the identification rate is 100%, which was determined by experiments. The test samples were input to the trained PNN, and the results were shown in Table 4. The overall recognition rate of the test samples was 91.67%, which was obviously improved compared with the BP network.
Table 4. Identification results of PNN network(Spread=0.01). Rice sample
type
Recognition rate of training samples
(%)
Recognition rate of testing samples
(%)
1 100 100
2 100 90
3 100 100
4 100 90
5 100 80
6 100 100
7 100 100
8 100 100
9 100 90
10 100 100
Summary
In this paper, a machine vision hardware system was used to collect 10 kinds of rice samples with different storage quality. After pretreatment by median filter, the mean and variance of R, G, B, H, S, I color components were extracted, meanwhile the mean value and standard deviation of angular second order moment, correlation, contrast, and homogeneity were also selected. The total 20 parameters were used as classification features. The BP network and PNN network were adopted respectively. Due to the low generalization ability of BP network in the case of small samples, the recognition rate of 10 kinds of rice with different storage quality was only 85%. Compared with the BP algorithm, PNN network had the advantages of fast learning speed, good convergence, whose structure design was flexible and convenient, so the correct identification of rice samples was increased to 91.67%.
Acknowledgement
This research was financially supported by the Scientific and Technological project of Henan Province (142102110054).
References
[1] Chen Jianwei, “ A review of rice quality inspection based on machine vision technology,” Cereals & Oils, vol. 5, pp. 39-41, 2008.
[2] Wan Peng, Long Changjiang and Ren Yilin, “ Application Progress of Machine Vision Technology in the Quality Inspection of Rice,” Hubei Agricultural Sciences, vol. 51, pp. 873-876, 2012.
[3] Zhang Hong, “Digital image processing and analysis,” Beijing: China Machine Press, 2013. [4] Yang Qian, Gao Xiaoyang and Wu Jiling, et. al, “Identification of barley diseases based on texture color feature,” Journal of China Aguricultural University, vlo. 18, pp.129-135, 2013.
[5] Lu Jun, Fu Xueyuan and Miao Chenlin, et.al, “Citrus automatic grading by color and texture features,” Journal of Huazhong Agricultural University, vol. 31, pp. 783-786,2012.
[6] Lv Bo, “A new content-based image retrieval method combined color with texture ,” Master Degree thesis. Xian, Shanxi, China: Xidian University, 2013, 1.
[7] Hu Min, Chen Hongbo and Xu liangfeng, et. al, “Cucumber disease recognition algorithm based on color and texture features,” Journal of electronic measurement and instrumentation, vol. 29, pp. 970-977, 2015.
[8] Haralick R M, Shanmugam K and Dinstein I H, “ Textural features for image classification Systems,” Man and Cybernetics, IEEE Transactions , vol. 6, pp. 610-621, 1973.
[9] Ge Jingxiang, “Study of image feature extraction and texture classification algorithm,” Master Degree thesis. Tianjin, China: Tianjin University, 2011, 5.
[10] Wang Long, “Study on image texture feature extraction and classification,” Master Degree thesis. Qingdao, Shandong, China: Ocean University of China, 2014, 5.
[11] Alexander Barley, Christopher Town, “Combinations of Feature Descriptors for Texture Image Classification,” Journal of Data Analysis and Information Processing, vol. 2, pp.67-76, 2014.
[12] Gamil Abdel Azim, “ Identification of Textile Defects Based on GLCM and Neural Networks,” Journal of Computer and Communications, vol. 3, pp. 1-8, 2015.