2016 International Conference on Manufacturing Science and Information Engineering (ICMSIE 2016) ISBN: 978-1-60595-325-0
Study On Vector Element Evaluation Method
For Urban Underground Space Resources
Based On GIS
XIANCHANG ZHENG, ZHIMIN HU and WEIFENG ZHENG
ABSTRACT
Recently the raster unit method and modified variable grid element method have been widely applied to the GIS-based urban underground space resources comprehensive evaluation. The raster unit method needs to divide the area into units, whose size controls accuracy of the assessment. Because the unit boundary is fixed, there are usually data conflicts and lack of information in some units. Therefore, graphical representation of the evaluated results becomes not precise. The modified variable grid element method solves the contradiction between result accuracy and data redundancy, through splitting the area into smaller elements in key and sensitive regions. However, the new vector element method proposed by this article can obtain a clear boundary and accurate calculation result because it is based entirely on the actual unit edge of each factor. Nevertheless, its application is limited by its complex operation. A practical example for underground space resources fuzzy-comprehensive evaluation based on the vector element method is introduced in this paper, together with the key steps for assessment and GIS-Attribute database structure design, which could provide a reference for similar projects.1
1 INTRODUCTION
Urban underground space is an important resource for the development of a city. Its development is not only affected by the geology, hydrology and topography of the area but also its ultimate function and impact to the society. These factors judge the potentials of development. In modern comprehensive evaluated projects, many objects are related to spatial information, such as the evaluation of urban
Xianchang Zheng, Zhimin Hu, Department of Civil Engineering, Guangzhou University, P.R.C.
geological environment and resource assessment of urban underground space. Spatial overlay is the most important analysis function of geographic information system. With its advantages on data management and spatial analysis, it can greatly promote the application of GIS technology in the fuzzy comprehensive evaluation.
In recent years, the evaluation research of urban space resources is mainly focused on how to select the evaluation factors, weight assignment method and mathematical evaluation model. Three methods are usually used to divide the evaluation unit. They are fixed element method, raster unit method and improved variable-raster unit method. A new method will be introduced in this paper. Through vector element, the method achieves a fuzzy comprehensive evaluation.
2 TWO MODELS OF EVALUATION UNITS IN GIS
Geographical-unit assessment method is mostly used to evaluate objects which are related to spatial information comprehensively. Usually two modes can be used in GIS: raster unit and vector unit. Raster unit means a special basic rasterization unit, which behaves like the same deciles space unit model, to simulate the property of actual space boundary approximately. The size and shape of the units are almost the same. Errors are generally caused by raster unit when vector data are transformed to raster data. The size of raster unit is specified by the users and is directly related to accuracy of assessment results. The size of raster units is critical. If it is too large, the actual information of original space would be lost. Otherwise small size units would occupy excessive computer resources. The value is dependent on accuracy of original data and actual requirements. Now raster unit assessment method is mostly used for evaluating comprehensive fuzzy in GIS because of its easy operating.
Vector unit is operated overlay from multi-layer spatial data based on single element of vector graphics, which owns actual space property boundary. Therefore the sizes and shapes are different. Errors of vector unit are mainly affected by the accuracy of original vector data. However it has some problems, such as different sizes and shapes, complex boundary and difficulty to design. The applications of vector unit are limited largely in the fuzzy comprehensive evaluation in GIS.
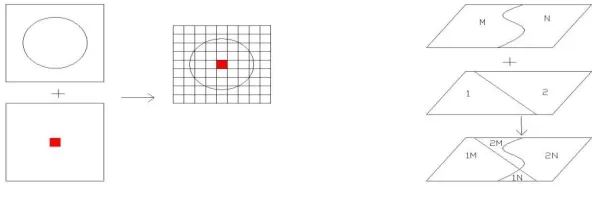
[image:2.612.138.440.543.644.2]
a. Superposition of raster unit b. Superposition of vector unit
Figure 1. Graphic illustration of difference between raster unit and vector unit.
In addition, it has another computation model called false vector, which means that model data is used to analyze the vector pattern. Vector data is dividing into many standard grids by human without operation of actual vector boundary.
3 BASIC STEPS OF FUZZY COMPREHENSIVE EVALUATION BASED ON VECTOR UNIT
The fuzzy comprehensive method based on GIS shows great advantages in function of space analysis. The element with clear boundary can be quantified to resolve complex multi-factors problems with simple mathematical model. The basic steps of using vector unit for fuzzy comprehensive evaluation in GIS are as following:
According to purpose of evaluation, determine the factor elements, found multi-level evaluation index system and establish assessment database.
Analyze figure of each vector factor and make necessary modification, such as consistency conversion of projection, cutting of boundary on research areas and improvement of the vector graphics element boundary.
Determine the weight coefficient. The factors would be compared each other to determine mutual importance and establish judgment matrix to get weight coefficient setting finally by analytic hierarchy process (AHP).
Gain the membership degree value of comprehensive evaluation. Unified scale is used to quantify different indicators to eliminate the injustice of indicators, and membership function of quantitative indicators can be determined by semi-trapezoidal distribution mode or lower semi-semi-trapezoidal distribution mode. Quantitative methods of indicators are mainly expert-judgment method, such as Delphi method, binary contrast method, analytic hierarchy process method and improvement of level analysis method etc.
Superimpose all factor graphs to gain attribute data of every cutting units. The property value of each unit can be obtained through a certain algorithms of fuzzy comprehensive evaluation, which is used in clustering and discriminate analysis.
4 KEY TECHNOLOGIES OF GIS SOFTWARE
The key technologies in GIS based on vector assessment of fuzzy comprehensive evaluation are followed.
4.1 Accuracy of the Original Vector Data
assessment results, which can be derived from Multi-source of basic data and diversity of formats. Low accuracy of vector graphic boundary would result complex boundary of combined maps and data-lost, which is recommended to determine a standard range boundary based on project assessment when multi-factor vector is ready. This standard boundary can be used for all the factor vectors in cutting, patching and border measures during the whole process.
4.2 Division of Assessment Cell
[image:4.612.115.548.279.535.2]The vector graphic is divided into assessment units based on actual boundary of element factor wholly. This operation is provided by Graphics Overlay in GIS software. The actual boundaries of factors can be reflected realistically in vector operation method, although the content of graphic is complex,as shown in Figure 2 below.
Figure 2. Graphic illustration of division of assessment cell.
4.3 Membership Degree Calculating through the Vector Attribute Database
Another advantage of vector element model is to analyze the results from fuzzy comprehensive evaluation calculating. The attribute database of the combined graphic can be used to calculate fuzzy comprehensive evaluation property.
Intersect Process” in GIS software. Eventually the comprehensive assessment classification of each unit can be obtained by some common principle of evaluation, such as maximum membership degree principle.
4.4 Post-Processing to the Integrated Diagram
The integrated diagram comes from the cutting of all factors graphic, which has a huge number of units and complex graphics boundaries, so it need to do some post-processing to express the meaning clearly:
Calculate the attribute data to gain the membership grades of all units, and use the same color to the same discriminate level unit through the "From Properties to Parameters" operating in GIS software.
Merge the same level adjacent cells to significantly reduce the total number of units. Otherwise, there will be some difficulties to browse and edit the integrated diagram especially in the case of vast amounts of cutting cells.
5 CASE STUDY
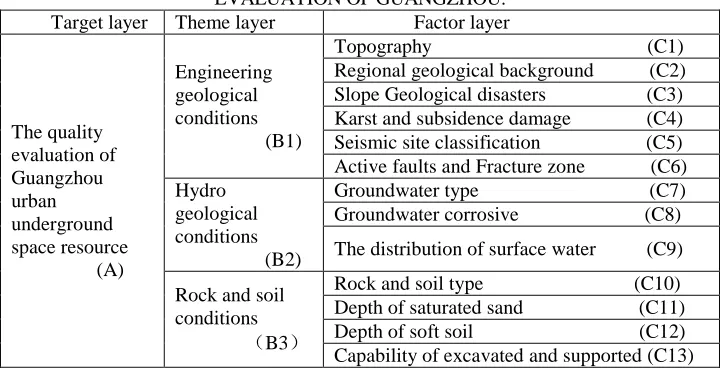
[image:5.612.117.479.403.590.2]In order to evaluate the quality of Guangzhou urban underground space resource, we selected 13 factors as follow:
TABLE 1. THE SELECTED FACTORS IN THE UNDERGROUND SPACE QUALITY EVALUATION OF GUANGZHOU.
Target layer Theme layer Factor layer
The quality evaluation of Guangzhou urban underground space resource (A) Engineering geological conditions (B1)
Topography (C1) Regional geological background (C2) Slope Geological disasters (C3) Karst and subsidence damage (C4) Seismic site classification (C5) Active faults and Fracture zone (C6) Hydro
geological conditions
(B2)
Groundwater type (C7) Groundwater corrosive (C8)
The distribution of surface water (C9)
Rock and soil conditions (B3)
Rock and soil type (C10) Depth of saturated sand (C11) Depth of soft soil (C12) Capability of excavated and supported (C13)
Guangzhou urban underground space resource was founded after some necessary post-processing, as follow.
Figure 3. The integrated diagram of the urban underground space resource in Guangzhou area.
According to the assessment results, the integrated diagram reflected the general trend of urban underground space resource in Guangzhou Area. Although there were some differences in detail, most of the distribution of the underground space in poor grade or worst grade was mainly along Pearl River, as well as surrounding three active faults. Excellent or good areas mainly locate in the north hills, central and southern plains.
6 CONCLUSIONS AND RECOMMENDATIONS
GIS has strong spatial analysis and mapping functions. The fuzzy comprehensive evaluation method based on GIS can be evaluated.
GIS has strong spatial analysis and mapping functions. The fuzzy comprehensive evaluation method based on GIS can be evaluated the geospatial attributes object scientifically and efficiently, with good prospects of development.
The realization steps and key technologies of GIS with fuzzy comprehensive evaluation based on vector unit method in this text. The integrated assessment of huge amount of data can be achieved through the calculating in attribute database.
REFERENCES
1. Wang H. and Zhu W-J. (2006). "GIS-based Investigation and Evaluation of Urban Underground Space Resources." Chinese Journal of Underground Space and Engineering .J. 2(8), 1308-1312.
2. Shi, B., Wang B-J. and Zhou G-Y. (2006). "GIS in Environmental Geology." Science Press. M. Beijing.
3. Forster, B. C. (1992). "Probability Maps-an Essential Output of GIS." Proceedings of Photogrammetric, Remote Sensing and GIS. J. Wuhan, 5 (11~14), 40~52.
4. Zadeh, L. A. (1965). "Fuzzy Sets." Information and Controls. M. 294~302.
5. Robinson, V. B. "Some Implications of Fuzzy Set Theory Applied to Geographic Databases.", Computer, Environment and Urban Systems .J. 12(1), 89~98.
6. Heuvelink, G. B. M. (1993). "Error Propagation in Quantitative Spatial Modeling." Application in GIS, ITC Publication. M. Netherlands.
7. Boroughp, A and McDonnell, R. A. (1998). "Principles of Geographical Information Systems." Oxford University Press. M., 231~240, New York.
8. Jiang, B. and Kainz, W. (1994). "Fuzzification as Basis for Fuzzy Spatial Analysis." Proceedings of Integration, Automation and Intelligence in Photogrammetric, Remote sensing and GIS. J., Wuhan, 10(18~20), 294~302.
9. Lowell, K. E. (1992). "On the Incorporation of Uncertainty into Spatial Data Systems." Proceedings of GIS / LIS, 104~113.
10. Yang, G-M., Yang, X-B. and Fu J-X. (2003). "Error Estimate of the Conversion from Vector Data to Raster Data in GIS." Journal of Guizhou University of Technology. J. 32 (4): 51-54.
11. Zheng, W-F. (2007). "Key Technology of Drawing Contour Based On Discrete Data in MAPGIS." GIS ERA.J., 22(6), 41-43.
12. Zheng, W-F., Zheng, Z-Y., and Zheng X-C. (2008). "Application of GIS in Civil Engineering." Proceedings of the 14th National Computer Application for Engineering Design Congress. C., 290-295.