2017 2nd International Conference on Computer Engineering, Information Science and Internet Technology (CII 2017) ISBN: 978-1-60595-504-9
An Algorithm for K-LVQ Abnormal Traffic
Classification Based on Information Entropy
QICHENG XU, WENPU GUO, LULU CHEN and HAO HE
ABSTRACT
Previous researches on abnormal traffic detection mainly focus on how to detect outliers. For some detection methods based on classification, most of the anomaly classification is simultaneous detection and detection, and most of the samples are normal traffic. On the one hand, the classification accuracy is not high, on the other hand, it is not conducive to identify the specific types of abnormal traffic. For this reason, a method of classifying and identifying abnormal traffic is proposed: K-LVQ classification algorithm based on information entropy. On the basis of quantifying the entropy of each attribute of abnormal flow, firstly clustering and locating the abnormal sample points, and then learning the vector quantization neural network (LVQ) method to determine the recognition. Make full use of K-Means efficient and LVQ accurate features. The simulation results and measured data show that the average accuracy of classification and recognition can reach more than 89%.
KEYWORDS
Network traffic, Information entropy, Anomaly detection, LVQ, Neural network.
INTRODUCTION
Network anomaly traffic classification is based on network anomaly flow detection, more accurate positioning of abnormal traffic, which is beneficial for network security managers to take more effective response measures. Especially in the face of increasingly complex and diverse network attacks, whether there has been unable to meet the needs of network security attacks only detect network, timely and accurately distinguish between types of attacks on the maintenance of network security is more and more important.
Network anomaly traffic classification is based on the different characteristics of network traffic data affected by different abnormal behavior. At present, the common malicious attacks include DoS (Denial of Service) attacks, DDoS (Distributed Denial of Service) attacks, port scans, worm attacks, etc. On the one hand, on the basis of the different levels of traffic aggregation, the [1] analysis of the space decomposition algorithm, grouping rules optimization algorithm of 4 kinds of high performance classification algorithm based on network packets that theoretically, packet classification problem in mathematical solution are higher in time or space complexity, but in the design of algorithms that can use the heuristic method, data structure, compression method and parallel processing methods to eliminate redundant rules, improve the classification accuracy and classification accuracy, based on the _________________________________________
network packet; proposed in literature [2] anomaly classification hierarchical clustering based on traffic network flow, through the establishment of a classification tree for traffic classification. On the other hand, traffic data has several different dimensions, and the impact of abnormal traffic on different dimensions is also different. The [3] studied sequence entropy flow in various dimensions, put forward by the flow of entropy can not only make full use of the different dimensions of the flow, but also can effectively reduce the false alarm rate by the correlation on the different dimensions. Considering that this paper deals with abnormal traffic data, this paper uses the data form of network packet to quantify the traffic attributes in different dimensions with traffic entropy, so as to facilitate the next step.
Although based on statistical features and real-time classification pattern recognition method based on [4] traffic can also be achieved, but due to technical limitations of the method itself, in recent years in machine learning based classification methods become the focus of academic research, especially the neural network classifier is used, use to get widely. According to whether the samples used to construct the traffic classification model need to be marked in advance, the flow classification methods of machine learning can be divided into unsupervised method, supervised method and semi supervised method. For supervised learning methods, Naive, Bayes, C5.0, SVM and LVQ are used in the literature [5, 6] respectively. The analysis showed that the advantages of this kind of method is: can make full use of the existing sample experience, control sample training, improve the accuracy of subjective factors; disadvantage is strong, training of excessive consumption of storage resources and time, and cannot identify the unknown exception types. The unsupervised learning method, K-Means literature [7, 8] and DBSCAN methods were used. The advantages of this kind of method is that they do not need to have too much knowledge of the sample classification, reduce human error; disadvantage is that the classification results need to sample lots of analysis is reliable, the classification accuracy is low. In order to make full use of the advantages of supervised and unsupervised methods, based on the information entropy and proposes a K-LVQ (K-Means-Learning Vector Quantization Network) method, K-Means and LVQ (Learning Vector Quantization Network) method combined with clustering to lower complexity, semi supervised methods were accurate classification of abnormal traffic classification and recognition. The margins to be used for your paper are as follows:
RELATED WORK
The [7] first proposed using K-Means algorithm to build a classification model, the network flow in the minimum Euclidean distance in a cluster, then the application type load analysis tool to determine the network flow, the real-time application traffic classification based on TCP, the detection rate reached 80%. The method has the problem of low classification accuracy.
The introduction of [9] concept and the density of the minimum spanning tree clustering algorithm to improve K-Means, only in the initial training data set, under the premise of not the number of clusters of a given cluster, improve the detection accuracy.
to determine the abnormal data, have good detection effect in large-scale data classification, but the effect is not obvious.
In conclusion, K-Means clustering method is efficient and feasible, but the accuracy is not high, the LVQ algorithm has powerful nonlinear processing ability, the dimension is not sensitive, the advantage of global optimal solution, but directly to all the data for multi classification algorithm has high time and space complexity problems by LVQ method. Therefore, this paper proposed an algorithm for K-LVQ traffic anomaly classification based on information entropy, the information entropy is used to quantify the flow data of different dimensions of unity, and on the basis of the first use of K-Means clustering algorithm to the training data set into several subsets of independent training, training process to reduce the total complexity, so as to improve the training speed, and then use LVQ methods to identify specific exception types. Only when the first cluster error or the new abnormal type occurs, the optimized one to many LVQ classification method is used to discriminate the abnormal type, which makes full use of the advantages of the two methods.
ENTROPY QUANTIZATION, K-MEANS CLUSTERING AND LVQ CLASSIFICATION
Traffic attribute entropy quantization
Information entropy is a concept used to measure the amount of information in information theory. The information entropy signifies the amount of information contained in it, and it is a description of system uncertainty. Document [12] points out that the use of information entropy to describe network traffic with different dimension features has sufficient accuracy guarantees. And because the data types of the network packets are different in different dimensions, it is easy to classify and process them by means of the quantitative unification of information entropy. The definition of information entropy, such as formula (1), X { ,n ii 1, 2, 3,…N}
indicates that in the measurement data, the attribute i occurs ni times and S
represents the total number of times an attribute occurs.
1 1
=- ( ) log 2( )
N N
i i
i
i i
n n
H S n
S S
(X) , (1)
A network pack has several different dimensions, such as source IP, destination IP, source port, destination port, and so on. The network packet can be described as
1 2
[ , , , ]
ij i i id
a a a a , and d is the dimension of the packet. In this paper, d=4 and
1 2
[ , , i]
L a a a represents continuous input packets in a certain time interval of T.
Take the source IP as an example, ni represents the number of non-homologous IP
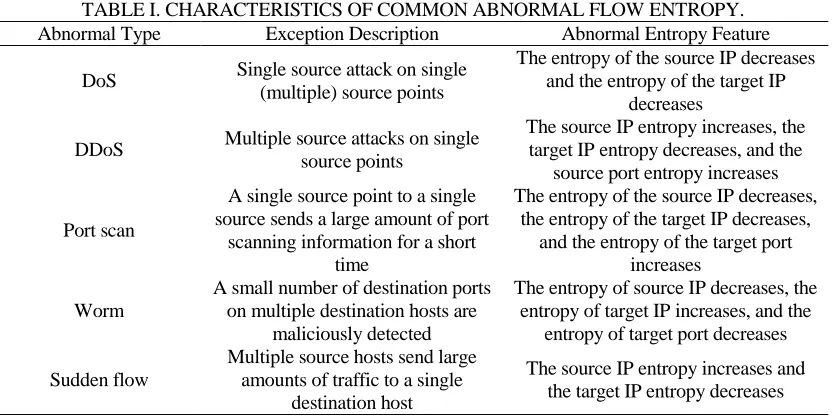
TABLE I. CHARACTERISTICS OF COMMON ABNORMAL FLOW ENTROPY. Abnormal Type Exception Description Abnormal Entropy Feature
DoS Single source attack on single (multiple) source points
The entropy of the source IP decreases and the entropy of the target IP
decreases
DDoS Multiple source attacks on single source points
The source IP entropy increases, the target IP entropy decreases, and the
source port entropy increases
Port scan
A single source point to a single source sends a large amount of port
scanning information for a short time
The entropy of the source IP decreases, the entropy of the target IP decreases,
and the entropy of the target port increases
Worm
A small number of destination ports on multiple destination hosts are
maliciously detected
The entropy of source IP decreases, the entropy of target IP increases, and the
entropy of target port decreases
Sudden flow
Multiple source hosts send large amounts of traffic to a single
destination host
The source IP entropy increases and the target IP entropy decreases
K-Means clustering algorithm
K-Means clustering algorithm is an unsupervised learning algorithm, its purpose is to divide the data for a subset of equivalence classes, number K and dimensional data points of the data set to generate M m m1, 2, mi mn and K-Means clustering
algorithm, M data sets will be divided into K C c ii, 1, 2, ,K group. Each partition represents a class i , and each class has a class center i . Euclidean
distance is used as the criterion of similarity and distance, and the distance squared and F of each point in the class to the cluster center J c( )i are calculated. The clustering objective makes the total distance squared and ( )J C minimum.
2 ( )
i i
i i i
m c
J c m (2)
1
( ) ( )
K
i i
J C J c (3)
K-Means clustering algorithm processing process is as follows:
Step 1 selects K objects from the N data objects as the initial clustering center; According to the nearest distance between the data objects and the centers of these clusters, Step 2 assigns them to the classes represented by their most similar clustering centers according to the nearest distance;
Step 3 calculates the mean of all objects in each class as the new clustering center of the class, calculates the sum of squares of the distances from all samples to the
cluster centers of their categories, that is, the J C( ) value;
LVQ classification thought
Learning vector quantization (LVQ) algorithm is a supervised learning algorithm proposed by Kohonen for pattern classification. It allows you to specify which class the input is assigned to. LVQ network structure consists of input layer and output layer. The input layer accepts input samples, and the output layer is the competition layer, which clusters the input samples. The two layers of neurons are fully interconnected. The basic steps of the LVQ algorithm are:
(1) The input vector is [ ,1 2, , ] T p
X x x x , and the weight vector of the input layer neuron j is every time a vectorX is input, and the nearest matching neuron is found in the output array, which is represented byiinX ;
(2) The category of X is known as r, and in the first stage, the category of neuron i is Ci, then
If rCi
( 1) ( ) ( )[ ( )]
i t i t i t
W W t XW (4)
If rCi
( 1) ( ) ( )[ ( )]
i t i t i t
W W t X W (5)
The ( )t is the learning step.
From the above LVQ algorithm, it can be seen that for each input vector, the LVQ algorithm only updates the weights of the optimal matching units, so there are some wasted neurons.
K-LVQ ALGORITHM
The basic idea of K-LVQ algorithm
From the point of view of classification, LVQ can be used directly to solve multi classification problems. But after extensive research, in-depth at present, learning vector quantization (LVQ) neural network algorithm is a supervised learning method using training competitive network layer of the network, it can be the input vector, the transfer function of hidden layer through competitive, classified according to the categories of objectives. The neural network is usually composed of two layers, the first layer is the competition layer and the second layer is the linear layer. The competition layer can learn to classify the input vectors, and the linear layer transforms the classified information from the competition layer into the class defined by the user.
Entropy based K-LVQ anomaly flow classification algorithm
According to the entropy quantization method of 2.1 traffic attributes, the entropy of 4 dimension attributes is calculated and normalized by the captured abnormal traffic data packets in i fixed time intervals T, and a 4 dimensional vector
1 2 3 4
( , , , )
i
T is obtained. 1 to 4 represent the source IP address, destination IP address, source port and destination port entropy respectively. The sample set of abnormal traffic within time t is S.
1 2
( i n) [ ]t
S T T T T n
T
, , , ,
The specific anomaly traffic classification algorithm is divided into training stage and detection stage.
The training steps are as follows:
Step 1: According to the training data set, the parameter K is determined and the central i of each cluster is determined. The K-Means algorithm is used to divide
several clusters into Clu i;
Step 2: Mix the normal traffic in an equal level in each cluster, and perform LVQ training to generate a LVQ discriminant function fi and mark the corresponding
exception type;
Step 3: Update and store the i, fi, and the corresponding exception type to call
for detection;
ABNORMAL FLOW CLASSIFICATION EXPERIMENT
Simulation experiment design
In the simulation experiment, the traffic data sample is divided into two parts, the normal traffic sample set and the attack traffic sample set. The normal traffic is obtained from the real network environment, and the attack traffic is the abnormal traffic, which is simulated by the network attack software in the experimental environment, so that the classification results can be verified. The main programming tool used is Matlab R2012b.
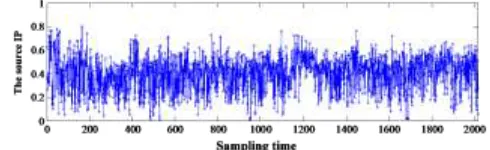
[image:6.612.176.421.623.698.2]First, from a university campus network core router flow WinPcap data capture tool acquisition a week package based on statistics, the time interval is T for 5 minutes, as the 1 sampling points, 60 x 24 x 7/5=2016 sampling points, the normal flow. Figure 1 shows the change of the entropy of the source IP obtained from the statistical sampling point at one week. It can be seen that the entropy is relatively stable near the range [0.2, 0.6]. 200 sampling points are selected as normal traffic samples.
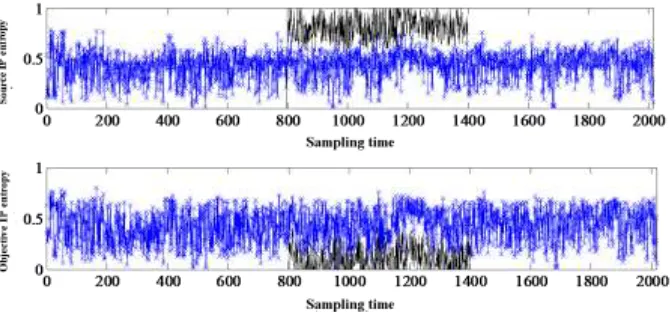
Figure 2. IP entropy changes before and after mixing DDoS attack traffic.
TABLE II. DISTRIBUTION OF SAMPLE POINTS IN DIFFERENT SIMULATION SAMPLES.
DoS DDoS Worm Port scan Sudden flow
Normal flow
Training set 1 0 0 0 0 0 500
Training set 2 100 100 200 200 0 0
Test set 1 100 130 170 140 0 0
Test set 2 90 150 120 80 0 0
Test set 3 180 160 80 120 0 0
Test set 4 140 90 120 180 0 0
Test set 5 0 0 0 0 100 0
In the experimental environment, we use SYNtester, Worm, Simulator, Protscan and other attack software to simulate DoS, DDoS, worm, port scanning and other attack traffic. The sampling interval T is 5 minutes, considered as 1 sampling points. Figure 2 is a mixed DDoS attack traffic in the normal flow of 600 consecutive sampling points in the source IP and destination IP entropy change, the blue line represents the normal flow of source / destination IP entropy, the black line represents the DDoS attack traffic source / destination IP entropy. It can be seen that the IP entropy of the source of DDoS attack flow is obviously higher, and the entropy of the target IP is obviously decreased, which is in line with the expected results.
To better verify the classification effect of the algorithm, each sampling moment is set with only one attack. After sampling and simulation, the final sample set is shown in Table II, and the number of units is the sampling point. The training set is 1 LVQ decision function training, the training set of 2 K-LVQ clustering and decision function training, abnormal classification test set 1-4 simulation test sets of 5 known types of simulation of unknown type anomaly classification.
Simulation experiment and result analysis
Experiments are carried out based on the 3.2 section classification algorithm. Firstly, each sample point entropy is quantized to obtain differentTi ( ,1 2, ,3 4), then training and testing are carried out in turn.
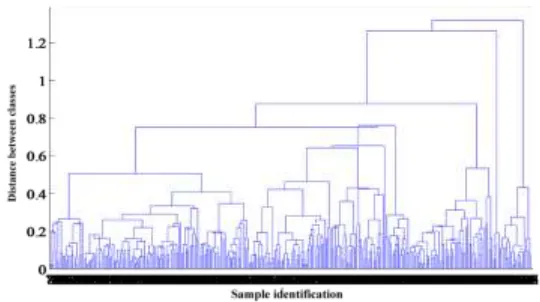
distinguish most of the sample points, and Figure 4 is the clustering result of different sample points when taking the 4 dimensional vector. The horizontal axis represents the mark of each sample point, and the vertical axis represents the distance between the different classes. The horizontal axis coordinates are overlapped due to the large number of samples. In actual training, you only need to take 4 nodes. At the same time, each kind of center is recorded. Each class is trained with LVQ of normal traffic samples to get 4 different decision functions
Test phase: first, the test set 1-4 is sequentially confused in each sample set, and then the K-LVQ of each sample point of sample set 1-4 is classified. The classification results for [2] index measure: 1) error rate: the total number of sample classification errors accounted for the proportion of the total number of samples, the accurate rate of 2): the total number of samples correctly classified into the total number of samples accounted for the proportion of 3), the total accuracy rate: the total number of samples of normal classification experimental sample of the total accounted for the proportion of.
[image:8.612.162.432.551.702.2]To accurately measure the effect on the classification of known anomalies, each sample set 50 classification tests, 50 times to get the average value of the classification results, the final weighted of each index results from 4 samples in the average weight for the proportion of the sample concentrated attack. Taking the misclassification rate of DoS attack classification index as an example, if the false positive rate of DoS attack in test set 1-4 is in turn, then the final average false positive rate is:
Figure 3. The effect of clustering on 3 dimension vectors in training set.
80 100 150 120 450a 450b 450c 450d
Finally, the experimental results shown in Table 3 are given. From the classification results, we can see that the worm attack is worse than other anomaly classification, which is related to the change characteristics of worm attack from outbreak to outbreak, and its characteristics are not obvious at the beginning. From the total accuracy, in the absence of unknown anomaly type, 4 kinds of known anomalies of the comprehensive classification effect is more satisfactory, the total accuracy of more than 95%.
Since the burst flow anomalies in the test set 5 are not trained in the training set, they belong to the unknown exception type. To test the classification effect of K-LVQ classification methods on unknown types of exceptions, the sample points in the test set 5 are classified, as shown in table 4. It can be seen that this method performs well on unknown anomalies.
Actual data experiment
[image:9.612.90.508.502.713.2]The measured data set is organized by CAIDA [12], Worm, DDoS, Attack 2007 and Backscatter-2008, which are three groups of data collected by Wiity in the backbone network with Telescope. Wiity Worm in 2004-3-20 continuous acquisition of 5 days of worm attack traffic; DDoS Attack 2007 Dataset is a 2007-08-05 1 hours of large-scale DDoS attacks; Backscatter-2008 is 2008-2-20 acquisition of DoS attack traffic. The three data sets are the backbone of the data; the data is too large, so the first part of each data set for a week, and 100 times the amount of data collection in simulation test data. Then by means of random sampling, are shown in Table 5 of the 3 test samples containing 3 kinds of abnormal sets, each of the 200 samples containing samples, simulation test data packet of each sample point contains about 100 times as much as the set. After entropy quantization, each test set is 150 normalized 4 dimensional vectors. Considering the complexity of the actual network traffic, direct classification test can better measure the performance of the algorithm on the basis of simulation training.
TABLE III. SIMULATION TEST SET 1-4 FINAL CLASSIFICATION RESULTS. False alarm rate Precision rate Total accuracy
DoS 5.0% 97.5%
95.1%
DDoS 3.0% 96.0%
Worm 6.5% 92.0%
Port scan 5.0% 96.7%
TABLE IV. SIMULATION TEST SET 5 CLASSIFICATION RESULTS. Unknown
exception DDoS False alarm rate Precision rate
Test set 5 75 5 6.3% 93.8%
TABLE V. SAMPLE POINTS DISTRIBUTION OF TEST SET WITH DIFFERENT MEASURED DATA.
Worm DDoS DoS
Test set a 80 100 120
Test set b 100 120 80
Figure 5. Entropy change of source IP of different abnormal data sets.
Figure 5 compares the entropy changes of the sampled data sets, source IP, and 3 samples containing 200 single attack type samples. It can be seen that the IP entropy of the 3 abnormal DDoS sources is always higher, the difference is obvious, the average entropy value of DoS and the worm source IP is lower, and it conforms to the characteristics of the 3 anomalies.
Experimental results and analysis of measured data
[image:10.612.95.503.521.569.2]The basic experimental method is in agreement with the simulation experiment. The metrics that measure the effect of classification are invariant, and 50 classification experiments are carried out on each test set, taking weighted average. The classification results of the measured data in Table VI show that the overall classification effect is decreased compared with the simulation experiment, and the classification effect of worm attack is decreased more. The main reasons are as follows: first, there are some differences between the whole measured data set and the simulation data set, and the test is carried out without training. Two is the existence of worm attacks, and sampling has a greater impact on worm attacks. But as a whole, it basically achieves classification effect.
TABLE VI. CLASSIFICATION RESULTS OF MEASURED DATA.
False alarm rate Precision rate Total accuracy
DoS 8.0% 91.3%
89.6%
DDoS 6.3% 94.2%
Worm 12.7% 87.5%
TABLE VII. CLASSIFICATION PERFORMANCE OF THREE ALGORITHMS.
False alarm rate Precision rate Classification time consuming/s
K-LVQ 6.8% 92.3% 8.6
SVM 13.2% 86.7% 10.4
K-Means 19.3% 78.2% 5.2
[image:10.612.91.504.594.651.2]error rate and accuracy rate of 50 times the arithmetic average, the total error rate and accuracy rate of each abnormal weighted average weight for the type of exception in the sample proportion, classification time take the arithmetic mean value. Compare table VII, three algorithms each index, K-LVQ algorithm time-consuming although higher than K-Means, but accuracy and false positive rate is much better than the latter, SVM algorithm time-consuming, classification effect is not ideal enough. By comparison, the K-LVQ algorithm combines the advantages of the other two in terms of classification results, and is a tradeoff between the two in terms of time consuming.
CONCLUSION
Based on the analysis of the advantages and disadvantages of the K-Means algorithm and the LVQ classification algorithm, combined with the information entropy, this paper proposes an entropy based K-LVQ anomaly flow classification algorithm. Through the fast clustering of K-Means clustering method, the complexity of subsequent LVQ classification is reduced. Combined with the simulation and experimental data, it is proved that the method has good classification and recognition performance for abnormal traffic.
REFERENCES
1. Yaxuan Qi, Li Jun. High performance network packet classification theory and algorithms [J]. Journal of computer, 2013, 36 (2): 408-419.
2. Xu Qian Cheng, Dong Nian. Network traffic anomaly classification hierarchical clustering algorithm [J]. Based on Computer Engineering, 2012, 38 (23): 131-136.
3. Nychis G, Sekar V, Andersen D G, et a1.An empirical evaluation of entropy-based traffic anomaly detection[C]// Proc of the 8th ACM SIGCOMM Conf on Int Measurement (IMC). New York: ACM, 2008:151-156.
4. Bai Jun, Xia Jingbo, Wu Jixiang, et al. Review of real-time network traffic classification [J]. Computer science, 2013, 40 (9): 8-14.
5. Wei Li, Abdin K, Dann R, et a1. Approaching real-time network traffic classification[R].Technical Report RR-06-12. Department of Computer Science, Queen Mary, University of London, Decemher 2006.
6. Bujlow T, Riaz T, Pedersen J M.A method for classification of network traffic based on C5.0 Machine Learning Algorithm[C]// 2012 International Conference on Computing, Networking and Communications(ICNC). IEEE, 2012:237-241.
7. Bernaille L, Teixeira R, Akodkenou I, et al. Traffic classification on the fly [J].ACM Special Interest Group on Data Communication (SIGCOMM) Computer Communication Review, 2006, 36(2):361-369.
8. Zhang Jian, Qian Jing, Shou Guo Guo, et al. Network traffic identification based on online clustering [J]. Journal of Beijing University of Posts and Telecommunications, 2011, 34 (1): 103-106.
9. Wang Qian, Liu Sheng Hui. Research on Application of improved K-means algorithm in intrusion detection [J]. Computer engineering and application, 2014, 2 (13): 1-5.
10. Fei Huan, Li Guanghui. WSN anomaly detection algorithm based on K-means clustering [J]. Computer Engineering, 2015, 41 (7): 124-128.
11. Zheng Liming, Zou Peng, Han Weihong, et al. Research on anomaly detection of backbone network traffic based on multidimensional entropy classification [J]. Computer research and development, 2012, 49 (9): 1972-1981.