Engineering Study Of Bhuj Earthquake And
Mitigation Measures
Kartik Sunder1, Aayush Bhardwaj2, Saumya Keswani3, Divesh Kumar Jain4, Dr. Porchelvan5
1, 2, 3, 4
School of Chemical and Civil Engineering, VIT University
5
Senior Professor,School of Chemical and Civil Engineering, VIT University
Abstract: Natural calamities are beyond the control of human beings and cause huge loss of life and property. Earthquake is one such natural calamity that is very unpredictable. Thus, it is essential to study the pattern of earthquake to develop proper mitigation techniques. Comparing the statistics of a particular earthquake prone area can provide an estimate of damage that can be caused and thereby provide guidance in the implementation of the mitigation measures.
Keywords: earthquake, Bhuj, statistical, geology, mitigation
I. INTRODUCTION
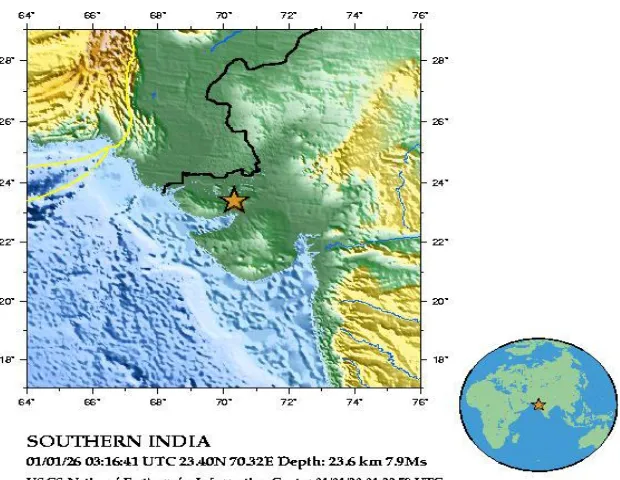
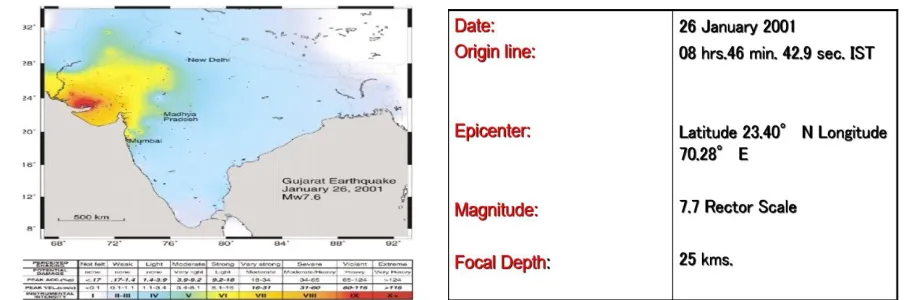
A powerful earthquake rocked the western state of Gujarat in India at 08:46 hours (Indian Standard Time) on the 26th January 2001. The earthquake was estimated by USGS to have a Moment Magnitude of 7.9. The epicentre was reported to be near a major town called Bhuj in the Kachchh region of Gujarat. . The state of Gujarat is highlighted on the political map of India. Initial reports in the media indicated extensive damage to the civil engineering structures followed by reports on loss of life on a massive scale. This region is known
to be seismically active and has seen a major earthquake in 1819 which had a similar magnitude to the current earthquake. That earthquake occurred along the Allah Bund fault and resulted in a major uplift of the ground surface. Ground movements of up to 9m vertically and 3.5m horizontally were reported by Bilham (1998) to have occurred due to that earthquake. More recently a major earthquake of Moment Magnitude 7 occurred with its epicentre close to Anjar in 1956.
[image:2.612.144.454.474.714.2]The earthquake occurred in the early hours of Friday, 26th January 2001 at 08:46 hours Indian Standard Time (IST). This was the Republic day in India, which is a national holiday. However, schools were open due to the Republic day celebrations and several children were injured due to the collapse of school buildings. The extent of earthquake damage was immense. The large magnitude of the earthquake combined with the poor construction quality contributed to large scale damage to the building stock and a high number of casualties. In Table 1 the outline information that was available on the extent of damage is collated.
II. BHUJ EARTHQUAKEDAMAGEASSESSMENT A. What is an Earthquake?
1) Momentary shaking of the ground or vibration or oscillation of the ground caused by the slip or by volcanic or magnetic activity or other sudden stress changes in the interior of the earth is called Earthquake.
2) Earthquakes constitute one of the worst natural hazards which often turn into disaster casing widespread destruction and loss to human life.
B. Causes of an Earthquake
1) Earthquakes are caused by sudden release of energy in rocks. Plates in the form of rocks are moving very slowly and earthquake occurs when moving plates grind and scrape against each other.
2) The point at which an earthquake originates is the focus or hypocenter and the point on the earth’s surface; directly above this is epicenter.
3) The study of earthquake is called seismology.
C. Bhuj Earthquake Damage Statistics
The state covers an area of 196,024 sq km (The capital is Gandhinagar, on the outskirts of Ahmedabad, the former capital and largest city in the state.) Bhuj town and the village Bhachau, 60 km east of Bhuj, were the worst affected and many other areas of Gujarat including its state headquarters Ahmedabad were badly affected.
The following points collected show how badly the state of Gujarat was affected from this tragic calamity: 4) There were more than 20,000 deaths and 167,000 people injured.
5) Four districts of Gujarat lay in ruin and altogether, 21 districts were affected.
6) Around 300,000 families and at least 3 million children aged 14 and under were affected. 7) Around 600,000 people were left homeless.
8) In the city of Bhuj, more than 3,000 inhabitants of the city lost their lives; the main hospital was crushed and close to 90% of the buildings was destroyed.
9) There was significant damage to infrastructure with facilities such as hospitals, schools, electric power and water systems, bridges and roads damaged or destroyed.
10)The Bhuj earthquake has many interesting geotechnical aspects. Even though the strong motion data is almost non-existent, the ground accelerations in Ahmedabad city seem to be large in relation to the distance from the epicentre of the earthquake. There is a need to understand the existence of any basin effects due to the topography and geology of this region. This may be important in re-evaluating the seismic zonation of the areas surrounding Ahmedabad and in establishing recommended peak ground.
III. DAMAGEANALYSISTHROUGHCASUALTYDATAAND STATISTICALMETHODS
There are four major factors which are believed to be affecting the relation between the damage caused by the Earthquake:
A. Intensity
[image:3.612.89.545.570.720.2]Whenever we talk about the impact of an earthquake, it is important that the impact is directly related to the intensity with which it strikes. The intensity is a factor which is independent but becomes a dependent variable for every other factor.
B. Death rates
One of the major characteristics, which also acts like a measure to quantify the effect of earthquake. Death rates is a very important aspect in the analysis of any earthquake when it comes to the casualty data.
C. Seismic Movement and Land Type
Whenever an Earthquake signal is observed at a particular section of the Earth, each region is to be reacted differently. There are some regions which is very much earthquake prone. Earthquake prone is a term given to the land area which includes a lot of seismic movement in its crust and thus makes it more vulnerable to natural calamity.
D. Initiation of Statistical Analysis
1) Consideration of Casualty data, which includes the Seismic Intensity at various regions and Death Rate range.
2) Casualty data is a data interpretation, which verifies the intensity cumulating it with the number of affected regions by it and in the end comparing it with the death rate range.
3) The data was taken from Gujarat State Disaster Management Authority.
4) Below we have shown an Intensity Wise Distribution in which we keep the Intensity as the Independent Variable and classify it with respect to the Number of Districts, which are affected by it and the Death Rate range by each Intensity level.
5) All the Intensities are measured in MSK Scale.
6) After that,moving forward in the casualty data, we shall use the Death Rates as an independent factor and classify it with respect to the number of districts, which were having such Death rates.
7) This shall give a mutual parameter by which we can compare Death rate and Number of districts.
Table 1. Shows the Death Rate distribution table DISTRIBUTION OF DEATH RATES ( per 10000)
Death Rates ( per 10000) Number of districts
0.01-0.1 10
0.1-1 42
1-10 14
10-100 4
100-1000 3
INTENSITY WISE
DISTRIBUTION
INTENSITY(MSK Scale) No. Of Districts DEATH RATES RANGE(per
10000)
7 59 0.06-3.43
8 1 11.36
7 & 8 7 0.23-10.26
8 & 9 1 57.94
9 & 10 1 419.84
7 , 8 & 9 1 2.56
Table 2.Shows the Intensity wise distribution table
E. The Introduction of Statistical Methods
Moving forward with the casualty data, which we have collected, it is time to put on the statistical methods on the data for evaluation.
In statistical methods, we shall be looking forward to 3 major statistical methods: 1) Using Correlation
2) Using Chi-Square test 3) Using Difference of values
F. Correlation test
1) Even though death rates are expected to be higher for higher seismic intensity, it is of interest to see how strong such a correlation may be.
2) Method used for correlation: - Bootstrapping
3) Casualty data set gives the correlation coefficient as 0.865 between death rates (per 10,000 populations) and seismic intensity (numerical values are considered as 7, 8, and 9 for intensity VII, VIII and IX, respectively).
4) The correlation coefficient ranges from 0.50 to 0.88, with an average value of 0.865 and standard deviation of 0.03, indicating a rather strong correlation between shaking intensity and death rates.
Fig3.The chart plotted in Microsoft Excel and verified in SPSS shows the correlation between the Death Rate and Intensity and the value of correlation coefficient as 0,865 is justified above.
G. Distribution Analysis using Chi-Square test
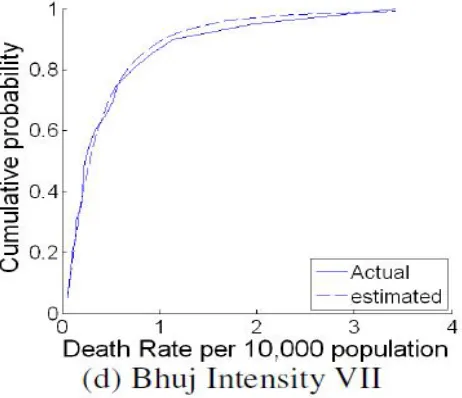
1) Intensity VII from Bhuj earthquake are found to follow log-normal distribution with all the four cases passing 5% significance level chi-square test.
2) The formula above is the formula used as a reference for the Chi-Square Test.
Table 3.shows the Chi-Square Distribution table
7,8,9&10 1 111.9
Event Seismic Intensit y Chi-Square Value (Observed) Chi-Square value (5% significance level) Sample space Distribution Parameters
Psi Beta
H. Difference of Values
1) Bhuj earthquake casualty data is not large enough for intensities other than VII. 2) The Mean Death Rate (per ten thousand population) is 0.505.
3) The Median Death Rate from Chi-square Distribution is 0.23 4) The Standard Deviation being 0.67.
5) Mean death rates are consistently higher than the median death rates due to skewed nature of lognormal distribution of the death rate data.
[image:6.612.169.400.215.414.2]6) death rates are significantly lower in case of Bhuj earthquake. For intensity VII and 90% confidence level, Bhuj earthquake had about 1.05 deaths per 10,000 populations.
Fig 4. Shows the graph shows the evaluation of the distribution analysis through SPSS
I. The Statistical Model
Based on the above observations, an empirical relationship between death rates per 10,000 population (DR) and corresponding seismic intensity (I) is proposed as:
Log(DR) = A0 + A1(I)
Where, A0 and A1 are the regression parameters and ‘I’ is the numerical value of seismic intensity.
It is worth mentioning here that this relationship is based on the assumption of constant geometric increment of death rates with intensity. A1 is the measure of jump (alpha) in the death rate between two
intensity levels while A0 represents the vulnerability associated with the affected region and seismic event. The proposed model
does not use any other parameter except seismic intensity. Therefore, it is expected that the regression parameters (A0 and A1) will
account for the remaining parameters
including earthquake timing, geographical location, building typologies, quality of rescue and relief available, and other factors which may affect the loss of life during earthquakes.
This vulnerability parameter (A0) can be mathematically expressed in terms of the population out of which 1 death is expected for
hypothetical zero seismic intensity event.
IV. GEOLOGYOFTHEREGION A. Kachchh Region
Fig 5. Geological map of Kachchh and Saurastra regions
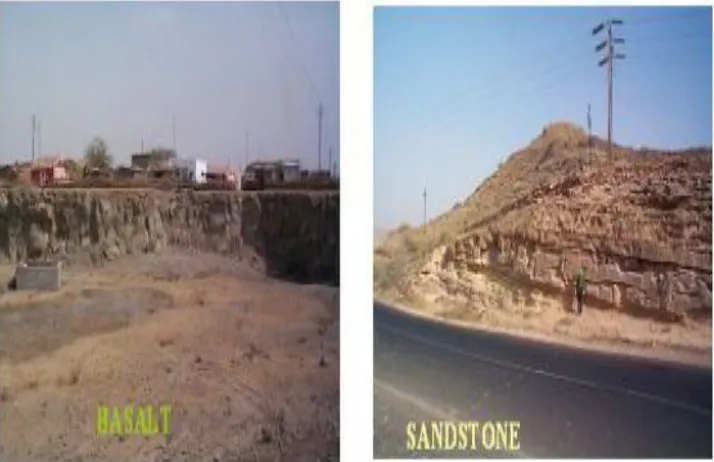
From Figure 5 we can see that near the town of Bhuj (closest town to the epicenter) there are Sandstones and Shales formed in the Late Cretaceous to Jurassic periods. The Shales and Sandstones are present at shallow depths in this area (typically 2m below ground surface). The sandstones are widely used in the construction of low-rise buildings.
In Figure 6 the presence of the Sandstone formations is confirmed in a highway cutting. South of Bhuj there are deposits of Marl and Limestones. As we move further south towards the Gulf of Kachchh we find Basalts. In Figure 2 the presence of the Igneous Basalt is confirmed at the site of an excavation. However, in the coastal regions such as Kandla port, there are recently deposited loose sands. The Kachchh region is known to have folded with the presence of anticline formations along the Katrol hills about 10km south of Bhuj city.
In Figure 5 we see the great extent of Marls and Limestones in the Saurastra region with the coastal regions showing some Basalt formations. The geology of this region suggests that this region is less susceptible to earthquake risks.
[image:7.612.130.487.480.711.2]B. Geology of Ahmedabad
Fig7. Geological map of the area surrounding Ahmedabad
The epicenter of the earthquake was about 160 miles west of Ahmedabad, the capital of Gujarat State. Despite the large distance from the epicenter, there was extensive damage to the buildings in Ahmedabad.
In Figure 7 the geological map of the area surrounding Ahmedabad is presented, showing the presence of alluvium sands (Quaternary and Tertiary sediments). This region forms the flood plains of the River Sabarmati and hence the presence of alluvial sands here is to be expected. These sediments are known to extend to a depth of several kilometers.
There are also granite formations to the east and basalt formations to the southeast of Ahmedabad as seen in Figure 3. In general, the soil conditions within the city of Ahmedabad did not appear to be problematic under earthquake loading, being neither susceptible to liquefaction nor seismic amplification.
V. TECTONICSETTING
The Indian subcontinent is moving northward at a rate of 53 to 63 mm/year colliding with the Asian plate which is also moving northwards but at only half the rate.
This relative plate velocity gives rise to an intercontinental collision forming the Himalayan Mountains and creating eastward and westward movement of large crustal blocks away from the Himalayan region. The rate of contraction across the Himalayan Frontal Fault System and the western boundary of the plate is about 20 to 25 mm/year.
[image:8.612.133.487.91.288.2]The compression resulted in heavy faulting and folding in the Kachchh region as seen in Figure 4. The 2001 earthquake happened less than 400 km from the Owens fracture zone in the Arabian sea, Makransubduction zone in Pakistan and the Chaman fault running parallel to the Indo-Pakistan border.
VI. FAULTSINTHEKACHCHHREGION
There are three main thrust faults in the Kachchh region namely the Allah Bund fault, Kachchh Mainland Fault (KMF) and the Katrol Hill Fault. These are presented in Figure 5.
The 2001 earthquake is known to have occurred on the Kachchh Mainland Fault.
The location of the epicenter of the current earthquake is marked on the Kachchh Mainland fault. This fault becomes discontinuous to the east. There are other minor faults between the KMF and Katrol Hill faults. The 1819 earthquake with a similar magnitude of 7.9 to the current earthquake occurred on the Allah Bund Fault. The magnitude 7 earthquake of 1956 near Anjar occurred on the Katrol Hill Fault.
Fig9. The faults in the Kachchh Region
VII.MITIGATIONMEASURES
A. Seismic Retrofitting
Seismic retrofitting is the modification of existing structures to make them more resistant to seismic activity, ground motion, or soil failure due to earthquakes.
Retrofitting is a technique by which strength, ductility and stiffness of building is enhanced and final goal of the technique is enhancement of performance level of structure.
Jacketing of column is one of the member level retrofit techniques. It improves the axial, shear strength of column in uniform, and distributed way. To improve lateral load capacity of building, jacketing of weak columns are generally carried out in form of reinforced concrete jackets or steel jackets. This technique can be applied to either particular members of a structure and to the entire structure.
This is known as local and global retrofitting respectively.
Fig10. Practical application of the mitigation measure
1) Shortcomings
a) Lack of standard code for the application of this technique.
b) Effectiveness of the method varies depending upon parameters as building type, condition of material.
B. Prediction Methods
Timely prediction of an earthquake can enable the authorities to take up precautions and rehabilitate the people to protect any damage to life and property. The prediction of earthquake is difficult as they occur due to sudden release of energy of from the earth’s crust. But these usually occur along existing geological fault zone. Thus as civil engineers we can consider this and design the structure accordingly.
Bhuj: Seismologists have discovered a hidden fault line in northern Kutch, which is believed to have triggered the devastating Bhuj earthquake in 2001. Studies had led to several other important findings, including an intrusive high velocity body across the entire Kutch region, which might be a magmatic intrusion formed about 65 million years ago. But earthquakes did not occur everywhere and were triggered when stress accumulated at some places. The high velocity body found beneath the Kutch region caused an accumulation of stress, leading to the Bhuj earthquake. This study report is now a very useful resource for further design of buildings in such regions.
C. Base Isolation
A base isolated structure is supported by a series of bearing pads which are placed between the building and the building’s foundation. Acting like shock absorbers in a car, these systems allow the building to be decoupled from the shaking of the ground and the shocks are absorbed thereby reducing the effect to a large extend.
By contrast, even though it too is displacing, the base-isolated building retains its original, rectangular shape. It is the lead-rubber bearings supporting the building that are deformed. The base-isolated building itself escapes the deformation and damage–which implies that the inertial forces acting on the base-isolated building have been reduced.
This technique is put to use in one of the hospitals in Gujarat recently and can be used for other tall and heavy structures.
D. Damping Devices
[image:11.612.185.381.211.332.2]Damping devices are usually installed as part of bracing systems. This arrangement provides the column with additional support. Most earthquake ground motion is in a horizontal direction; so, it is a building’s columns which normally undergo the most displacement relative to the motion of the ground.
Fig 12. Shows the concept of Damping Devices
The best example of this is Taipei 101 whose design incorporates a tuned mass damper that uses building motion to push and pull dashpots, or giant shock absorber, to convert motion to heat by forcing fluid mass built up from stacked steel plates to form a sphere visible to building visitors.
This can be implemented in the new construction designs of tall structures to dampen the vibrations of the earthquake.
VIII.CONCLUSION
For pre-earthquake preparedness and immediate post-earthquake management, it is useful to estimate the expected number of casualties in a given village, town or region. In today’s world, construction in most parts of India has huge variation in technique and vary with respect to the regulations of the code. Hence, for casualty estimation in such countries, empirical approach, based on past earthquakes, may provide a much better option as compared to analytical and semi-empirical methods. In this paper, with the help of the Casualty data related to Bhuj (2001) Earthquake, we have used the statistical knowledge to evaluate the condition and come up with a statistical model which includes parameters like land type and seismic movement also into the model. Since the data shows a huge value of correlation, we used the test to get the model which gave us the vulnerability factor. It is observed that in every 1 increase of intensity, we see an increase of 12 in death rate for Bhuj earthquakes. Through this geometric increment and the data, we observed, we got an assumed value of the parameters of the empirical model. Expected values of A0 -8.31 while for A1
1.13. These parameters are expected to depend mainly upon construction typologies, time of the day, seismic event, and geographical location. Further, it is noticed that the highly vulnerable building stock (higher A0) shall reflect lower geometric increment (smaller A1) due to saturation of death rates in higher intensities. It will be worthwhile to carry out similar studies with casualty data from other earthquakes as well to validate the results of this study.
IX. ACKNOWLEDGMENT
This research was supported by VIT University, Vellore, India. We thank our professors from School of Civil and Chemical Engineering (SCALE) who provided insight and expertise that greatly assisted the research, although they may not agree with all of the interpretations/conclusions of this paper.
We thank Dr. Porchelvan for assistance and for comments that greatly improved the manuscript.
REFERENCES
[1] http://nidm.gov.in/easindia2014/err/pdf/earthquake/Prev_mitigation_measures.pdf [2] http://esatjournals.net/ijret/2014v03/i06/IJRET20140306093.pdf
[3] http://www.thehindu.com/2003/07/26/stories/2003072603321300.htm [4] https://theconstructor.org/earthquake/earthquake-resistant-techniques/5607/ [5] https://en.wikipedia.org/wiki/earthquakes
[6] http://www.hospitalmanagement.net/projects/bhuji/
[7] http://global.ctbuh.org/resources/papers/download/1650-structural-design-of-taipei-101-the-worlds-tallest-building.pdf [8] field report by EEFIT , University of Cambridge , Institute of Structural Engineers
[9] Agrawal P N 1991 Engineering Seismology (New Delhi:Oxford & IBH Publishing Co Pvt Ltd)
[10] Anon 2001b A brief note on Bhuj earthquake sequence and damages to earth dams; Govt. of Gujarat; Narmada, Water Resources & Water Supply Dept., Vadodara, India (unpublished)
[11] Intensity Based Casualty Models: Case Study Of Bhuj and Latur Earthquake in India, Indian Institute of Technology Gandhinagar
[12] Mogi 1985 Earthquake Prediction (Tokyo: Academic Press) Papazachos B C 1971 Aftershock activity and aftershock risk in the area of Greece; Ann. Geo_s (Rome) 24 439-456