M E T H O D
Open Access
Resolving complex structural genomic
rearrangements using a randomized
approach
Xuefang Zhao
1, Sarah B. Emery
2, Bridget Myers
2, Jeffrey M. Kidd
1,2and Ryan E. Mills
1,2*Abstract
Complex chromosomal rearrangements are structural genomic alterations involving multiple instances of deletions, duplications, inversions, or translocations that co-occur either on the same chromosome or represent different overlapping events on homologous chromosomes. We present SVelter, an algorithm that identifies regions of the genome suspected to harbor a complex event and then resolves the structure by iteratively rearranging the local genome structure, in a randomized fashion, with each structure scored against characteristics of the observed sequencing data. SVelter is able to accurately reconstruct complex chromosomal rearrangements when compared to well-characterized genomes that have been deeply sequenced with both short and long reads.
Keywords:Structural variation (SV), Complex structural rearrangements, Sequence analysis, Human, Copy number variant (CNV)
Background
Structural variation (SV), defined as chromosomal rear-rangements resulting from the removal, insertion, or re-arrangement of genomic regions, are natural sources of genetic variation [1–3] that have also been implicated in numerous human diseases [4–6]. There have been ex-tensive studies to discover these genomic aberrations from the whole genomes of humans and other species and numerous algorithms have been developed to accur-ately identify their prevalence [7–11]. These approaches have primarily focused on simple copy number variants (CNVs; deletions, duplications) or copy neutral (inver-sions) rearrangements defined by at most two chromo-somal breakpoints (BPs) and work by identifying and clustering various signals of discordant alignments from paired-end next generation sequencing data [12]. Recent algorithms have begun to integrate signals across mul-tiple features to increase sensitivity [9, 11, 13] and these have been successful in precisely identifying various types of SVs. Knowledge of the underlying structure of
the rearrangement is still required, however, in order to properly model these aberrant signals to the correct type of structural variant. For example, clusters of read pairs (RPs) with insert sizes (ISs) larger than expected are typ-ically representative of deleted sequence since this obser-vation is consistent with how the reads would map in the presence of such an event.
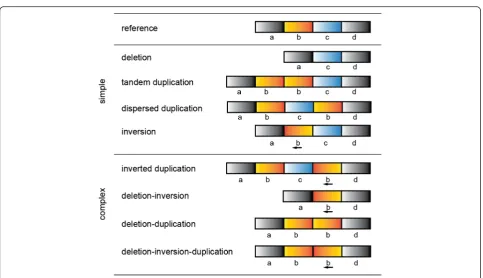
While these simple rearrangements are common in the genome, there are additional rearrangements that, while rarer, are far more convoluted. These complex SVs (CSVs) are typically represented by three or more BPs and can arise from a variety of mechanisms including fork stalling and template switching (FoSTeS) and microhomology-mediated break-induced replication (MMBIR) (Fig. 1, reviewed in [14]). Although fairly com-mon in cancers, their prevalence in germline genomes is gradually becoming more apparent as is their potential role in the pathogenesis of other disease [4, 5, 15]. The complex nature of these events have made them challen-ging to accurately detect and catalog and many CSVs have been either neglected or misinterpreted by current techniques due to the complexity of the signals shown by the sequencing data. This is primarily due to the limita-tions of presupposing the types of SVs being considered, as oftentimes the signals from one event are clustered * Correspondence:[email protected]
1Department of Computational Medicine & Bioinformatics, University of Michigan, Ann Arbor, MI 48109, USA
2Department of Human Genetics, University of Michigan, Ann Arbor, MI 48109, USA
© 2016 The Author(s).Open AccessThis article is distributed under the terms of the Creative Commons Attribution 4.0 International License (http://creativecommons.org/licenses/by/4.0/), which permits unrestricted use, distribution, and reproduction in any medium, provided you give appropriate credit to the original author(s) and the source, provide a link to the Creative Commons license, and indicate if changes were made. The Creative Commons Public Domain Dedication waiver (http://creativecommons.org/publicdomain/zero/1.0/) applies to the data made available in this article, unless otherwise stated. Zhaoet al. Genome Biology (2016) 17:126
independently from those of another and can lead to contradictory or sometimes even opposing predictions to what is actually present. Under such circumstances, trad-itional prediction models lose their ability to discriminate between signals and therefore new computational strat-egies are required to overcome these challenges. Previous endeavors have been made to reconstruct somatic variants in cancer genomes both spatially [16, 17] and temporally [18], but require an unaltered“matched”germline genome as an anchor for comparison. Studies into CSVs in the germline itself to date have thus been more limited, though there has been some early work that has profiled the existence of some of the more common types of CSVs including inverted-duplications and deletion-inversions [19].
Here, we present a novel approach, SVelter, to accur-ately resolve complex structural genomic rearrange-ments in whole genomes. Unlike previous “bottom up” strategies that search for deviant signals to infer structural changes, our “top down” approach works by virtually re-arranging segments of the genomes in a randomized fash-ion and attempting to minimize such aberratfash-ions relative to the observed characteristics of the sequence data. In this manner, SVelter is able to interrogate many different types of rearrangements, including multi-deletion and duplication-inversion-deletion events as well as distinct overlapping variants on homologous chromosomes. The
framework is provided as a publicly available software package that is available online (https://github.com/mills-lab/svelter).
Results
Overview of SVelter
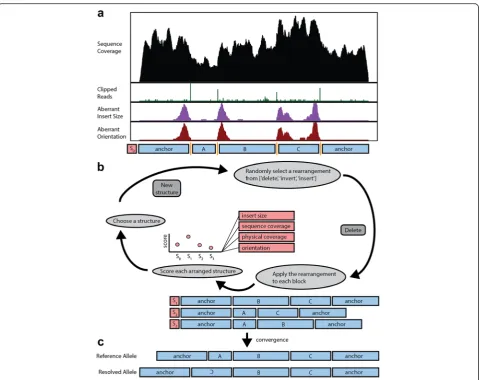
Our approach predicts the underlying structure of a gen-omic region through a two-step process. SVelter first identifies and clusters BPs defined by aberrant groups of reads that are linked across potentially related structural events. It then searches through candidate rearrange-ments using a randomized iterative process by which rearranged structures are randomly proposed and scored by statistical models of expected sequence characteristics (Fig. 2; see “Methods”). In this fashion, it resembles a Gibbs sampling approach as has been previously utilized for motif finding [20] and haplotype reconstruction using single nucleotide polymorphisms (SNPs) [21], among other applications.
[image:2.595.57.541.82.360.2]quality. SVelter then searches for and integrates poten-tial SV signals from RPs with aberrant IS, orientation, and/or alignment (soft-clipping). Pairs of BPs are assigned simultaneously and BP pairs that intersect with each other are further connected to form BP clusters. For each cluster containingnBPs, then-1 genomic seg-ments defined by adjacent BPs are then rearranged in a randomized iterative process whereby a simple SV (dele-tion, inser(dele-tion, inversion) is randomly proposed and ap-plied to all possible segments to assess the viability of each putative change. The initial structure and each sub-sequent rearranged structure are then scored by examin-ing the impact of each change on various features of the sequence reads in the region, including IS distribution, sequence coverage, physical coverage, and the relative orientation of the reads. A new structure is then chosen for the next iteration using a probability distribution
generated from the structure scores. This continues until the algorithm converges on a final, stable set of rear-rangements or a maximum number of iterations is reached.
An important feature of SVelter is that it simultan-eously constructs and iterates over two structures, con-sistent with the zygosity of the human genome. This allows for the proper linking of BP segments on the cor-rect haplotypes, which is crucial for the proper reso-lution of overlapping structural changes that can often confuse or mislead other approaches. Individual breaks in the genome can then be properly linked and segre-gated, aiding in downstream genotyping across multiple individual sequences.
The randomized aspect of this approach leads to add-itional computation cost relative to other SV detection algorithms. We have addressed this by implementing a Fig. 2Overview of computational strategy for identifying SV in whole genome sequences.aSVelter first scans the genome and identifies clusters of aberrant read characteristics. These are used to create a putative set of BP positions.bThe segments between BPs are then iteratively rearranged and scored against null models of sequence expectations.cThe final converged structure is reported as the predicted structural rearrangement for the region
[image:3.595.59.539.85.465.2]number of optimizations to increase the overall effi-ciency of SVelter. First, we limit the number of clustered BPs during the initial BP-linking step in order to manage the number of random combinations at the next step. For regions with potentially higher numbers of linked BPs, we form subgroups based on physical distance be-tween adjacent BPs that are later combined. Second, we set an upper and lower bound on the potential copy number (CN) of each segment between BPs using local RD information and only allow structures containing
CN-1toCN + 1blocks for downstream analysis. This sults in a total processing time for SVelter on a re-sequenced human genome with 50X coverage of under 8 h when run in parallel on a high-performance comput-ing cluster made up of Dell C6100 machines uscomput-ing 24 cores consisting of 2.67 GHz Intel Xeon X5650 proces-sors, each with an allocated 8 GB of memory.
Another limitation due to the stochastic nature of this approach is that SVelter by default is primarily heuristic rather than rigorous. Thus, it is not only non-deterministic but can neither guarantee the optimality of its converged structures nor that every possible solution/structure was visited. A brute force method that interrogates every po-tential structure would address these issues but would be computationally prohibitive, especially for more complex rearrangements with a larger number of BPs and thus pos-sible structures that would need to be permutated. We have attempted to balance SVelter in this regard by imple-menting a two-pass system where, after converging on a stable rearrangement for 100 continuous iterations, we set this structure aside and restart the random iterations for another 100 iterations, at which point the highest scoring structure overall is chosen. We also provide a determinis-tic option that is non-random and uses hill climbing to in-crementally choose the best scoring structure, though we note that this will likely result in suboptimal results as the converged structure could represent a local rather than global minimum deviation in score from the null models.
Performance evaluation
We compared SVelter to four SV detection algorithms: Delly [11], Lumpy [9], Pindel [8], and ERDS [23]. Both Delly and Lumpy have integrated IS and split read infor-mation into their SV detection strategy, while Pindel im-plements a pattern grown approach to utilize split read alignments. ERDS uses an integrative model that com-bines IS, RD, and SNP allele frequency to detect CN im-balances. While there are numerous other algorithms that have been developed for detecting SVs, we focused on these as they have previously published comparisons that can be transitively applied to our results.
Multiple experiments were conducted in order to evaluate our approach. We first simulated genomes of various sequence coverage containing both simple and
complex SVs as homozygous and heterozygous events. We next applied these algorithms to the genome of a haploid hydatidiform mole (CHM1) [8, 24, 25] and also a well-characterized diploid genome (NA12878) [26, 27], both of which had reported high-confidence calls as well as long-read Pacific Biosciences (PacBio) sequences available for orthogonal assessment. All algorithms were run either with the recommended settings as provided by the authors (where available) or default settings. Detailed commands for running each algorithm can be found in Additional file 2.
Simulated data
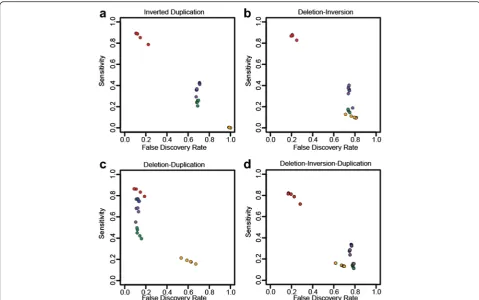
We simulated specific types of complex rearrangements based on structures recently reported [28] as well as our own observations (Additional file 1: Table S1). Perform-ance comparisons with complex structures are less straightforward than with simple SVs as most algorithms are only designed to identify simple events, and therefore may predict portions of CSVs as independent events. We address this issue by considering the identification and predicted CN of individual junctions as reported in the entire prediction set of each algorithm (deletions, duplica-tions, inversions) and compared against each simulated complex event collectively, treating predicted non-simulated junctions in the region as false positives (FPs) (see “Methods”). SVelter performs consistently better in terms of sensitivity and false discovery rate (FDR) across almost all types of complex events (Fig. 3).
Real data
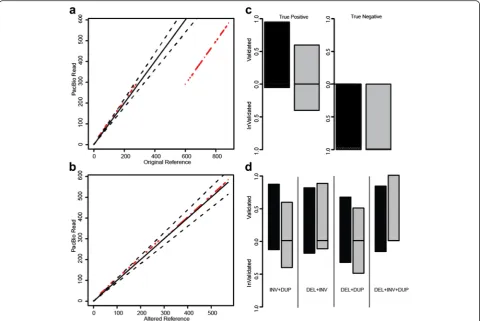
To evaluate how SVelter performs on real data, we have applied each algorithm to two publicly available datasets: CHM1 [24] and a well-characterized diploid genome an-alyzed by the Genome in a Bottle (GIAB) Consortium (NA12878) [26, 27]. Both have been deep sequenced by Illumina short-insert and PacBio long-read sequencing and provide excellent sets of benchmarking variants for simple SVs. However, there are few complex rearrange-ments annotated in either genome and this precluded a direct comparison with our results. We therefore exam-ined the PacBio data directly for each predicted variant using a custom validation approach that utilizes a recur-rence strategy to compare each read to both the refer-ence allele as well as a rearranged referrefer-ence consistent with the predicted structure (Fig. 4a, b, see “Methods”). We conducted PCR experiments on the predicted BPs of three predicted complex rearrangements that were vali-dated with this approach to show convincing evidence for two, with inconclusive results for the third due to high degrees of repetitiveness in the region (Additional file 2: Figures S4–S7). We also evaluated this approach using sets of reported deletions in these samples as well as matched random sets located within copy neutral
regions and found it to have very high true positive (TP) and true negative rates (Fig. 4c). We then assessed our approach on specific types of complex rearrangements in CHM1 and showed SVelter to have an overall high validation rate (Fig. 4d). We also observed an increase in accuracy on simple deletion calls across all algorithms after the application of our validation scheme (Additional file 2: Table S2).
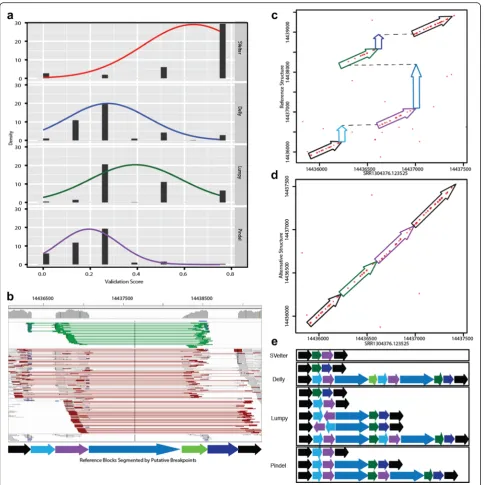
We then compared the performance of each algorithm on identifying and resolving CSVs. Given that there are very few reference sets available of known complex rear-rangements, we first created a set of non-overlapping candidate CSVs as identified by SVelter in CHM1 and NA12878. We then collected all predictions from each algorithm that overlap that region and scored them using the validation approach above. As many complex rearrangements may be described as a combination of simple SVs, we utilized a ranking approach to compare the individual predictions by assigning 0 to the lowest scores and 0.75 to the highest scores (see “Methods”). We observed a significant enrichment of SVelter predic-tions with high validation scores, indicative of its efficacy in correctly resolving CSVs (Fig. 5a). An example is shown in Fig. 5b, which depicts a summary of sequence Fig. 3Assessment of CSV accuracy using simulated datasets. Sensitivity and FDRs for SVelter (red), Delly (blue), Lumpy (green), Pindel (purple), and ERDS (yellow) on simulatedainverted duplications,bdeletion inversions,cdeletion duplications, andddeletion-inversion-duplication events
[image:5.595.57.537.87.387.2]read alignments for a region on chromosome 1 in CHM1 containing multiple deletions as well as a local translocation. Using standard read clustering algorithms, the signals present might suggest the presence of a tan-dem duplication overlapping with large deletions. How-ever, this is not consistent with the haploid nature of CHM1 and comparisons with long PacBio sequence reads that overlap the region show the true structure (Fig. 5c), which when aligned to a rearranged reference using SVelter predictions shows a full length alignment (Fig. 5d). A comparison with other algorithms indicates that their predictions are indeed consistent with analyz-ing each aberrant read cluster independently of each other and result in a combination of tandem duplica-tions, deleduplica-tions, and inversions (Fig. 5e).
Computational runtime
We compared the overall executable runtime of the dif-ferent software packages using a single chromosome
from NA12878. For each algorithm, we initialized the analysis using a previously aligned sequence in BAM format and used the respective procedures necessary for each approach to result in a variant call file (see “Methods”). Delly was observed to complete the fast-est, followed by Lumpy. Pindel and SVelter were some-what slower and were comparable in their runtime (Additional file 2: Table S3). It should be noted that some algorithms (e.g. Lumpy) can perform faster with optimized alignment strategies [29], however this was not included in our assessment.
Examination of identified SVs in CHM1 and NA12878
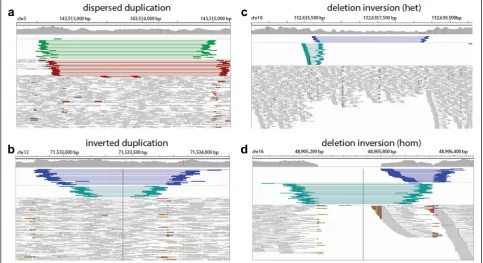
We examined the full set of identified simple and complex SVs in both CHM1 and NA12878. As ex-pected, we rediscovered many previously reported de-letions, duplications, and inversions (Table 1). In some cases, we were also able to identify dispersed duplica-tions that were incorrectly identified as overlapping Fig. 4Overview and application of PacBio validation approach to human data.aDot plotof the sample region containing a simple deletion using a single PacBio read against the reference genome.Red dotsindicate matches between sequences anddashed black linesdelineate 10 % deviance from the diagonal.bDot plotof the same region using an altered reference incorporating the deletion event.cFraction of TP calls using validation approach on published deletions in NA12878 (black) and CHM1 (gray) and CN2 regions as negative controls.Dashed black lines
[image:6.595.58.539.88.409.2]tandem duplication and deletion events in prior re-ports (Fig. 6a, Additional file 2: Figure S8). Further-more, we found a recurrence of particular types of CSVs, including inverted-duplication and deletion-inversion events (Fig. 6b–d, Additional file 2: Figures
S9–S11) suggesting that they are likely more common than previously thought. However, there were numer-ous other CSVs that could not be coalesced into a sin-gle classification and may provide future insight into new mechanisms for SV formation.
Fig. 5Evaluation of CSV predictions.aValidation scores of CSV predicted in NA12878 from all algorithms ranked and normalized from 0 to 1 for comparison. For approaches with multiple predicted SVs in a region, average scores from each prediction were averaged.bIGV screenshotof example complex region in CHM1 (chr1:14435000-1444000) containing multiple deletions (blue shaded arrows) and a translocated region (green arrow), with surrounding anchor regions inblack. Light green linesin IGV indicate RPs with reverse-forward orientation, whilered linesindicate RPs with aberrant IS length.cDot plotof region between an individual PacBio read (SRR1304376.123525) against the reference sequence.Colored arrowscorrespond to segments indicated in (b).dDot plotof altered reference sequence implementing predicted rearrangements by SVelter. eSchematicof predictions by each SV algorithm with respect to segments indicated in (b). For approaches with multiple predictions overlapping the region, each predicted SV is shown independently
[image:7.595.57.543.86.572.2]Discussion
We have described an integrative approach, SVelter, that can identify both simple and complex structural variants through an iterative randomization process. We show that it has an improved or comparable accuracy to other algorithms when detecting deletions, duplications, and inversions but has the additional capability of correctly interpreting and resolving more complex genomic
rearrangements with three or more BPs. Furthermore, SVelter can resolve structural changes on parental hap-lotypes individually, allowing for the correct stratifica-tion of multiple overlapping SVs. SVelter achieves this by forgoing the assumption of specific patterns of read alignment aberrations as associated with individual rear-rangements and instead allowing the underlying se-quence itself to dictate the most probable structure.
[image:8.595.57.290.99.267.2]The ability to accurately identify CSVs in whole gen-ome sequence data is a significant advancement, as cur-rently many such regions are either missed or identified as individual errant events. For example, in our investi-gation of NA12878 we identified many disperse duplica-tions that were previously reported as overlapping deletion and tandem duplication events as well as other simple deletions and inversions that were in fact part of a larger complex rearrangement (Fig. 5). Such regions could be, in part, responsible for the observed discrepan-cies when comparing different SV algorithms with each other as well as other platforms such as array-CGH [30]. Our observations are also consistent with recent findings by the 1000 Genomes Project [28], however their ana-lysis required the use of multiple long-read sequencing technologies including PacBio and Moleculo to interpret the regions while SVelter is able to correctly resolve the regions from short-insert Illumina sequences alone.
Table 1Predicted SV types in CHM1 and NA12878 by SVelter
SV type CHM1 NA12878
Simple DEL 1003 (0.72) 1867 (0.95)
Simple DUP 897 (0.61) 790 (0.61)
Tandem 834 (0.62) 755 (0.60)
Dispersed 63 (0.56) 35 (0.71)
Simple INV 48 (0.75) 107 (0.76)
Simple TRA 24 (0.67) 30 (0.83)
INV + DUP 126 (0.59) 29 (0.86)
DEL + INV 8 (0.88) 26 (0.81)
DEL + DUP 8 (0.50) 12 (0.67)
DEL + DUP + INV 2 (1.00) 6 (0.83)
Other 112 (0.63) 204 (0.77)
Numbers in parenthesis indicate percentage of calls with PacBio validation support. The remaining calls either were not able to be assayed with our approach or were invalidated
[image:8.595.56.540.412.675.2]Although long-read technologies are very well suited for such an application, their use is currently limited to small-scale projects and there have been estimates that over 300,000 genomes have been sequenced using Illu-mina short-insert reads in 2015 alone. Thus, ap-proaches like SVelter that perform accurately on such datasets are likely to have a larger impact on correctly reporting complex structural genomic aberrations, though they will have lesser ability to detect and recon-struct novel insertion sequences compared to long-read approaches.
While SVelter was specifically designed to identify and resolve complex rearrangements, it also surpris-ingly showed a slight increase in accuracy in identify-ing certain types of simple SVs when compared to other modern approaches. One potential factor that may contribute to this observation is that SVelter determines the presence of an SV in a quantitative and not qualitative manner. Specifically, most other paired-end algorithms typically utilize a standard deviation-based cutoff to determine whether the ob-served IS fragments are larger than would be ex-pected from the constructed library; thus, two paired sequence reads are either aberrant or normal. SVelter, however, scores each observation directly from the IS probability density function. For example, for an IS li-brary with mean = 350, an observation of 375 will score better than one of 475, even if both are within 3 standard deviations of the overall IS distribution. When combined with the signals of RD and physical coverage over potential BPs, we feel this adds add-itional granularity for identifying SVs, particularly for smaller (<1 kb) events.
One limitation of SVelter is that, even with our effi-ciency enhancements, it still exhibits a longer processing time with respect to the other SV algorithms compared here. This is in part due to the randomization strategy but is also owing to the inclusion of a read coverage component, which is not modeled in the other ap-proaches we compared against but contributes to the overall increased accuracy of SVelter. Recent advances have made it possible to analyze a high coverage human genome from sequence to variant calling and annotation in half a day [29] and such applications are very useful for diagnostic applications where speed is a critical com-ponent. Nevertheless, the enhanced ability of SVelter to correctly resolve overlapping and complex rearrange-ments relative to other approaches makes it very useful for projects where the accurate detection of such regions is important. Another limitation of SVelter is that in its current form it has a reduced ability to delineate heterogeneous data, such as commonly found when sequencing cancer genomes. This is due to its expect-ation of a specific ploidy when iterating between
multiple haplotypes. Future work in this area will focus on creating a dynamic structure that can allow different levels of heterogeneity or mosaicism.
Conclusions
We have developed and applied a new approach to ac-curately detect and correctly interpret both simple and complex structural genomic rearrangements. Our com-parisons to existing algorithms and datasets show that SVelter is very well suited to identifying all forms of bal-anced and unbalbal-anced SV in whole genome sequencing datasets.
Methods SVelter algorithm
SVelter takes aligned Illumina paired-end sequence data in sorted BAM format as input as well as the reference genome against which the sequences were aligned and reports all predicted SVs in both a custom format as well as VCFv4.1. Default parameters are chosen to best bal-ance sensitivity and efficiency, though are adjustable for users to best fit their own data. The SVelter framework consists of three major modules: null model determin-ation, BP detection, random iterative rearrangement, and structure scoring (Fig. 2).
Null model determination
SVelter first filters the reference genome to exclude regions of low mappability from downstream analysis to increase efficiency by avoiding regions where align-ments are unreliable. Such regions include gaps and unknown regions in the reference genome (Ns) and these are integrated with previously reported genomic regions identified by ENCODE [31] (wgEncodeDac-MapabilityConsensusExcludable and DukeMapabilityR-egionsExcludable obtained from UCSC Genome Browser) that are of low mappability to form a final version of excluded regions. Next, the IS distribution (fIS) is de-termined by calculating the mean (μIS) and standard deviation (σIS2) of all RPs aligned to genomic regions that are either randomly sampled or collected from a set of copy neutral (CN2) genomic regions defined as places in the genome where no polymorphic CNVs, segmental duplications, or repetitive elements have been annotated and thus providing a good estimate of the baseline alignment characteristics [22]. Normal dis-tribution is constructed (fIS∼N(μIS,σIS
2
)). A normal dis-tribution of RD (fRD∼N(μRD,σRD2)) and physical coverage (fPC∼N(μPC,σPC2)) are characterized by slid-ing a fixed-size window (default: 100 bp) across the same genomic region and constructing the sample mean and standard deviation. Alternatively, in situations where the RD is not high enough be approximated as normal (empirically, <10X), SVelter provides options for
more complex but less efficient models, i.e. bimodal (fit-ted bymixtools) for IS,
fIS∼pNμIS1;σ2IS1þð1−pÞ NμIS2;σ2IS2
and negative binomial for RD and physical coverage:
fRD∼NB rðRD;pRDÞ; where rRD¼ μRD
2
σRD2−μRD
; PRD¼1−μRD σRD2
fPC∼N B rðPC;pPCÞ;where rPC¼ μPC
2
σPC2−μPC
;PPC¼1−μPC σPC2
Detection and clustering of putative BPs
SVelter next scans the input alignment file to define puta-tive BPs where the sample genome differs from the refer-ence. These are defined through the identification of aberrant read alignments. Clusters of RPs showing abnor-mal insert length or aberrant mapping orientation may in-dicate BPs nearby, while reads with truncated (clipped) split read (SR) alignments are indicative of precise BP positions. SVelter specifically defines aberrant reads as follows:
1. RPs outside expected IS (μIS±s×σIS, wheresis the number of standard deviation from the mean, default as 3);
2. RPs that do not have forward reverse pair orientation;
3. SRs with high average base quality (i.e. 20) clipped portion with minimum size fraction of overall read length (i.e. 10 %).
It should be noted that the default parameters used by SVelter were determined empirically and can be adjusted by the user. Discordant RPs of the within a window of mean IS + 2*std distance and of the same orientation are clustered together. Next, split reads within this window and downstream of the read direction are collated and the clipped position is considered as a putative BP. If no such reads exist, the rightmost site of forward read clusters or leftmost site of reverse read clusters is assigned instead. For each cluster of aberrant RPs, a BP is assigned if the total number of split reads exceeds 20 % of the RD or the total number of all aberrant reads exceeds 30 %. For samples of poorer quality, higher cutoffs might be preferred. Each pu-tative BP will be paired with other BPs that are defined by mates of its supporting reads. BP pairs that intersect or are physically close (<1 kb) to each other will be further grouped and reported as a BP cluster for the next step.
Random iterative rearrangement
For each BP cluster containing n putative BPs, a ran-domized iterative procedure is then applied on the n-1 genomic blocks between adjacent BPs. SVelter has three
different modules implemented for this step: diploid module (default) that detects structural variants on both alleles simultaneous, heterozygous module that only re-port high quality heterozygous SVs, and homozygous module for high quality homozygous SVs only. For the diploid module, a simple rearrangement (deletion, inver-sion, or insertion) is randomly proposed and applied to each block on one allele while the other allele is kept un-changed and the newly formed structure is scored against the null models of expectation for each feature through the scoring scheme described below. A new structure is then selected probabilistically from the dis-tribution of scores such that higher scores are more likely but not assured. The same approach is then ap-plied to the other allelic structure representing a single iteration overall. For heterozygous and homozygous modules, only one allele is iteratively rearranged while the other allele remains either unchanged or is mirrored, respectively.
The iterative process will terminate and report a final rearranged structure if one of the following configurable situations is met:
1. No changes to a structure after 100 continuous iterations; or
2. The maximum number of iterations is reached (100,000 as default).
After the initial termination, the structure is reset and the process is repeated for another 100 iterations while avoiding the fixed structure, at which point the highest scoring structure overall is chosen.
Structure scoring
AssumeSjas the score of rearranged structurej. To esti-mate Sj, four different characteristics of RP i: IS (ISij), Pair Orientation (POij), RD (RDij), and Physical Coverage Through a BP (PCij) would be calculated and integrated. As the distribution of IS, RD, and Physical Coverage has been defined, the density function would be calculated and transformed to log scale:
ScoreISij¼log fIS ISij
ScoreRDij¼log fRD RDij
ScorePCij¼log fPC PCij
Score of Pair Orientation is specified by the indicator function:
ScorePOij¼ 10;;if POif other wise¼Forward−Reverse
n o
individual scores of each RP would be integrated to form the structure score:
Si¼ Xn
i¼1
ScoreISij 1þ
Xn
i¼1ScorePOij
n
!
þτX
n
i¼1
ScoreRDij 1− Xn
i¼1
ScorePCij !
;
whereτ¼ log fðISð ÞμISÞ
log fðRDðμRDÞÞserves as the factor to regulate two
parts into same scale.
Performance assessment
Both simulated and real data were used to evaluate perform-ance of SVelter. To produce simulation datasets, we altered the human GRCh37 reference genome to include both homo-zygous and heterohomo-zygous simple SVs and complex SVs inde-pendently while adding micro-insertions and short tandem repeats around the junctions in frequencies consistent with previously reported BP characteristics [32]. Details about spe-cific types of SVs simulated are summarized in Additional file 1: Table S1, and specific details regarding the generation of the simulated data can be found in Additional file 3: Supplemental Methods. Paired-end reads of 101 bp with an IS of 500 bp mean and 50 bp standard deviation were simulated using wgsim (https://github.com/lh3/wgsim) across different RDs (10X, 20X, 30X, 40X, 50X).
For comparisons using real sequence data, we adopted two previously published samples: CHM1 [24] and NA12878 [18]. CHM1 has been deep sequenced by Illu-mina whole-genome sequence to 40X and by Single Mol-ecule, Real-Time (SMRT) sequencing to 54X, and SVs of the sample have been detected and published by the same group as well (http://eichlerlab.gs.washington.edu/publica-tions/chm1-structural-variation/). NA12878, together with the other 16 members from CEPH pedigree 1463, has been deep sequenced to 50X by Illumina HiSeq2000 system (http://www.illumina.com/platinumgenomes/). Additionally, the GIAB Consortium has published the PacBio sequencing data (20X) of NA12878 and also provided a set of high-confident SV calls [24, 27].
We assessed SVelter against four other algorithms with diverse approaches: Pindel, Delly, Lumpy, and ERDs. We applied these algorithms to both simulated and real data with default settings, except that SVelter’s homozygous module was used for CHM1. All algorithms were com-pared using the same set of excludable regions and were run on the same computing cluster.
Assessment of simulated simple SVs
For simulated datasets, we compared the perform-ance of each algorithm by calculating their sensitivity and FDR on each type of simple SV (deletion, dis-perse duplication, tandem duplication, inversion). As
Lumpy reports BPs in terms of range, we calculated the median coordinate of each reported interval and consider it as the BP for downstream comparison. A reported SV would be considered as a TP if the gen-omic region it spanned overlapped with a simulated SV of the same type by over 50 % reciprocally. As Delly and Lumpy did not differentiate tandem and dispersed duplication in their SV report, we compare their reported duplications to both simulated tandem and dispersed duplications independently to calculate sensitivity, but use the entire set of simulated dupli-cations together for the calculation of specificity. In this manner, the result will be biased towards higher TP and TN rates for these approaches. Dispersed duplications reported by Pindel were very rare and as such were processed in the same way as Delly and Lumpy.
Assessment of real SVs
We initially made use of reported simple and complex SVs in CHM1 and NA12878 as gold standard sets; how-ever, the FP rate of each algorithm was high compared to previously published performance. To augment this set, we therefore have developed our own approach to validate simple and complex SVs using PacBio long reads. For each reported SV, we collect all PacBio reads that go through the targeted region and hard clip each read prior to the start of the region. We then compare each read to the local reference and an altered refer-ence reflecting the structure of the reported SV by slid-ing a 10 bp window through the PacBio read and aligning it against the reference sequence. Coordinates of each window are plotted against its aligned position in the form of a recurrence plot. If a read was sampled from the reference genome, most of the matched points should distribute close to the diagonal line. However, if a read was sampled from an altered gen-omic region, a continuous diagonal line would only show when plotted against a correctly resolved se-quence. In this manner, shorter SVs can be validated by accessing the deviation of all matched points from di-agonal. If aligning long readjagainst referencek, devi-ation of point i(xijk,yijk) is defined asdijk= |xijk−yijk|, i.e. the vertical distance of the point to the diagonal. The deviation score of eachjis calculated by summing up deviation of all points
Sjk ¼ Xn
i¼1dijk
wherenis the number of matches. For each long readj,
the recurrence plot is made against the reference in both the original and altered formats, with corresponding
scoresSj,k= orig and Sj,k = altassigned, and the score for the read is defined as
Sj¼
Sj;k¼orig
Sj;k¼alt−
1
such that a positive score indicates the priority of altered genome over reference genome, and vice versa. The valid-ation score of an SV is defined as proportion of supportive
reads among the totalminterrogated reads
Sval¼
Xm
j¼1I 1; if Sj >0; 0; otherwise
m number of reads checkedð Þ
SVs with validation score >0.5 for haploid genome, or >0.3 for diploid genome would be considered vali-dated. We further assess our ability to interrogate SVs in this fashion by scoring the reference sequence against itself at each region. In highly repetitive regions, the de-viation scores will be higher overall and we can label such regions as non-assessable.
For longer (>5 kb) SVs, PacBio reads spanning through the whole targeted region are rarely observed in these data. In this situation, we scored each BP by adding 500 bp flanks and assessing each individually. The final validation score is then determined through the collation of matches from all BPs.
We reassessed our initial TP and FP simple calls from each algorithm by combining our PacBio validated SVs from each algorithm together with the reported calls. For simple SVs, we utilized a 50 % reciprocal overlap cri-terion. However, for CSVs we utilized a more complex comparison strategy to take into account that some al-gorithms will often detect individual parts of a complex rearrangement as distinct events. With each CSV pdicted by SVelter, we extracted SVs with over 50 % re-ciprocal overlap from other algorithms and calculated the validation score for each of them using our PacBio validation approach described above. When multiple SVs were extracted from an algorithm, averaged scores were adopted. Validation scores of a CSV from all algorithms were ranked and normalized from 0 to 1 for comparison.
Software and data availability
The software package SVelter (v1.1.2) is available for download at https://github.com/mills-lab/svelter as open source under the MIT License and additional documen-tation regarding specific software usage and parameters, supporting files, algorithm comparisons, and simulated datasets are provided at this site.
Simulated whole genome sequence data were generated as outlined in the supplemental code from synthetic refer-ence sequrefer-ences that can be obtained from https://umich. box.com/v/svelter.
Sequence data used in this analysis were obtained from the following resources:
CHM1 – Resolving the complexity of the human
genome using single-molecule sequencing (http://eich lerlab.gs.washington.edu/publications/chm1-structural-variation/) [24].
NA12878 – Genome in a Bottle Consortium (https:// sites.stanford.edu/abms/giab) [24, 26], Illumina Platinum Genomes (http://www.illumina.com/platinumgenomes/).
Additional files
Additional file 1:Contains Supplemental Table 1 outlining the type and number of SVs included in each simulated genome and the stratified results for each algorithm. (XLSX 111 kb)
Additional file 2:Contains Supplemental Tables 1–3 and Supplemental Figures 1–11 (DOCX 1461 kb)
Additional file 3:Supplemental Methods outlining the software and parameter usage that was used to generate the presented results. (DOCX 10 kb)
Acknowledgements
We thank Laura Scott for her helpful comments on the statistical aspects of this work and Marcus Sherman for his contributions to SVelter classifications.
Funding
This project was supported in part through funds from the University of Michigan, the NIH/NHGRI (1R01-HG007068-01A1), and NIH/Common Fund (DP5OD009154).
Authors’contributions
XZ developed and implemented the algorithms and wrote the source code. REM conceived the analytical framework, devised the experiments and supervised the project. SBE, BM, and JMK performed the PCR validation experiments. REM and XZ prepared the figures and wrote the manuscript. All authors read and approved of the final manuscript.
Competing interests
The authors declare that they have no competing interest.
Ethics approval and consent to participate No ethical approval was required for the project.
Received: 20 April 2016 Accepted: 25 May 2016
References
1. Zarrei M, Mehdi Z, MacDonald JR, Daniele M, Scherer SW. A copy number variation map of the human genome. Nat Rev Genet. 2015;16:172–83. 2. Mills RE, Walter K, Stewart C, Handsaker RE, Chen K, Alkan C, et al. Mapping
copy number variation by population-scale genome sequencing. Nature. 2011;470:59–65.
3. 1000 Genomes Project Consortium, Abecasis GR, Auton A, Brooks LD, DePristo MA, Durbin RM, et al. An integrated map of genetic variation from 1,092 human genomes. Nature. 2012;491:56–65.
4. Brand H, Pillalamarri V, Collins RL, Eggert S, O’Dushlaine C, Braaten EB, et al. Cryptic and complex chromosomal aberrations in early-onset
neuropsychiatric disorders. Am J Hum Genet. 2014;95:454–61. 5. Chiang C, Colby C, Jacobsen JC, Carl E, Carrie H, Adrian H, et al. Complex
reorganization and predominant non-homologous repair following chromosomal breakage in karyotypically balanced germline rearrangements and transgenic integration. Nat Genet. 2012;44:390–7.
7. Chen K, Wallis JW, McLellan MD, Larson DE, Kalicki JM, Pohl CS, et al. BreakDancer: an algorithm for high-resolution mapping of genomic structural variation. Nat Methods. 2009;6:677–81.
8. Ye K, Schulz MH, Long Q, Apweiler R, Ning Z. Pindel: a pattern growth approach to detect break points of large deletions and medium sized insertions from paired-end short reads. Bioinformatics. 2009;25:2865–71. 9. Layer RM, Chiang C, Quinlan AR, Hall IM. LUMPY: a probabilistic framework
for structural variant discovery. Genome Biol. 2014;15:R84.
10. Handsaker RE, Korn JM, Nemesh J, McCarroll SA. Discovery and genotyping of genome structural polymorphism by sequencing on a population scale. Nat Genet. 2011;43:269–76.
11. Rausch T, Zichner T, Schlattl A, Stütz AM, Benes V, Korbel JO. DELLY: structural variant discovery by integrated paired-end and split-read analysis. Bioinformatics. 2012;28:i333–9.
12. Alkan C, Can A, Coe BP, Eichler EE. Genome structural variation discovery and genotyping. Nat Rev Genet. 2011;12:363–76.
13. Sindi SS, Selim Ö, Peng LC, Hsin-Ta W, Raphael BJ. An integrative probabilistic model for identification of structural variation in sequencing data. Genome Biol. 2012;13:R22.
14. Quinlan AR, Hall IM. Characterizing complex structural variation in germline and somatic genomes. Trends Genet. 2012;28:43–53.
15. Usher CL, McCarroll SA. Complex and multi-allelic copy number variation in human disease. Brief Funct Genomics. 2015;14:329–38.
16. Raphael BJ, Volik S, Collins C, Pevzner PA. Reconstructing tumor genome architectures. Bioinformatics. 2003;19(2):ii162–71.
17. Moncunill V, Gonzalez S, Beà S, Andrieux LO, Salaverria I, Royo C, et al. Comprehensive characterization of complex structural variations in cancer by directly comparing genome sequence reads. Nat Biotechnol. 2014;32:1106–12.
18. Greenman CD, Pleasance ED, Newman S, Yang F, Fu B, Nik-Zainal S, et al. Estimation of rearrangement phylogeny for cancer genomes. Genome Res. 2012;22:346–61.
19. Conrad DF, Bird C, Blackburne B, Lindsay S, Mamanova L, Lee C, et al. Mutation spectrum revealed by breakpoint sequencing of human germline CNVs. Nat Genet. 2010;42:385–91.
20. Lawrence CE, Altschul SF, Boguski MS, Liu JS, Neuwald AF, Wootton JC. Detecting subtle sequence signals: a Gibbs sampling strategy for multiple alignment. Science. 1993;262:208–14.
21. Kim JH, Waterman MS, Li LM. Diploid genome reconstruction of Ciona intestinalis and comparative analysis with Ciona savignyi. Genome Res. 2007;17:1101–10.
22. Handsaker RE, Van Doren V, Berman JR, Genovese G, Kashin S, Boettger LM, et al. Large multiallelic copy number variations in humans. Nat Genet. 2015; 47:296–303.
23. Zhu M, Need AC, Han Y, Ge D, Maia JM, Zhu Q, et al. Using ERDS to infer copy-number variants in high-coverage genomes. Am J Hum Genet. 2012; 91:408–21.
24. Chaisson MJP, Huddleston J, Dennis MY, Sudmant PH, Malig M, Hormozdiari F, et al. Resolving the complexity of the human genome using single-molecule sequencing. Nature. 2015;517:608–11.
25. Steinberg KM, Schneider VA, Graves-Lindsay TA, Fulton RS, Agarwala R, Huddleston J, et al. Single haplotype assembly of the human genome from a hydatidiform mole. Genome Res. 2014;24:2066–76.
26. Pendleton M, Sebra R, Pang AWC, Ummat A, Franzen O, Rausch T, et al. Assembly and diploid architecture of an individual human genome via single-molecule technologies. Nat Methods. 2015;12:780–6.
27. Parikh H, Mohiyuddin M, Lam HYK, Iyer H, Chen D, Pratt M, et al. svclassify: a method to establish benchmark structural variant calls. BMC Genomics. 2016;17:64.
28. Sudmant PH, Rausch T, Gardner EJ, Handsaker RE, Abyzov A, Huddleston J, et al. An integrated map of structural variation in 2,504 human genomes. Nature. 2015;526:75–81.
29. Chiang C, Layer RM, Faust GG, Lindberg MR, Rose DB, Garrison EP, et al. SpeedSeq: ultra-fast personal genome analysis and interpretation. Nat Methods. 2015;12:966–8.
30. Pinto D, Darvishi K, Shi X, Rajan D, Rigler D, Fitzgerald T, et al.
Comprehensive assessment of array-based platforms and calling algorithms for detection of copy number variants. Nat Biotechnol. 2011;29:512–20. 31. ENCODE Project Consortium. An integrated encyclopedia of DNA elements
in the human genome. Nature. 2012;489:57–74.
32. Kidd JM, Graves T, Newman TL, Fulton R, Hayden HS, Malig M, et al. A human genome structural variation sequencing resource reveals insights into mutational mechanisms. Cell. 2010;143:837–47.
• We accept pre-submission inquiries
• Our selector tool helps you to find the most relevant journal
• We provide round the clock customer support
• Convenient online submission
• Thorough peer review
• Inclusion in PubMed and all major indexing services • Maximum visibility for your research
Submit your manuscript at www.biomedcentral.com/submit