Technology (IJRASET)
Comparision of Seismic Behaviour of Regular and
Vertical Irregular Structure by using Pushover
Analysis
Patil Sadhana M.1, D.N.Shinde2 1
Student, Department of Civil Engineering, P.V.P.I.T. Budhgaon, Maharashtra, India
2
Associate Professor, Department of Civil Engineering, P.V.P.I.T. Budhgaon, Maharashtra India
Abstract—There are different analysis methods to study the seismic behavior of RC building frame. In present study the seismic analysis of building frame is carried out by using pushover analysis. Pushover analysis is non-linear static analysis method in which the structure is subjected to monolithically increasing lateral loads. Now a day’s most of the structures are involved with architectural importance, so it is necessary to study the seismic behavior of irregular structure. The present study is concerned with the comparison of seismic responses of regular and vertical irregular structure. The purpose of doing this study is to carry out the pushover analysis of two (regular and vertical irregular) G+7 RC building by using design and analysis software ETABSv9.5.0.and designed as per the Indian standard 456:2000 and 1893:2000.The objective of concerned work is study effect of vertical irregularity on building frame in terms of parameter storey drift,storeydisplacement,andstoreyshear. Keywords – Pushover analysis, Seismic response, storey drift, storey displacement, storey shear
I. INTRODUCTION
The behavior of building frame during an earthquake depends upon discontinuity in mass stiffness and the strength. To ensure safety against seismic forces of multistoried building frames, there is necessity to study the seismic analysis to design structure as earthquake resistant.
Now a day’s requirement of the latest generation and growing population has made the architects inevitable towards development of irregular building configuration. There are different types of irregularity-plan irregularity and vertical irregularity. Vertical irregularities are again divided into subtypes such as, mass irregularity, stiffness irregularity, vertical geometric irregularity, and discontinuity in capacity, In-plane discontinuity in vertical elements resisting lateral force. Among these the vertical geometric irregularity is considered for present study. When the horizontal dimension of lateral force resisting system in any storey is more than 150% of that adjacent storey, then it is called as vertical irregular structure.
Two G+7RC building frames with and without vertical irregularity are considered for present study. Vertical irregularity is achieved by reducing number of bays in vertical downward direction. The pushover analysis is carried out by using design and analysis software ETABSv9.5.0.and designed as per Indian standard 456:2000 and IS1893:2002.
II. PROBLEM STATEMENT Type of frame : RC moment resisting
Frame Seismic zone : III Number of storey : G+7 Live load : 4.0 kN/m2 Floor finish : 1 kN/m2 .
Earthquake load :As per IS-1893(Part- 1)2002.
Type of Soil : Type II, Medium soil As per IS: 1893:2002 Storey height : 3 m.
©IJRASET: All Rights are Reserved
359
Walls : 230mm thick brick Masonry walls.
Slab thickness : 150mm thick No. of Bays : 6 along both direction. Spacing along X-axis : 4.5 m
Spacing along Y-axis : 3 m
Materials : Concrete M30, Steel Fe 415
Density of concrete : 25kN/m3 Type of Soil : Medium Damping of structure : 5% M-I -regular building frame
M-II -irregular building frame (building frame Having 200% vertical irregularity).
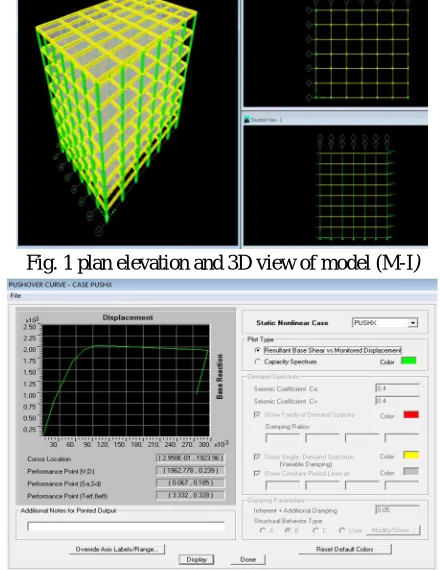
[image:3.612.71.522.366.712.2]III. MODELING AND PUSHOVER ANALYSIS OF REGULAR BUILDING FRAME (M-I)
Fig. 1 plan elevation and 3D view of model (M-I)
Fig. 2 Pushover curve for model M-I case PUSH-X Size of columns :C1=520X480mm for ground floor,
1st,2nd and 3rd floor C2=340x300mm for 4th ,5th,6th 7th floor
Size of Beams : B1=420X380mm for 1st , 2,3rdand 4th floor
[image:3.612.195.415.421.706.2]Technology (IJRASET)
Fig.3 Pushover curve for model M-I case PUSH-Y
Fig.4 Capacity and demand curves of model M-I PUSH X load case
Fig.5 Capacity and demand curves of model M-I PUSH Y load case
©IJRASET: All Rights are Reserved
361
(M-II)
Fig..6 Elevation and 3D view of model (M-II)
Fig.7 Pushover curve for model M-II case PUSH-X
Fig.8 Pushover curve for model M-II case PUSH-Y
Technology (IJRASET)
Fig.10 Capacity and demand curves of model M-II PUSH Y load case
For PUSH X and PUSH Y Case base shear at the performance point is 1353.7 kN and 1795.2 kN respectively.
V. PUSHOVER ANALYSIS
A. Storey displacement
Fig.11 Variation in Storey displacement (X)
Fig.12 Variation in Storey displacement (Y)
0 0.005 0.01 0.015 0.02 0.025 0.03 la te ra l di spl a ce m en t (m
) Storey Displacement in X-direction
M-I M-II 0 0.005 0.01 0.015 0.02 0.025 la te ra l di spl a ce m en t(m )
storey Diaplacement in y-direction
M-I
©IJRASET: All Rights are Reserved
363
Fig.13 Variation in Storey drift (X)
Fig.14 Variation in Storey drift (Y)
C. Storey Shear
Fig.15 Variation in Storey shear (X)
0 0.0005 0.001 0.0015 0.002 st o re y dr if t(m )
Storey drift in X-direction
M-I M-II 0 0.0002 0.0004 0.0006 0.00080.001 0.0012 0.0014 0.0016 st o re y dr if t(m )
Storey Drift in Y- Direction
M-I M-II 0 100 200 300 400 500 600 700 800 900 1000 st o re y s h ea r(kn )
Storey Shear In X-direction
M-I
Technology (IJRASET)
Fig.16 Variation in Storey shear (Y)
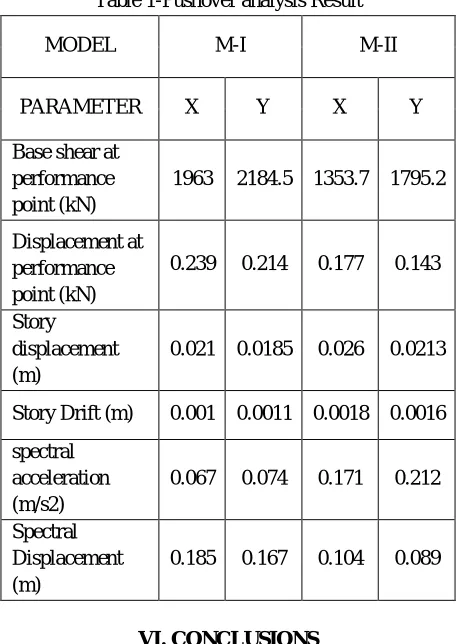
VI. ANALYSIS RESULTS
Table 1-Pushover analysis Result
MODEL M-I M-II
PARAMETER X Y X Y
Base shear at performance point (kN)
1963 2184.5 1353.7 1795.2
Displacement at performance point (kN)
0.239 0.214 0.177 0.143
Story displacement (m)
0.021 0.0185 0.026 0.0213
Story Drift (m) 0.001 0.0011 0.0018 0.0016
spectral acceleration (m/s2)
0.067 0.074 0.171 0.212
Spectral Displacement (m)
0.185 0.167 0.104 0.089
VI. CONCLUSIONS The following conclusions are drawn based on present study:
A. The building frame with vertical irregularity undergoes maximum storey displacement as compared to the building frame without vertical irregularity.(fig.11 and fig.12)
B. Due to provision of vertical irregularity there is increase in storey drift. (fig.13 and fig.14)
C. In case of irregular building frame there is decrease storey shear as compared to the regular building frame. (fig.15 and fig.16)
D. Vertical irregular structure has less seismic performance as compared to regular structure.(table 1)
0 200 400 600 800 1000 1200 st o re y s h ea r (kn )
Storey Shear In -Y Direction
M-I
©IJRASET: All Rights are Reserved
365
[1] Jonathan Chambers and Trevor Kelly(2004) “Nonlinear Dynamic Analysis – The Only Option For Irregular Structures”,13th world conference on Earthquake Engineering. vancouver, B.C. Canada
[2] Alessandro Galasco, Sergio Lagomarsino And Andrea Penna (2006) “The Use of Pushover Analysis For Existing Masonry Buildings” First European Conference on Earthquake Engineering and Seismology ,Geneva, Switzerland.
[3] T.L. Karavasilisa, N. Bazeosa, D.E. Beskos(2007) “Seismic response of plane steel MRF with setbacks: Estimation of inelastic deformation demands”.
[4] N. fallah, S. Pourze Ynali and M.I. Hafezi (2011) “Accuracy evaluation of the modal pushover analysis method in the prediction of seismic response of vertically irregular frames” , IJST, Transactions of Civil Engineering.
[5] T. Mahdi V. Soltan Gharaie (2011) “ Evaluation of the accuracy of quasi-static pushover analysis method” Proceedings of the Ninth Pacific Conference on Earthquake Engineering Building an Earthquake-Resilient Society.
[6] Konuralp Girgin and Kutlu Darılmaz.(December 2007 )“ Seismic Response of Infilled Framed Buildings Using Pushover
Analysis”. Department of Civil Engineering, Istanbul Technical University, 34469, Maslak, Istanbul, Turkey Volume 54, Number 5. 5 December 2007
[7] IS:456:2000 Plain and Reinforced code of practice, IS: 875 Code of practice for design loads, IS:1893(Part-1):2002 Criteria for earth quake resistant design of structure, IS:13920:1993 Ductile detailing of RCC structure subjected to earth quake force. [8] Murthy C.V.R, Learning earthquake design
[9] Agrawal, Shrikhande Mansih, earth quake resistant design of structures