R E S E A R C H
Open Access
Design and implementation of real time
wideband channel simulator
Muhammad I Akram
*and Asrar U Sheikh
Abstract
This paper describes the design and implementation of a DSP based real time wideband channel simulator. The simulator implementation uses a floating point (TMS320C6713) and a fixed point (TMS320C6416) DSPs.The simulator has 8 taps and baseband bandwidth of 20 MHz. It has flexibility to generate several channel models under varied environmental conditions. To validate the functionality of the simulator, the baseband data is applied to the simulator input and its output is statistically analyzed and the results are compared with those predicted analytically.
Keywords: Baseband, Channel models, Fixed point, Floating point, Simulator
1 Introduction
Wireless communications are inherently unreliable due to their time varying nature, multipath propagations and presence of interference signals from other users. In the presence of these impairments, substantially higher power must be transmitted to overcome these impair-ments inorder to acheive acceptable symbol error rate in any kind of radio channel. To design reliable and efficient wireless systems, it is essential to understand the behavior of radio channels in different environments.
Statistical channel modeling plays a vital role in the design of reliable wireless communication system. Chan-nel modeling is the first step towards the efficient wireless system design. The purpose of channel modeling is to compute and estimate the various first and higher order statistical parameters of the fading channel. These parameters include Doppler spread, the time constants of fading, average fade duration, level crossing rates, ampli-tude probability distribution functions and the coherence bandwidth. For this purpose, measurements have been taken in different environment to characterize the channel.
Over the past few decades, a number of experiments have been performed to characterize mobile channels in urban, suburban, mountainous, wooded and highway environments [1-16]. On the basis of these measurements,
*Correspondence: [email protected]
Department of Electrical Engineering, King Fahd University of Petroleum & Minerals, Dhahran, 31261 Saudi Arabia
several channel models have been proposed to explain the observed statistical nature of the fading channels between fixed base stations and mobile stations. These include short term fading models like the well-known Rayleigh, Rice [17], Hoyt [18], Nakagami-m [19] and Weibull [20] and for longer term lognormal model has been used [6,21].
To evaluate the design and performance of a commu-nication system, it is desirable to evaluate it in realistic situations. The experiments can be performed directly in a vehicle, driving through different environments. How-ever, this is a time-consuming and expensive task and it requires the presence of measurement equipments with proper calibrations. Moreover, the field trials can be affected by unintended uncontrollable circumstances. The inexpensive and flexible option is to use a real time chan-nel emulator and measure the performance in a laboratory environments as in [22-24]. The commercially available channel emulators available may not offer the user enough flexibility when configuring the wireless channel param-eters to test the system under different environmental conditions. Such simulators do not cover V2V scenarios under different channel models like Hoyt, Rice Hoyt etc. A low cost channel simulator is therefore required that mod-els different scenarios and at the same time provide the user flexibility to measure the performance of the wireless transceiver under environmental conditions.
Over the past few decades, efforts have resulted in several designs and implementation of real time simu-lators. Early efforts were based on analog components
[25-28]. The development of real time simulator starts in 1973 when [25] developed the first Rayleigh based channel simulator. The simulator used Zener diode to generate Gaussian random variable. But with the advent of digital computers, micro-controllers, fast Analog to Digital Converters (ADCs) and Digital to Analog Con-verters (DACs), the analog components were replaced by digital thereby increasing the reliability and flexibil-ity of simulators. Comroe et el [29] first used discrete digital logic in its simulator. With the development of High Speed Digital Signal Processors (DSPs), the DSP based simulators were developed. Goubran et al [30] used 16 bit fixed point DSP for implementation and simu-lated the Gaussian quadrature components along with the log-normally distributed Line of Sight (LOS) compo-nent. Turkmani et al [31] used TMS320 E15 DSP chip for the development of a narrow-band simulator. Cullen et al [32] reported a frequency selective simulator using TMS32050 DSP and IMSA110 integrated circuits. It had a baseband bandwidth of 10 MHz and maximum Doppler frequency of 100 Hz. Chen et al [33] used TMS320C31 DSP to design a frequency selective simulator. Salkintzis et al [34] developed 6 taps wide-band channel simulator having maximum signal bandwidth of 20 MHz. It used two 32 bit DSP floating point processors. Papenfuss et al [35] used a hybrid DSP FPGA architecture to build a wide-band channel simulator. It was capable of simu-lating 12 delay taps and had a baseband bandwidth of 5 MHz. Satellite Channel simulator has been developed in [36] using TMS320C6701 DSP platform. Kominakis et al [37] developed a narrow-band fast and accurate simulator. Khars et al [38] developed a 5 MHz 12 taps wide-band simulator using 12 DSPs (1 for each tap) for the generation of complex coefficients. A narrow-band DSP based channel simulator has also been developed in [39]. Over the last decade, the use of Field Programmable Gate Arrays (FPGAs) in DSP applications has become quite common. The FPGA based simulators have also been developed and their implementations have been described in [40-45].
One important application of wireless communication is Vehicle to Vehicle (V2V) communications where both the transmitter and receiver are in motion. The V2V com-munication finds its applications in mobile ad-hoc wire-less networks, intelligent highway systems, emergency, military and security vehicles. The implementation of V2V communications enhances road safety due to reduc-tion in the number of accidents, improvement in highway traffic flow efficiency and real time data sharing with-out involving the cellular network which leads to efficient fuel consumption and reduced travel time. The statistical model for vehicle to vehicle communication was first pro-posed by Akki and Haber [46] and its statistical properties reported in [47]. This model covers Rayleigh distribution
only with both inphase and quadrature components hav-ing identical variances. Matolak et al [48] after performhav-ing measurements in five different cities, models the chan-nel as Weibull fading chanchan-nel. Based on the work of [47], many V2V simulators have been designed and imple-mented. Cox et al [49] presented a discrete line spectrum based approach to simulate the channel. The work in [50] was based on sum of sinusoids (SOS) approach for sim-ulator design. The simsim-ulator proposed in [51] is based on Kullback-Leibler divergence which is compared with IFFT based approach of simulator design. Borries et al [52] used Gaussian quadrature rules for simulator design. Zaji et al [53] proposed an efficient sum of sinusoids (SOS) based approach for V2V simulator design. All the simula-tor design approaches mentioned above are restricted to V2V Rayleigh fading channel only.
The simulators mentioned above may be classified into three categories. The first category uses the sum of sinu-soid (SoS) approach for generating the fading channel coefficients. This approach has the drawback of multi-ple Sine function calls which makes it computationally expensive to implement in real time. Secondly this kind of simulator does not produce the channel with the sta-tistical properties that match with the theoretical values. Another class of simulators uses IFFT based approach to generate the required channel coefficients. This approach is computationally efficient. The drawback is that it works on a block of data and can not be used for the stream-ing data in real time. The approach used in this paper, is the Filter based approach. This is computationally effi-cient as well as produces channel coeffieffi-cients having more accurate statistical properties.
The proposed simulator is a modified form of the sim-ulator described in [37]. The proposed simsim-ulator uses a generalized Wideband Nakagami Hoyt with diffused line of sight channel model for Vehicle to Vehicle commu-nication [54] environment to generate real time fading data. It covers Rayleigh, Rice, Rice-Hoyt, Lognormal and static channels as its special cases. The multipaths have been modeled as Tap Delay Line (TDL) filter. Efficient implementation of optimal TDL filter has been performed over the TMS320C6416 DSP processor. The novel simu-lator implementation uses two DSP (TMS320C6713 and TMS320C6416) boards along with one wide bandwidth (Microline ORS114) I/O daughter board. To the best of authors’ knowledge, to date such real time simulator has not been proposed and implemented.
2 Brief channel model description
In V2V communications, the received signal consists of direct (LOS) and indirect (NLOS) component. The direct component may or may not be present depending on the presence or absence of obstacles between the transmitter and the receiver. The direct component may be further divided into a clear LOS between the receiver and the transmitter or a diffused LOS. The value of diffused LOS is negligible when the buildings are of steel or reinforced concrete but they must be considered for the wooden and bricks building. In rural areas, most of the building are made of wooden or bricks wall hence while modeling the channel, the diffused LOS component must be considered [55]. In V2V communications as mentioned by [56,57], when the antennas are inside the car, the shadowing must be considered due to the presence of roof top surface.
Youssef et al [16] established after taking the measure-ments in the rural environment that the channel is more accurately modeled only when the variances of Inphase and Quadrature components are different. The argument was further supported by [58] where the model matches the measured data for the cases of unequal variances. For V2V communication, [57] explained the case when the distance between the vehicles exceeds 70-100 m, the Nak-agami m-factor is observed to be less than unity, which corresponds to the case of unequal variances of the Gaus-sian quadrature components. Further as found from the V2V measurements (antennas inside car) results in 5 GHz frequency band [48,59], the m value of each tap of the channel model described is found to be less than unity (0.75-0.89) which from [16] corresponds to the value ofq (0.5-0.707).
Based on these, Akram et al [54] proposed Nakagami Hoyt V2V model with diffused line of sight under the assumption that omnidirectional antennas have been used. The proposed channel modelH(t)is a generalized model that covers the V2V environment as well.
H(t)=ρ(t)+μ(t) (1)
It considers, the lognormally distributed diffused LOS componentρ(t) =Aez(t)and a NLOS component having Hoyt distributed amplitude envelopμ(t)=μ1(t)+jμ2(t)
under the assumptions that both transmitter and receiver are in motion.μ1(t),μ2(t)andz(t)are the real Gaussian
random processes with zero mean and variancesσ12, σ22 andσ32respectively andAis the direct LOS component. q= σ1
σ2 andV2andV1are the velocities of transmitter and
receiver respectively anda= V2
V1.
The time autocorrelation function of the random pro-cessH(t)is derived in [54] V2and V1 are the velocities of transmitter and receiver
respectively, K = 2λπ and fm3 is the LOS component
maximum Doppler.
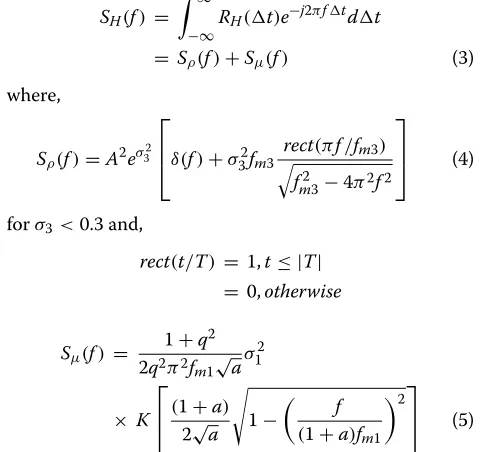
The power spectral density of the proposed model is found as [54],
whereK(.)is the elliptical integral function of first kind, a = V2
V1,fm1 , fm2are the maximum Doppler shifts due
to the motion of the receiver and transmitter respectively withfmi= Vλi. Therefore,fm2=afm1.
3 Simulator description 3.1 Design philosophy
In efficient real time systems design all the available sys-tem resources are efficiently utilized in order to minimize the cost and maximize the productivity. For the data acquisitioning at high data rate, the DSPs can not be interfaced directly with high speed ADCs and DACs
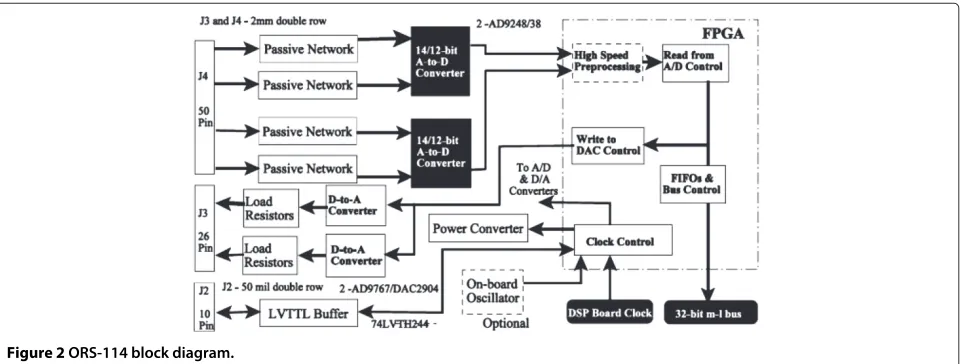
Figure 2ORS-114 block diagram.
because of its I/O bandwidth limitations. The best solu-tion is to use FPGA for this purpose. Therefore, Microline ORS114 daughter board was used for this purpose. The board consists of a vertex-2 FPGA, multiple channel ADC and DAC, FIFO memory and control circuitry used to synchronize the data input output events with DSP. The board is mounted over the peripheral expansion of TMS320C6416 fixed point DSP Starter Kit (DSK) which performs the TDL filtering. Since filtering operation needs to be performed at high data rate, for this purpose an optimal TDL filter need to be implemented. This can be done over fixed point processor of high clock rate. Hence for that purpose TMS320C6416 processor with 1 GHz clock have been selected. The channel coeffi-cient generation depends upon the time variations of the
scatterers surrounding the transmitter and receiver. These variations are normally much slower as compared to the baseband data rate. Therefore for the channel generation purpose a processor with lower clock rate is adequate and a TMS320C6713 32 bit floating point processor is employed. The purpose of floating point processor is to generate the channel coefficients accurately with high precisions.
3.2 Simulator design specification
Figure 1 shows the overall block diagram of the chan-nel simulator. It consists of two DSKs communicating with each other using Multiple Channel Buffered Serial Port 0 (MCBSP0). The TMS320C6713 DSK board acts as a Master device. It generates and transmits channel
Table 1 Timing diagram
Time Line−→ 0 NTs 2NTs 3NTs
EDMA Transfer ADC−→PING IN PONG OUT−→DAC ADC−→PONG IN PING OUT−→DAC
DSP Processes IDLE PING BUFF IDLE PONG BUFF
coefficients to the primary TMS320C6416 DSK board which acts as a slave. The system runs according to the following specification:
• TMS320C6416T DSK board having 1 GHz fixed point processor works as a primary board to accept the baseband input and generate output;
• TMS320C6713 DSK board having 225 MHz floating point processor works as a secondary board that will generate channel taps at the required rate;
• Input Baseband data bandwidth 20 MHz (10 MHz each I & Q);
• Maximum number of Taps (channel coefficients) generated N = 8;
• Maximum Doppler frequency that can be set = 480 Hz;
• ADC and DAC Buffer size = 1024 Elements (16I + 16Q)= 32 bits;
• ADC and DAC resolution = 14 bits;
• Maximum sampling rate of ADC and DAC = 25 MHz;
• Transfer rate of channel coefficients = 16 kHz (2 kHz per tap);
• Maximum excess delay = 1024 samples which on 25 MHz sampling frequency becomes 41μsec.
3.3 Simulator functionality
The simulator performs the following tasks.
3.3.1 Baseband data acquisition
The baseband data acquisition uses Signalware’s ORS-114 daughter board. This card is designed to facilitate rapid construction of prototypes or small to medium produc-tion runs with minimum time-to-market. This periph-eral card provides flexible analog input and output for applications with a Texas Instruments (TI) Digital Sig-nal Processors (DSP). It mounts on a card that contains TI TMS320C6xxx DSPs made by ORSYS, Inc. These DSP cards, known as the “micro-line” series, contain the pro-cessor, DRAM memory and an expansion interface which allows the peripheral card full access to all of the DSP’s resources. The hardware block diagram of ORS114 board is shown in Figure 2.
The daughter board is configured to use 2 channels ADC and DAC working at 25 MSPS each and transferring 14 bit data in and out of DSP. The data transfer is done using Enhanced Direct memory Access (EDMA) inter-face configured with optimal External memory Interinter-face
(EMIF) setting to read and write data. The pin configura-tion detail is given in [60].
Ping Pong buffering technique described in TI docu-mentations at [61] has been used to perform data transfer efficiently between the I/O devices and Internal Memory (SRAM) of DSP. EDMA engine performs the data transfer between the ping/pong buffers and I/O device alternately and a pingpong flag ensures that the DSP is processing the buffer that is not being overwritten by the EDMA. Since EDMA runs independently from the CPU, the CPU can continue to process the block of data that is in the ping buffer while the EDMA is writing data on the pong buffers and vice versa. In order to remain synchronous with EDMA and void the data loss, it is essential for CPU to finish the processing before the next EDMA interrupt is generated. This Hardware interrupt is generated every time the EDMA completes data transfer.
After reset, the DSP performs all the necessary ini-tializations. It configures EMIF settings, initializes the Daughter board, configures EDMA channels to start data transfer and waits for the peripheral device to input the channel parameters. For the ADC Sampling timeTsand PING/PONG buffer sizeN, the data transfer flow is shown in Figure 3. The timing diagram is shown in Table 1.
3.3.2 Primary secondary board interface
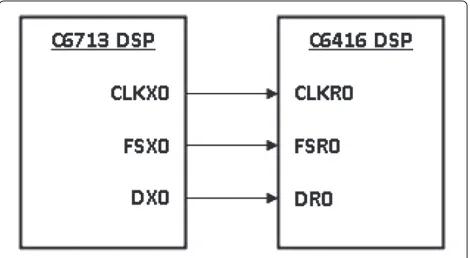
The function of the primary secondary board interface is to obtain the channel coefficients in real time. For this purpose the Multiple Channel Buffered Serial Port (MCBSP 0) present on the external peripheral interface of the TMS320C6416 DSK board, has been used. The port is directly connected with the MCBSP 0 of the secondary board in Master/Slave configuration such that the sec-ondary board that is generating channel coefficients work
Figure 5Pointer manipulation using circular addressing.
as Master device as it also generates clock and frame sig-nal for the serial port whereas the primary board acts as a Slave and use these signals to get data. The block diagram of the connection between the two DSPs via MCBSP ports have been shown in the Figure 4.
After connecting the two DSPs together the next step is to configure the ports so that the data can be trans-mitted and received successfully. The ports are configured by the setting the appropriate values of the four serial port registers. They are Receive Control Register (RCR), Transmit Control Register (XCR), Sample Rate Generator Register (SRGR), Pin Control Register (PCR).
The details of how to set these registers are given in TI documentation [62]. The values are set so that one frame consisting of 8 channel coefficients (each of 32 bits) is transmitted in 500μsec that results in a transmission rate of 16 kHz per coefficient.
Again, EDMA along with ping pong buffering technique is used to perform this transfer efficiently. At the trans-mitting end, the EDMA interrupt is generated periodically and at the same time, the CPU generates new channel coefficients. Whereas, at the receiving end, when a com-plete frame is received an interrupt is generated and the channel coefficients are updated.
3.3.3 Tap delay line filtering
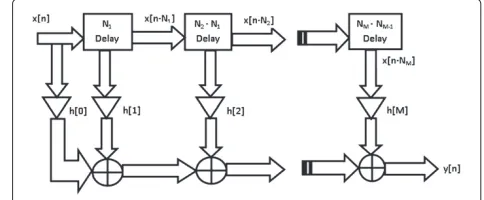
Tapped Delay Line Filter is the basic block of many digital signal processing applications. It is based on the following equation
y[n]= M
k=0
x[n−k] .h[k] (6)
wherey[n] ,x[n] ,h[n] are samples of the output, input and filter coefficient respectively atnthsample instant of a digital system of orderM.
As seen from (6), in order to obtain an outputy[n] in real time, a buffer ofMprevious values (delay line) need
to be maintained along with the current sample. Typi-cally, a pointer is set up at the beginning of the sample array (oldest sample) and then manipulated to access the consecutive values.
Whenever a new sample needs to be added to the delay line all the values need to be shifted down. For large val-ues ofM(delay line), this will cause additional overhead of shifting the large amount of data. The alternate approach is to overwrite the oldest value. This can be implemented by using circular mode for pointer access.
The input data buffer has finite size and has to be accessed circularly as the new samples are continuously written into the buffer the previously stored (oldest sam-ples) need to be overwritten so that the buffer memory is reused. When the pointer reaches the last location of the buffer, it needs to wrap back to the beginning of the buffer. This would normally involve some amount of soft-ware overhead. When Input buffer addressing is defined as circular, the pointer automatically wraps back to the top whenever the bottom of the buffer is reached. Figure 5 illustrates the circular addressing. The input buffer is made circular for that purpose it must be properly aligned in the internal memory. The detail of how to set the buffer as Circular is given in [63].
TDL Filter can be implemented in several ways depend-ing upon the application. Here, the filter is modeled as a frequency selective channel, where the channel taps are
Table 2 Four taps TDL resources allocation for main loop
FU
1 2 3 4 5 6 7 8
Cy
.M1 MPY I4 MPYH I1 MPY I1 MPYH I2 MPY I2 MPYH I3 MPY I3 MPYH I4
.M2 MPYHL Q4 MPYLH Q1 MPYHL Q1 MPYLH Q2 MPYHL Q2 MPYLH Q3 MPYHL Q3 MPYLH Q4
.L1 SUB I3 ADD I3 SUB I4 ADD I4 SUB I1 ADD I1 SUB I2 ADD I2
.L2 ADD Q3 ADD Q3 ADD Q4 ADD Q4 ADD Q1 ADD Q1 ADD Q2 ADD Q2
.S1 ADD B ZERO SHR ADD
.S2 ZERO SHR ADD
.D1 LDW LDW LDW LDW STH
.D2 SUB STH
assumed as multipath fingers located at multiple of sam-pling time Ts . The N = M+ 1 tap time intervals are assumed asτiwhereivaries from 0 toMandτ0=0 . The channel model is shown in Figure 6. The tap indexNi is related withτias
Ni=
τi Ts+
0.5
(7)
where . indicates the truncation operation. For the buffer sizeL, the maximum excess delay that last finger can be computed as
τmax=LTs (8)
Using the pipelining approach mentioned in [64] the code has been optimized for N = 8 taps. The inner loop was completely unrolled to reduce the loop overhead, the dependency graph was created and the instructions were pipelined to reduce the number of cycles. The opti-mized code consists of 3 parts. Theprolog, themainloop andepilog.
The prolog consists of initialization of local variables, pushing registers over stack for usage inside the function, loading taps coefficientsh[n] from memory into registers and defining input buffer as circular. Defining the input as circular buffer removes the overhead of an additional branch instruction inside the loop. The use of circular buffer prevents the constant test of wrapping. The prolog is to be executed once forLsize input buffer. It takes 45 cycles to execute this code.
The main loop is also known as kernel of the pro-gram which is executed most of the time. It is optimized and instructions are scheduled to maximize the utiliza-tion of the CPU resources. ForN taps it is executed 2N times per input sample. For 4 taps, the resources alloca-tions are shown in Table 2. It is also shown that loading of data from memory and its storage into memory are done at the same time using .D1 and .D2 functional units. whereas branching instruction, re-initialization, output storing and counter increments have also been scheduled. STHinstructions have been used to store the sample out-put back into the internal memory,ZEROto re-initialize the output registers back to zero for the computation of
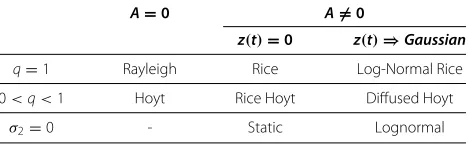
Table 3 Various channel models for simulation
A=0 A=0
z(t)=0 z(t)⇒Gaussian
q=1 Rayleigh Rice Log-Normal Rice 0<q<1 Hoyt Rice Hoyt Diffused Hoyt
σ2=0 - Static Lognormal
next sample output and SHRto bring the output in the required Q3.13 format.
The epilog consists of the remaining part of the func-tion. This include remaining loop portion, popping data back to the registers and branch out of the function. This part takes 42 cycles to execute.
3.3.4 Channel gains generations
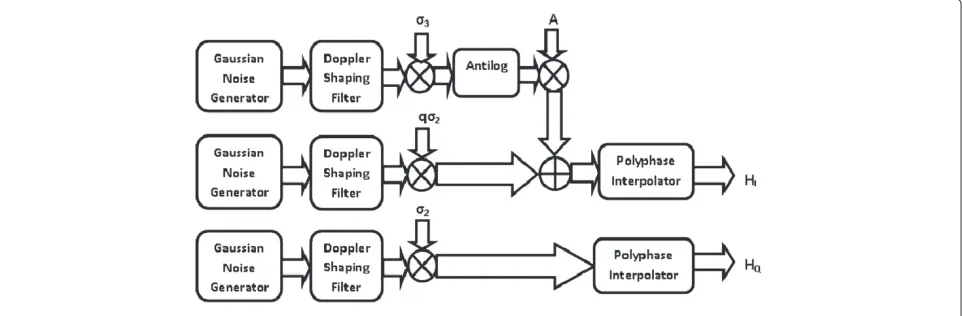
The channel coefficients have been generated using a floating point TMS320C6713 DSP. Kominakis et al [37] describes the efficient method of generating the chan-nel gains. It uses Infinite Impulse Response (IIR) Doppler filter along with the polyphase interpolator for the gen-eration of correlated Gaussian channel coefficients. The original approach was for flat fading Rayleigh channel only. It was modified for the more generalized 8 taps frequency selective Nakagami-q (Hoyt) mobile to mobile fading channel with diffused LOS.
The block diagram of the channel coefficient genera-tion unit of the single (first) tap is shown in Figure 7. The block diagram represents a generalized channel model. By varying the values of parameters (a, q, σ2 andA)
differ-ent channel models can be obtained and simulated. These models are shown in the Table 3. Fora = 0 , the models are obtained for Base to mobile communication whereas a>0 represents V2V communications.
0 0.2 0.4 0.6 0.8 1
−70 −60 −50 −40 −30 −20 −10 0 10 20
Frequency response of IIR Filter a=0, q=0.5
Normalized Frequency
H(f) in dB
Designed Theoretical
Figure 8Frequency response of IIR filter q=1.0 a=0.
0 0.2 0.4 0.6 0.8 1
−100 −80 −60 −40 −20 0 20
Frequency Response of IIR Filter For q=0.5 a=0.5
Normalized Frequency
H(f) in dB
Designed Theoretical
Figure 9Frequency response of IIR filter q=0.5 a=0.5.
The Doppler Shaping Filter is implemented as an IIR Filter having the frequency response S(f)obtained by taking the Square root of (5). The filter has been designed for the Doppler rate of fdTs = 0.2. The higher rate is achieved by interpolating the channel coefficientsItimes using polyphase interpolator. For the Fade Rate (fdTs ) of 0.01, the value ofI = 20 is taken. For the maximum Doppler frequency of 160 Hz the channel sampling rate is set to 16 kHz.
The maximum Doppler frequency is configurable and is set using LCD Keypad interfacing of TMS320C6713 DSK (MCBSP1 port). This can go up to 480 Hz. For a single emulator run, it will remain unchanged. The filter coeffi-cients are computed on the base of normalized Doppler frequency. The algorithm for filter coefficient generation uses fade rate (fdTs) of 0.01. For 160Hz Doppler the Sam-pling frequency (Filter coefficient update rate is 16 KHz).
0 0.1 0.2 0.3 0.4 0.5 0.6 0.7 0.8 0.9 1
−100 −80 −60 −40 −20 0 20
Frequency Response of IIR Filter For a=1, q=0.5
Normalized Frequency
H(f) in dB
Designed Theoretical
−0.50 0 0.5 1 1.5 2 2.5 0.2
0.4 0.6 0.8 1 1.2 1.4 1.6 1.8 2
Tap Delay (tau) in usec)
Magnitude |h|
A Multipath Channel
Figure 11Channel magnitude impulse response.
This means if the Doppler frequency is increased the sampling frequency will also be increased in the same pro-portion so as to make the fade rate constant. The increase in sampling frequency means MCBSP0 port data rate will be increased. This rate is software configurable and can be set by changing the value of Sample Rate Generator Regis-ter (SRGR) of the MCBSP0 port. The upper limit depends upon the complexity of the Channel coefficient genera-tion algorithm and number of taps. For 8 taps, it is 480 Hz and this can be increased if we further optimize the chan-nel generation code using some optimization techniques (reducing mathematical complexity and efficient use of DSP resources).
The interpolator is implemented as a polyphase filter with a windowedsinc(.)function impulse response. The algorithm for channel coefficient generation is modified in order to consider the generalized cases. Figures 8, 9, 10
0 10 20 30 40 50 60 70 80
−0.5 −0.4 −0.3 −0.2 −0.1
0
0.1 0.2 0.3 0.4 0.5
Input Data
time in usec
Input Amplitude
Figure 12Input data on both I and Q channel.
0 200 400 600 800 1000
0 0.1 0.2 0.3 0.4 0.5 0.6 0.7 0.8 0.9 1
Normalized Absolute values MATLAB and Fixed Point Output
MATLAB ASM
Figure 13TDL filter output magnitude plot.
show the frequency response of the modified PSD under different values ofa=(0, 0.5, 1),q=(1.0, 0.5, 0.3),A=0 andσ2>0.
4 Results and comparison
A TDL filter with N taps is modeled here as a frequency selective multipath channel. Each tap is complex having defined location. The channel is assumed static for one buffer period of time. Both C and assembly functions were executed forL= 1024 I/O buffer size, data sampling fre-quencyFs= 12.5MHzandN = 8 taps filter coefficients having values h={1.8362 0.5073i, 0.2169 + 0.0915i, -0.1448 + 0.1585i, -0.2169 + 0.0915i, 0.0, 0.0, 0.0, 0.0}with corresponding tap locations at{0, 0.5, 1, 1.6, 1.8, 1.9, 2.0, 2.1} usec. The magnitude response|h| of the channel is shown in Figure 11.
0 10 20 30 40 50 60 70 80
−200 −150 −100 −50 0 50 100 150 200
time in usec
Phase in degree
Phase values MATLAB and Fixed Point Output
MATLAB ASM
0 0.5 1 1.5 2 2.5 3 3.5 4 4.5 0
0.1 0.2 0.3 0.4 0.5 0.6 0.7 0.8 0.9
Amplitude
P(x)
Amplitude PDF Plots
Theoretical a=1 q=0.3 Simulator a=1 q=0.3 Theoretical a=0.5 q=0.5 Simulator a=0.5 q=0.5 Theoretical a=0 q=1.0 Simulator a=0 q=1.0
Figure 15PDF plot for amplitude.
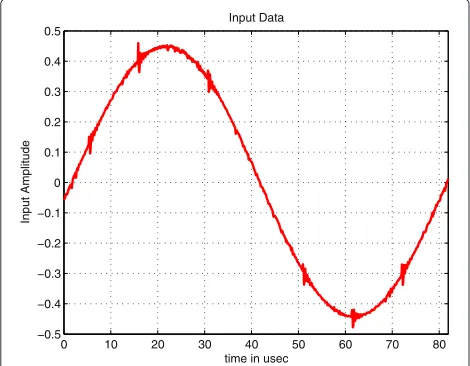
Most V2V systems operate in frequency range 5-5.9 GHz [57]. Bwang et el [65] and Matolak et el [66] used 5.15 and 5.2 GHz carrier frequencies to simulate the V2V channel. Hence, the simulation was run with the follow-ing parameters, carrier frequencyfc=5.8GHz, velocity of receiverV1 = 30km/hrwhich meansfm1 = 160Hz, LOS
componentA = 0 for Hoyt model, three different values ofq=1, 0.5, 0.3 and three different values ofa=0, 0.5, 1. The sinusoidal input shown in Figure 12 is applied on both I & Q channels. The output of both were found exactly match with each other. For fixed point C code, it takes 1460 cycles per sample to generate output whereas the optimized code gives output in 16 cycles per sample.
−40 −30 −20 −10 0 10
10−4
10−3
10−2
10−1
100
101
Normalized Amplitude in dB
LCR (Nr)
Level Crossing Rate Plots
Theoretical a=1 q=0.3 Simulator a=1 q=0.3 Theoretical a=0.5 q=0.5 Simulator a=0.5 q=0.5 Theoretical a=0 q=1.0 Simulator a=0 q=1.0
Figure 17PDF plot for LCR.
From (8), the maximum excess delayτmaxthe system can have is found to be 81.92 usec.
A comparison has been made for a given complex input between the outputs of the MATLAB complex FIR filter code with the fixed point assembly code and are shown in Figure 13 (Magnitude plot) and Figure 14 (Phase plot). The number of taps assumed are N = 8 with buffer sizeL = 1024 . For C6416 DSP operating at 1GHz, the cycle time becomes 1ns hence proposed algorithm will take around 16nsper sample which means that data with around 60MHzsampling frequency can be processed.
In order to verify the channel coefficient generation, the performance analysis of the Channel has also been
−4 −3 −2 −1 0 1 2 3 4
0 0.1 0.2 0.3 0.4 0.5 0.6 0.7
Phase in radians
P(x)
Phase PDF Plots
Theoretical a=1 q=0.3 Simulator a=1 q=0.3 Theoretical a=0.5 q=0.5 Simulator a=0.5 q=0.5 Theoretical a=0 q=1.0 Simulator a=0 q=1.0
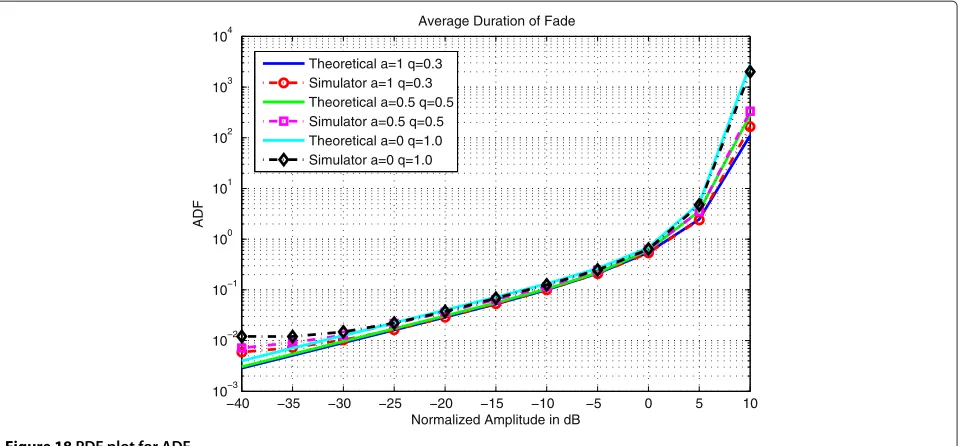
−40 −35 −30 −25 −20 −15 −10 −5 0 5 10 10−3
10−2 10−1 100 101 102 103 104
Normalized Amplitude in dB
ADF
Average Duration of Fade
Theoretical a=1 q=0.3 Simulator a=1 q=0.3 Theoretical a=0.5 q=0.5 Simulator a=0.5 q=0.5 Theoretical a=0 q=1.0 Simulator a=0 q=1.0
Figure 18PDF plot for ADF.
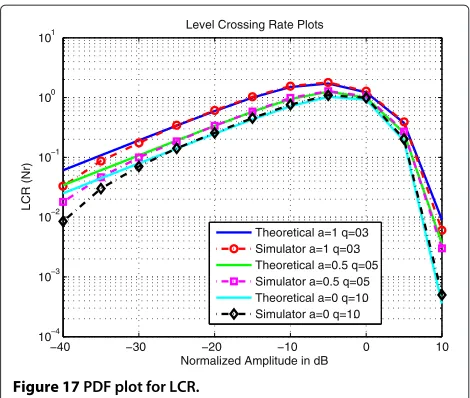
done. The BPSK modulated data is applied at the input of the single tap channel and the output and Channel coefficients (400k samples) are stored in theSDRAM of TMS320C6416 DSP Board in real time. Since perfor-mance analysis is independent of data rate and sampling frequency, hence due to the limited size ofSDRAMthe sampling rate was set to 2 MHz and the input data rate to 200 kbps. The amplitude and phase Probability Den-sity Function (PDF), Level Crossing rate (LCR), Average
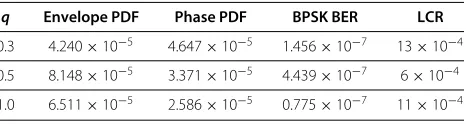
Duration of Fade (ADF) and Bit Error Rate (BER) plots are shown in the Figure 15, 16, 17, 18, 19 respectively. The plots are found to be closely matched with the cor-responding theoretical plots. Mean square error (MSE) between the theoretical and simulated values of the ampli-tude, phase PDF, BER curves and LCR are shown in Table 4.
The proposed simulator is also compared with the one described in [67]. There is a significant difference between
−4 −2 0 2 4 6 8
10−2 10−1 100
Eb/No
BER
BPSK BER Fs=2e6 Fb=200e3
Theoretical q=0.3 Simulator q=0.3 Theoretical q=0.5 Simulator q=0.5 Theoretical q=1.0 Simulator q=1.0
Table 4 MSE of various quantities for a = 0.5
q Envelope PDF Phase PDF BPSK BER LCR
0.3 4.240×10⁻⁵ 4.647×10⁻⁵ 1.456×10⁻⁷ 13×10−4
0.5 8.148×10⁻⁵ 3.371×10⁻⁵ 4.439×10⁻⁷ 6×10⁻⁴
1.0 6.511×10⁻⁵ 2.586×10⁻⁵ 0.775×10⁻⁷ 11×10−4
the philosophies of the two simulators. The simulator described in [67] requiring measured impulse response, generates channel coefficients from the measured chan-nel transfer function. These chanchan-nel coefficients operate on the information data to deliver performance in terms of error rate. This simulator essentially requires in field measurements. The proposed simulator does not require measured in-field data but uses the statistical models available in published standards, thus saving significantly on the cost of expensive field trials. The proposed simula-tor operates on the statistical parameters to generate real time channel coefficients, which then operate on the infor-mation data to generate performance in terms of error rates. The developed simulator can be used to operate on the in-field channel data provided we augment this sim-ulator with a facility to convert the stored channel data into channel coefficients or channel statistics. It should be borne in mind that our interest has been to replace field environment by laboratory environment and by various options on choices of channel character.
5 Conclusion
In this paper, design and implementation of an efficient real time wideband simulator has been discussed. The simulator was run in real time with a known input and the output data was analyzed. The TDL filter has been opti-mally implemented over TMS320C6416 DSP. The output of the filter has been verified by comparing the simulator output with MATLAB. The pipelined architecture of the processor and the circular buffer have been efficiently uti-lized. The channel coefficients have been generated and analyzed. The BPSK modulated data has been input and the output has been stored. The bit error rate has been measured and compared with the theoretical data to verify the validity of the channel simulator.
Competing interests
The authors declare that they have no competing interests.
Authors’ contributions
DSP based wideband real time simulator has been developed that is based on Nakagami Hoyt V2V channel model and is flexible to simulate the other channel models by just changing the parameters. Both authors read and approved the final manuscript.
Acknowledgements
The authors would like to acknowledge the support provided by King Abdulaziz City for Science and Technology (KACST) through the Science and Technology Unit at King Fahd University of Petroleum and Minerals (KFUPM)
for funding this work through project No. NSTP08-ELEC42-4 as part of the National Science, Technology and Innovation Plan (NSTIP).
Received: 1 May 2012 Accepted: 25 October 2012 Published: 1 December 2012
References
1. K Bullington, Radio propagation variations at VHF and UHF. Proc. IRE.
32, 27–32 (1950)
2. JJ Egli, Radio propagation above 40 MHz over irregular terrain. Proc. IRE .
45(10), 1383–1391 (1957)
3. WC Jakes, DO Reudink, Comparison of mobile radio transmission at UHF and X band. Vehicular Technol. IEEE Trans.16, 10–14 (1967)
4. PM Trifonov, VN Buelko, VS Zotov, Structure of USW field strength spatial fluctuations in a city. Trans. Telecomm. Radio Eng.9, 26–30 (1964) 5. Y Okamura, YA Kol, Field strength and its variability in VHF and UHF
land-mobile radio service. Rev. Elec. Comm. Lab.9-10, 825–873 (1968) 6. GL Turin, FD Clapp, TL Johnston, SB Fine, D Lavry, A statistical model of urban multipath propagation. IEEE Trans. Veh Technol.21, 19 (1972) 7. DM Black, DO Reudink, Some characteristics of mobile radio propagation
at 836 MHz in the Philadelphia area. Vehicular Technol. IEEE Trans.
21, 45–51 (1972)
8. D Cox, Delay Doppler characteristics of multipath propagation at 910 MHz in a suburban mobile radio environment. Antennas Propagation. IEEE Trans.20, 625–635 (1972)
9. D Cox, Time- and frequency-domain characterizations of multipath propagation at 910 MHz in a suburban mobile-radio environment. Radio Sci.7, 1069–1077 (1972)
10. T Aulin, Characteristics of a digital mobile radio channel. Rev. Elec. Comm. Lab.30, 45–53 (1981)
11. SY Seidel, TS Rappaport, 914 MHz path loss prediction models for wireless communications in multifloored buildings. Rev. Elec. Comm. Lab.
40, 207–217 (1992)
12. DA Hawbaker, TS Rappaport, Indoor wideband radiowave propagation measurements at 1.3 GHz and 4.0 GHz. IEE Electron. Lett.26, 1800–1802 (1990)
13. U Dersch, J Troger, E Zollinger, Multiple reflections of radio waves in a corridor. IEEE Trans Antenna Propagation.42, 1571–1574 (1994) 14. F Babich, G Lombardi, Statistical analysis and characterization of the
indoor propagation channel. Rev Elec Comm Lab.48, 455–464 (2000) 15. X Zhao, J Kivinen, P Vainikainen, K Skog, Propagation characteristics for
wideband outdoor mobile communications at 5.3 GHz. IEEE J Selected Areas Commun.20, 507–514 (2002)
16. N Youssef, CX Wang, M Patzold, A study on the second order statistics of Nakagami-Hoyt mobile fading channels. IEEE Trans Vehicular Technol.
54, 1259–1265 (2005)
17. SO Rice, Statistical properties of a sine wave plus random noise. Bell Syst J.
27, 109–157 (1948)
18. RS Hoyt, Probability functions for the modulus and angle of the normal complex variate. Bell Syst J.26, 318–359 (1947)
19. M Nakagami,The m-distribution - A General Formula of Intensity Distribution of Rapid Fading. (Permagon Press, Oxford, 1960)
20. MA Taneda, J Takada, K Araki, inIEEE International Symposium on Personal, Indoor, and Mobile Radio Communications. A new approach to fading (Weibull model, 1999), pp. 711–715
21. F Hansen, FI Meno, Mobile fading-Rayleigh and lognormal superimposed. IEEE Trans. Veh Technol.36, 332–335 (1977)
22. R Mangharam, J Meyers, R Rajkumar, Stancil D, inProceedings of Society for Automotive Engineers (SAE) World Congress. A multi-hop mobile networking test-bed for telematics (Detroit, USA, 2005) 23. J Dulmage, M Tsai, M Fitz, Daneshrad B, inProceedings of the 1st
international workshop on Wireless network testbeds, experimental evaluation & characterization. COTS-based DSRC testbed for rapid algorithm development, implementation, and test (WINTECH ’06, New York, USA, 2006)
24. TM Fernandez, JA Garcya, ML Gonzalez, L Castedo, inProceedings of 8th International Conference on ITS Telecommunications, 2008. ITST 2008. FlexVehd: a flexible test bed for vehicular radio interfaces (Hilton Phuket, Thailand, 2008), pp. 283–287
26. RC Fitting, Widebandtroposcatterradiochannelsimulator Trans. IEEE Commun. Technol.15, 565–570 (1975)
27. JR Ball, A real-time fading simulator for mobile radio. Radio Electron. Eng.
52, 475–478 (1982)
28. M Lecours, F Marceau, Design and implementation of channel simulator for wideband mobile radio transmission. In Proc. Vehicular Technol. Conf. (VTC).2, 652–655 (1989)
29. RA Comroe, F Marceau, All-digital fading simulator. In Proc. Nut. Electron Conf.32, 136–139 (1978)
30. RA Goubran, HM Hafez, AUH Sheikh, Real-time programmable land mobile channel simulator. Vehicular Technol. Conf., 1986 36th IEEE.
36, 215–218 (1986)
31. JF An, AMD Turkmani, JD Parson, Implementation of a DSP-based frequency non-selective fading simulator. Fifth Int. Conf. Radio Receivers Assoc. Syst, 20–24 (1990)
32. PJ Cullen, PC Fannin, A Garvey, Real-time simulation of randomly time-variant linear systems: the mobile radio channel. IEEE Trans. Instrum. Meas.43, 583–591 (1994)
33. XF Chen, KS Chung, Generation of noise sources for a digital frequency selective fading simulator. Int. Symp. Signal Process. Appl., ISSPA.
2, 463–466 (1996)
34. AK Salkintzis, Implementation of a digital wide-band mobile channel simulator. Broadcasting. IEEE Trans.45, 122–128 (1999)
35. JR Papenfuss, MA Wickert, Implementation of a real-time, frequency selective, RF channel simulator using a hybrid DSP-FPGA architecture. IEEE Radio Wireless Conf., 2000.49, 135–138 (2000)
36. S Fischer, R Seeger, KD Kammeyer, Implementation of a real-time satellite channel simulator for laboratory and teaching purposes. The Third European DSP Education & Research Conference (2000). [http://www.ti. com/europe/docs/univ/docs/info.htm]
37. C Komninakis, A Fast, Telecommunications, accurate rayleigh fading simulator. Global Conf., 2003. GLOBECOM ’03. IEEE.6, 3306–3310 (2003) 38. M Khars, C Zimmer, Digital signal processing in a real time propagation
simulator. IEEE Trans. Instrum Meas.55, 197–205 (2006)
39. S Kandeepan, ADS Jayalath, inProceedings of International Conference on Communication Systems, 2006. ICCS 2006. 10th IEEE Singapore.
Narrow-band channel simulator based on statistical models
implemented on Texas instruments C6713 DSP and national instruments PCIE-6259 hardware, (Singapore, 2006), pp. 1–6
40. A Ghazel, E Boutillon, JL Danger, G Gulak, H Laamari, Design and performance analysis of a high speed AWGN communication channel emulator. IEEE Pac. Rim Conf. Commun., Comput. Signal Process.
1, 374–375 (2001)
41. F Sattar, M Mufti, DD Stancil, P Steenkiste, inProceedings of the 16th International Conference on Microelectronics, 2004. ICM 2004. VLSI architecture of Rayleigh fading simulator based on IIR filter and polyphase interpolator, (Tunisia, 2004), pp. 291–294
42. S Picol, G Zaharia, GE Zein, Towards the development of a hardware simulator for MIMO radio channels. ignals. Circuits Syst. 2005. ISSCS 2005. Int. Symp. 2005,1, 115–118 (2005)
43. S Picol, G Zaharia, Houzet, GE Zein, inProceedings of IEEE 68th Vehicular Technology Conference, 2008. VTC 2008-Fall. Hardware simulator for MIMO Radio channels: design and features of the digital block, (Alberta, 2008), pp. 1–5
44. F Carames, M Gonzalez-Lopez, L Castedo, in9th International Conference on Intelligent Transport Systems Telecommunications, (ITST). FPGA-based vehicular channel emulator for evaluation of IEEE 802.11p transceivers, (Lille, France, 2009), pp. 592–597
45. KC Borries, G Judd, DD Stancil, P Steenkiste, FPGA-Based channel simulator for a wireless network emulator. IEEE Vehicular Technol Conf, 1–5 (2009) 46. AS Akki, F Haber, A statistical model for mobile-to-mobile land
communication channel. IEEE Trans. Veh. Technol.35, 2–7 (1986) 47. AS Akki, Statistical properties of mobile-to-mobile land communication
channels. IEEE Veh. Technol. Conf.43, 826–831 (1994)
48. DW Matolak, I Sen, X Wenhui, NT Yaskoff, 5 GHZ wireless channel characterization for vehicle to vehicle communications. Mil. Commun. Conf.5, 3016–3022 (2005)
49. R Wang, D Cox, Channel modeling for adhoc mobile wireless networks. Proc IEEE Veh. Technol. Conf.1, 21–25 (2002)
50. CS Patel, GL Stuber, TG Pratt, Simulation of Rayleigh faded
mobile-to-mobile comimunication channels. Vehicular Technol. Conf. 2003. VTC 2003-Fall. 2003 IEEE 58th.1, 163–167 (2003)
51. A Petrolino, J Gomes, G Tavares, inIEEE Vehicular Technology Conference, 2008. A Mobile-to-Mobile Fading Channel Simulator Based on an Orthogonal Expansion (VTC Spring 2008, Marina Bay, Singapore, 2008), pp. 366–370
52. KC Borries, DD Stancil, inIEEE 65th, Vehicular Technology Conference, 2007. VTC2007-Spring. Effcient Simulation of Mobile-To-Mobile Rayleigh Fading using Gaussian Quadrature, (Dublin, Ireland, 2006), pp. 534–538 53. AG Zaji, GL Stuber, A new simulation model for mobile-to-mobile
Rayleigh fading channels. Wireless Commun. Networking Conf., 2006. WCNC 2006. IEEE.3, 1266–1277 (2006)
54. MI Akram, AU Sheikh, inWireless Communications and Networking Conference Workshops (WCNCW), 2012 IEEE. Modeling Nakagami Hoyt mobile to mobile fading channel with diffused line of sight, (Paris, France, 2012), pp. 398–403
55. AS Akki,Modeling and characterization of land mobile communication. PhD thesis. (Uniersrsity of Pennsilvenia, Department of Electrical Engineering, Philadelphia, Pennsylvania, United States, 1977)
56. CF Mecklenbrauker, AF Molisch, J Karedal, F Tufvesson, A Paier, L Bernado, T Zemen, O Klemp, N Czink, Vehicular channel characterization and its implications for wireless system design and performance. Proc. IEEE.
99, 1189–1212 (2011)
57. A Molisch, F Tufvesson, J Karedal, C Mecklenbrauker, A survey on vehicle-to-vehicle propagation channels. Wireless Commun., IEEE.
16, 12–22 (2009)
58. AK Papazafeiropoulos, SA Kotsopoulos, An extended generalized rice model for wireless communications. Vehicular Technol. IEEE Trans.
59, 2604–2609 (2010)
59. DW Matolak, I Sen, W Xiong, inMobile and Ubiquitous Systems Workshops, 2006. 3rd Annual International Conference. Channel modeling for V2V communications, (San Jose, California, 2006), pp. 1–7
60. Documentation package of ORS-114 Wide bandwidth Microline Analog peripheral card. Version 1.0 2005
61. Texas Instrument web site. [http:\www.ti.com]
62. SPRA455A, Using the TMS320C6000 MCBSP as a High Speed Communication Port. Texas Instruments (2001)
63. SPRA645A, Circular Buffering on TMS320C6000. Texas Instruments (2001) 64. SPRU198G, TMS320C6000 Programmer’s Guide. Texas Instruments (2002) 65. B Wang, I Sen, DW Matolak, inIEEE 66th, Baltimore, Vehicular Technology
Conference, VTC-2007 Fall. Performance evaluation of 802.16e in vehicle to vehicle channels, MD, USA, 2007), pp. 1406–1410
66. I Sen, DW Matolak, V2V Channels and performance of multi-user spread spectrum modulation. Proc. IEEE 1st Intx’l. Symp, Wireless Vehic. Commun.2, 19–25 (2007)
67. K Khokhar, S Salous, Frequency domain simulator for mobile radio channels and for IEEE 802.16-2004 standard using measured channels. Commun, IET.2, 869–877 (2008)
doi:10.1186/1687-1499-2012-359