Wireless Base Station With Reduced Crest Factor
Parmish Kumar1,Vijay Maheshwari2
Shobhit University Meerut
Abstract:In this paper computationally efficient signal shaping strategy is developed that can be used to substantially reduce the PAPR in multiband transmitters. In this report, we provide mathematical framework for design and analysis of PAPR reduction for multi-band transmitters. This paper addresses the problem of crest factor reduction ICFR) in multi-carrier WCDMA systems. A trade-off analysis for design and optimization of the PAPR reduction algorithm within the context of the error vector magnitude (EVMI and adjacent channel leakage ratio (ACLR) quality metrics are discussed.MC-CDMA is currently being investigated by many researchers as a promising candidate for future generations of wireless systems due to robustness to frequency selective fading, high spectral efficiency, and higher flexibility. However, the main drawback is the high Peak to Average Power Ratio (PAPR). In this paper, a method has been proposed to reduce PAPR in synchronous MCCDMA.
INTRODUCTION:CREST FACTOR
The Crest Factor is equal to the peak amplitude of a waveform divided by the RMS value[1,2]. The purpose of the crest factor calculation is to give an analyst a quick idea of how much impacting is occurring in a waveform. Impacting is often associated with roller bearing wear, cavitations and gear tooth wear.
In a perfect sine wave, with amplitude of “1”, the RMS value
[image:2.612.50.265.468.603.2]is equal to .707, and the crest factor is then equal to 1.41. A perfect sine wave contains no impacting and therefore crest factors with a value higher than 1.41 imply that there is some degree of impacting.
Fig. 1: Definition of crest factor
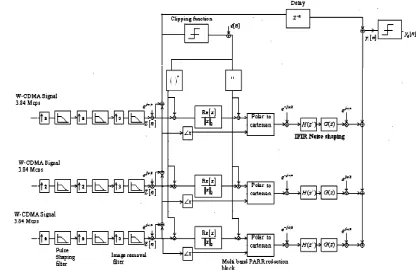
The transmit signal in multi-band transmitters is comprised of baseband signals occupying no overlapping frequency bands. Often in practice, the base-band signals are generated through adding independent random variables that tend to have Gaussian distribution in the limit. The WCDMA transmitters consist of 64 sequences with known timing offset and power.
As shown in the Figure 1.1 the peak to average ratio (PAPR) of this sequence can reach values close to 12 dB. From practical perspectives, PAPR of the signal prior to DAC should lie within the range of 5 to 8 dB to assure reasonable power consumption in the RF and analog components.
To overcome this shortcoming, standards (such as 3GPP) usually allow limited distortions of the transmit signal [2]. At expense of adding some distortions to the transmit signal, the PAPR of the signal can be reduced to an admissible range. However, the distorted transmit signal should conform to the spectral emission mask of the transmitter (SEMT). ACLR is a relative measure of spectral leakage into the adjacent channels. More specifically, it reflects the relative power of the signal within the band of interest to that of transmitter induced noise in the neighbouring band. Specific to the WCDMA systems, Vaananen ET. Al. has proposed PAPR reduction algorithms for WCDMA systems using unused sub-channels.
Complementary CDF v/s Probability
[image:2.612.346.563.524.631.2]20log10 (x / sigma x Ì)
AN D E N G I N E E R I N G T E C H N O L O G Y (I J R A S E T)
Page 378
[image:3.612.48.265.497.590.2]THE CREST FACTOR OF A MODULATED RF SIGNAL: The crest factor CF of a signal is computed, for example, from the ratio of the peak voltage Û to the RMS value U. For a sinusoidal signal, we obtain a crest factor CF of √2 or 3.01 dB using the familiar ratio Û/U of √2. For information transmission using (wireless) telecommunications systems, a sinusoidal signal (carrier) is modulated by a baseband signal that contains the desired information. If the modulation causes a change in the amplitude of the carrier, the crest factor increases as well. The variation vs. time of this carrier amplitude is known as the "envelope" for modulated signals. For a modulated RF signal, we can determine two different crest factors that differ by 3.01 dB [4] depending on the approach we use: The first possibility involves determining the crest factor based on the highest amplitude peak that occurs in the modulated carrier signal and the RMS value. We will refer to this as the "carrier approach" from now on since it takes the RF carrier into account in addition to the envelope. This is important when dimensioning transmitter components since the highest occurring peak voltage is critical when it comes to determining the dielectric strength. The second way of determining the crest factor involves taking the ratio of the peak value of the modulation envelope to its RMS value. We will call this the "envelope approach" from now on. The crest factor determined in this manner produces a result that is lower by the magnitude of the crest factor for the sinusoidal carrier (i.e. 3.01 dB) compared to the carrier approach. This approach is important when we are considering the operation of an amplifier in the RF range or a D/A converter in the baseband, for example. Specification of the crest factor alone does not mean anything. We must also always indicate the approach we are using or the computation method.
Fig. 3: Voltage and power of a CW signal into a 50 Ω load
PROBLEM FORMULATION
APROFUSION and variety of communication systems, which carry massive amounts of data between terminals and end users of many kinds, exist today. Necessitated by the global compliant requisition, original equipment manufacturers are expected to provide convergent solutions that accommodate
various standards within a single embodiment. Primitive solutions may seek to support this necessity by the simple
expedient of “stacked” structures, i.e., separate transceivers
for different standards. Such systems, however, achieve the desired convergence with the least expendable resources: hardware. Silicon real estate and product turn over time. This necessity represents a major bottleneck in attempting to achieve higher levels of integration in broadband communication systems. For instance commercial wireless chip manufacturers often offera multi-chip solution to encompass the multi-channel digital up-conversion (DUC) processing requirements for the digital front-end of the wireless base stations (BSs). These multi-chip solutions often result in higher integration overhead that translates into higher capital expenses. In contrast, reconfigurable architectures provide flexible and integrated system-on-chip solutions that accommodate smooth migration from archaic to innovative designs, allowing recycling of hardware resources across multiple generationsof the standards. Moreover, using this topology, the network providers have the ability to configure the digital front-end based on demand and integrate all the transmit/receive functionalities into a unified and custom-built hardware platform. [5,9]. As opposed to the application-specific integrated circuits or application-application-specific standard products (ASSP) solutions with fixed support for the carriers per chip-set, users can configure the field-programmable gate array (FPGA) platforms to accommodate arbitrary number of carriers based on demand, reducing the cost per carrier metric. These requirements have created a surge in the development of radio architectures and reconfigurable platforms that support multiple standards for the digital front-end of wireless BSs.
[image:3.612.333.542.502.637.2]Page 379
[image:4.612.46.265.186.345.2]At expense of adding some distortions to the transmit signal, the PAPR of the signal can be reduced to an admissible range. However, the distorted transmit signal should conform to the spectral emission mask (SEM) of the transmitter. Adjacent channel leakage ratio (ACLR) is a relative measure of spectral leakage into the adjacent channels.
Fig. 5: RRC filter magnitude response
CREST FACTOR MEASUREMENT AND REDUCTION: are inherently nonlinear. The nonlinearity generates spectral regrowth, which leads to adjacent channel interference and violations of the out-of-band emission requirements mandated by regulatory bodies. It also causes in-band distortion, which degrades the bit error rate (BER) performance. To reduce the nonlinearity, the power amplifier can be backed off to operate within the linear portion of its operating curve. However, newer transmission formats, such as wideband code division multiple access (WCDMA) and orthogonal frequency division multiplexing (OFDM), have high peak to average power ratios, i.e., large fluctuations in theirsignal envelopes. This means that the power amplifier needs to be backed off far from its saturation point, which results in very low efficiencies, typically less than 10% ; i.e., more than 90% of the dc power is lost and turns into heat. With periodic signals, it is possible to determine the crest factor by measuring the peak and average or RMS values of the voltage or power using for example, a state-of-the-art power meter or oscilloscope. If the signal is measured for the duration of one period, it is possible to completely measure the peak value as well as the RMS value, assuming the test equipment has sufficient speed for this task. This is not the case with signals with random modulation such as an OFDM or DVB-T signal. While the average value of a DVB-T transmitter can be
determined precisely in only a few seconds using a thermal power meter, the magnitude of the peak value is highly dependent on the measurement time. With high crest factors, the signal peaks are rarer, so that it is necessary to specify the crest factor that was determined along with the measurement interval or the number of samples.
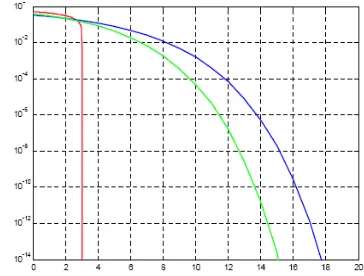
When generating an OFDM signal, an amplitude distribution arises in the baseband for the I and Q signals that is approximately normal in statistical terms. In other words, the I and Q signals resemble white noise. Based on the magnitude of the complex time-domain signal i(t) + jq(t), the envelope is formed during modulation onto an RF carrier. Here, the amplitudes will have a Rayleigh distribution as an approximation. The probability of occurrence of high signal peaks is significantly less with a Rayleigh distribution than with a normal distribution. However, if we use the carrier approach on the OFDM-modulated RF signal to statistically evaluate the amplitudes, we will again obtain normal distribution due to the carrier oscillation. Fig. 3 shows a comparison of the CCDF for white noise (normal distribution) and for a Rayleigh distribution which occurs for the envelope of an ideal DVB-T signal as an approximation. The CCDF of a sinusoidal signal is also shown using the carrier approach. For a sinusoidal voltage, the peak value Û is greater than the RMS value U by a factor of √2, i.e. the sinusoidal signal has a crest factor Û/U of 3.01 dB. No higher signal values occur, i.e. their probability is 0.k in dB above average.
Fig. 6: CCDF for a sinusoidal signal (carrier approach), an OFDM envelope signal and for white noise
[image:4.612.343.525.441.579.2]AN D E N G I N E E R I N G T E C H N O L O G Y (I J R A S E T)
RESULTS AND DISCUSSION
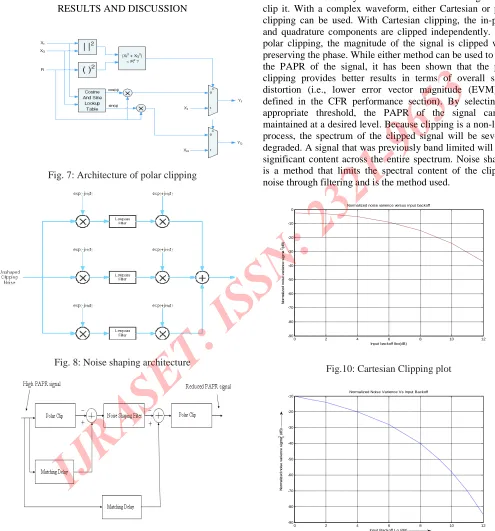
Fig. 7: Architecture of polar clipping
Fig. 8: Noise shaping architecture
Fig. 9: Crest factor reduction block diagram
[image:5.612.48.543.117.648.2]The most obvious way to reduce the PAPR of a signal is to clip it. With a complex waveform, either Cartesian or polar clipping can be used. With Cartesian clipping, the in-phase and quadrature components are clipped independently. With polar clipping, the magnitude of the signal is clipped while preserving the phase. While either method can be used to limit the PAPR of the signal, it has been shown that the polar clipping provides better results in terms of overall signal distortion (i.e., lower error vector magnitude (EVM), as defined in the CFR performance section). By selecting an appropriate threshold, the PAPR of the signal can be maintained at a desired level. Because clipping is a non-linear process, the spectrum of the clipped signal will be severely degraded. A signal that was previously band limited will have significant content across the entire spectrum. Noise shaping is a method that limits the spectral content of the clipping noise through filtering and is the method used.
Fig.10: Cartesian Clipping plot
Fig. 11: Polar Clipping plot
0 2 4 6 8 10 12
-90 -80 -70 -60 -50 -40 -30 -20 -10 0
Input backoff Ibo(dB) Normalized noise varience versus input backoff
0 2 4 6 8 10 12
-90 -80 -70 -60 -50 -40 -30 -20 -10
Normalized Noise Varience Vs Input Backoff
Page 381
We note that PAPR0of the clipped signal is a monotonically
increasing function of Ib0. As we will show in the subsequent
sections, shaping the noise spectrum would cause the PAPR0
function to have local minima with respect to Ib0, destroying
[image:6.612.65.293.202.570.2]this monotonic behavior. Fig.11 depicts the marginal pdf of the clipped signal as a function of the back-off threshold for polar clipping.
Fig. 12: Impact of noise on PAPR
Fig. 13: Clipping Ratio V/s Probability of Clip Plot
Conclusion:
A new CFR algorithm is proposed which reduces the system complexity and improves the system performances, in terms of EVM, ACLR PAPR. Simulation result validates the proposed method compresses the PAPR by over 3 db for the three carrier WCDMA system application. Clipping filtering based techniques were demonstrated to have a superior
performance compared to PW technique when two or more stages are utilized. The technique is simple to implement in hardware and is modulation and coding independent. Further efficiency enhancement is achievable through linearization. The result shows that for a low ACLR specification of -45dB, CFR achieved up to 29%power efficiency.
REFERENCES
1. NavidLashkarian, Helen Tarn, Chris Dick,Senior Member, IEEE, Reconfigurable Digital Front-End Hardware for Wireless Base-Station Transmitters: Analysis, Design and FPGA Implementation, 2007. 2. KasyapYadavelli, DimitriosEfstathiou, Manish Manglani,
crest factor reduction engine for multi-carrier wcdma transmitted signals.2006.
3. Ning Chen and G. Tong Zhou,Georgia Institute of Technology, Atlanta, distortionless crest factor reduction for forward link cdma.2004.
4. Wan-Jong Kim, Kyoung-Joon Cho, Shawn P. Stapleton, Jong-Heon Kim, An efficient crest factor reduction technique for wideband applications 2001.
5. J. Vankka, J. Ketola, O. Väänänen, J. Sommarek, M.
Kosunen and K. Halonen, "A GSM/EDGE/WCDMA Modulator with On-Chip D/A Converter for Base Station," ISSCC Digest of Technical Papers, February 3 - 7, 2002, San Francisco, USA, pp. 236-237.
6. P. B. Kenington, High-Linearity RF Amplifier Design, Artech House, 2000.
7. Yang Hong-Kui, Method &apparatus for reducing the peak power probability of a spread spectrum signal, European patent application, EP1058400A2, 2000. 8. S. C. Cripps, Advanced Techniques in Power Amplifier
Design, Artech House, 2002.
9. R. Creighton, System and method to reduce the peak-to-average power ratio in a DS-CDMA transmitter, European patent application, EP0940925A1, 1999. 10. R. Creighton, System and method to reduce the
peak-to-average power ratio in DS-CDMA transmitter, European patent application, EP0940925A1, 1999.
11. M. Pauli and H.-P, Kuchenbecker, "Minimization of the Intermodulation Distortionof a Nonlinearly Amplified OFDM Signal," Wireless Personal Communications 4, 1996, pp. 90-101.
12. O. Väänänen, J. Vankka and K. Halonen, "Simple
Algorithm for Peak Windowing and its application in GSM, EDGE and WCDMA systems", IEE Proceedings Communications, Vol. 152, No. 3, June 2005, pp. 357-362.
0 2 4 6 8 10 12
5 6 7 8 9 10 11 12 13
Input backoff (Ibo) Output PAPRo versus PAPRi and Ibo
PAPRi=12dB
0 2 4 6 8 10 12
10-6 10-5 10-4 10-3 10-2 10-1 100
Prabability of Clip Vs Clipping Ratio
AN D E N G I N E E R I N G T E C H N O L O G Y (I J R A S E T)
Page 382


![(+) (1S,5R,6R) 6 [(S) 1 Hydroxy 2 (methoxymethyloxy)ethyl] 1 methyl 3 trichloromethyl 2 aza 4,7 dioxabicyclo[3 3 0]oct 2 en 8 one](data:image/gif;base64,R0lGODlhAQABAIAAAP///wAAACH5BAEAAAAALAAAAAABAAEAAAICRAEAOw==)