R E S E A R C H
Open Access
An application of data envelopment analysis
on marble factories
Sinan Saraçli
1*, ˙Ibrahim Kiliç
2, ˙Ilkay Do ˘gan
2and Cengiz Gazelo ˘glu
1*Correspondence: [email protected]
1Department of Statistics, Faculty of Art and Science, Afyon Kocatepe University, Afyonkarahisar, TR-03200, Turkey
Full list of author information is available at the end of the article
Abstract
Purpose:The purpose of this study is to examine the efficiencies of marble factories in Afyonkarahisar city via data envelopment analysis (DEA), which is a mathematical programming-based analysis.
Methods:In this study, the efficiencies of 64 marble factories in Afyonkarahisar city, the most famous city in terms of marble production in Turkey, were examined. DEA was used to determine efficient and non-efficient factories. DEA is a method for analyzing a set of organizational units in order to identify the efficient units so that they can become benchmarks or peers for the inefficient units in the set and can facilitate the spread of best practice in a cooperative system.
Results:In this study, the findings related to codes and current efficiencies of factories in the model of production, the operation functioning with different efficiencies and the benchmarks of non-efficient operations according to the production model were obtained. As an example of the results of the efficiency analyses, for factory code F7 employing 19 laborers to work more efficiently, it must decrease the number of laborers to 18. In addition, the sales rate in the internal market should be decreased from 50% to 46%, while the external sales rates are to be increased by 4%.
Conclusions:With this study we aimed to examine the efficiencies of marble factories in Afyonkarahisar city. We also give some recommendations to the
administrators of the factories for upgrading their production levels by summarizing the deficiencies of the factories, related with the results of the study. We hope that following these recommendations, the efficiencies of the factories will increase, and with increased and efficient productions, the importance of Afyonkarahisar city will be the highest in Turkey.
Keywords: data envelopment analysis; efficiency analysis; marble factories
Introduction
One of the main reasons that developed countries are economically strong is the ability of these countries to benefit from their natural resources in the best way possible. The fact that the amount and values of the European Community member countries are high in terms of world marble trade reflects this situation very well. These countries import mar-ble blocks from other countries and process incompletely processed marmar-ble slabs which are exported into the third world countries for added profits. % of the marble export in the world is carried out by six countries which are Italy, China, India, Spain, Brazil and South America has an important share. Out of these countries, while India, China, Brazil
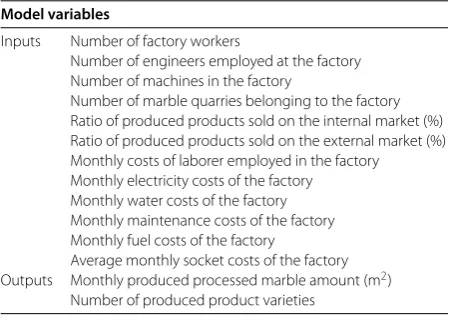
Table 1 Input and output variables used in the model of production
Model variables
Inputs Number of factory workers
Number of engineers employed at the factory Number of machines in the factory
Number of marble quarries belonging to the factory Ratio of produced products sold on the internal market (%) Ratio of produced products sold on the external market (%) Monthly costs of laborer employed in the factory
Monthly electricity costs of the factory Monthly water costs of the factory Monthly maintenance costs of the factory Monthly fuel costs of the factory
Average monthly socket costs of the factory Outputs Monthly produced processed marble amount (m2)
Number of produced product varieties
and Finland export raw marble blocks, Italy, Spain, Portugal, Canada, Greece and South Korea are exporters of processed marble [].
After the s the production of marble in Turkey has increased in a major way. Par-ticularly during the recent past, large companies have invested in integrated facilities, and with their inception there has been a significant increase in the production of processed marble. With the implementation of modern quarry production methods and state-of-the-art techniques, Turkey is among the seven leading large producers of natural stone in the world []. Turkey is the seventh largest producer of marble and natural stone in the world and ranks eighth in exports [].
The purpose of this study is to examine the efficiencies of marble factories in Afy-onkarahisar city via data envelopment analysis (DEA), which is a mathematical pro-gramming-based analysis.
Methods
In this study, the efficiencies of marble factories in Afyonkarahisar city, the most fa-mous city in terms of marble production in Turkey, were examined. Input and output variables used to examine of efficiencies of the factories according to the model of pro-duction are given in Table . In this study, data envelopment analysis (DEA) was used to determine the efficient and non-efficient factories.
DEA approach differentiates decision-making units (DMUs) into two groups: efficient DMUs and inefficient DMUs. A DMU is efficient if it obtains the maximum score of ; otherwise, it is inefficient. DEA also provides targets for inefficient units by improving in-puts and outin-puts proportionally. On the other hand, in some cases, it may be impossible for an inefficient DMU to improve all of the inputs or outputs proportionally at the same time in order to be efficient. For these types of situations, measure-specific data envelop-ment models can be used. Measure-specific models take sets of specific inputs or outputs of interest and give the target values for only those factors [].
take into account uncertainty including chance-constrained (CC) DEA, imprecise DEA (IDEA), Monte Carlo simulation and bootstrapping. The authors have used DEA to ana-lyze various real-world situations involving, for example, local government departments, bank branches, universities and public houses. In these and other applications, DEA has been used deterministically and any uncertainty in the situation has been handled only implicitly or by sensitivity analysis [].
DEA has generated a considerable amount of interest in the academic sector, and DEA practitioners have successfully applied the technique in assessing the efficiency of various organizations in the public and private sectors. However, managers and other decision-makers in these DMUs have not always welcomed DEA with a similar enthusiasm. This lukewarm reception may be partly due to the fact that DEA results are difficult to convey when the number of the decision variables exceeds beyond a certain point []. DEA is a non-parametric productive efficiency measurement method for operations with multiple inputs and multiple outputs [].
Data envelopment analysis (DEA) of Charnes, Cooper and Rhodes (CCR) model was de-veloped by Charneset al. [] to evaluate the efficiency of decision-making units (DMUs). The CCR model was further studied and extended by many other researchers [–]. As the DEA involves many DMUs, some researchers [–] have investigated the possible relationship between DEA and multiobjective linear programming (MOLP) [].
CCR DEA model
The DEA model developed by Charneset al. [] is a mathematical programming model that considers several inputs and outputs. This model assumesndecision-making units (DMUs), withminputs andpoutputs, where the efficiency evaluation model ofkth DMU can be defined as in the following equation () []:
Maxfk= p
r=uryrk m
i=vixik
,
s.t.fk= p
r=uryrk m
i=vixik
≤, l= , , . . . ,n,
ur≥ε, r= , , . . . ,p,
vi≥ε, i= , , . . . ,m,
()
where:
xil: theith input value forlth DMU
yrl: therth output value for thelth DMU
ur: the weight values of the output
vi: the weight values of the input,i
ε: and a very small positive value.
Obtaining the solution from equation () is difficult because it is a nonlinear program-ming problem. Charnes et al. [] transformed equation () into a linear programming problem by assumingmi=vixik= [].
Results and discussion
Table 2 Codes and efficiencies of factories
Factory code
Efficiency (%)
Factory code
Efficiency (%)
Factory code
Efficiency (%)
Factory code
Efficiency (%)
F1 100 F17 100 F33 100 F49 100
F2 100 F18 100 F34 100 F50 59
F3 100 F19 100 F35 9.23 F51 100
F4 100 F20 88.32 F36 100 F52 79.7
F5 100 F21 100 F37 100 F53 100
F6 100 F22 100 F38 100 F54 100
F7 94.4 F23 100 F39 100 F55 100
F8 100 F24 90.79 F40 100 F56 100
F9 100 F25 100 F41 100 F57 100
F10 100 F26 100 F42 46.15 F58 100 F11 41.52 F27 100 F43 70.16 F59 35.9
F12 52.7 F28 100 F44 100 F60 100
[image:4.595.164.430.315.395.2]F13 68.09 F29 100 F45 100 F61 100 F14 46.81 F30 36.80 F46 100 F62 100 F15 83.87 F31 100 F47 100 F63 70.1 F16 100 F32 100 F48 18.79 F64 100
Table 3 The number of factories according to efficiencies
Efficiency Frequencies
An operation functioning with 100% efficiency 47 An operation functioning with an efficiency between 80 and 100% 4 An operation functioning with an efficiency between 70 and 80% 3 An operation functioning with an efficiency between 60 and 70% 1 An operation functioning with an efficiency between 50 and 60% 3 An operation functioning below an efficiency of 50% 6
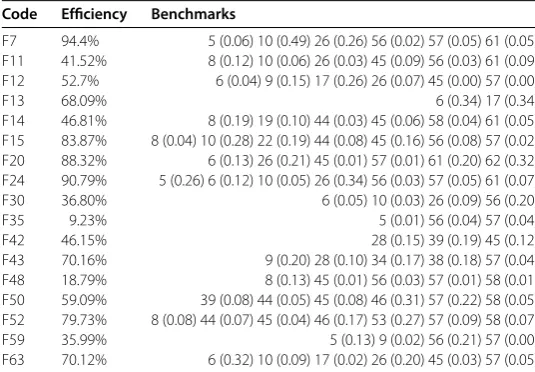
Table 4 Benchmarks of non-efficient operations according to the production model
Code Efficiency Benchmarks
F7 94.4% 5 (0.06) 10 (0.49) 26 (0.26) 56 (0.02) 57 (0.05) 61 (0.05) F11 41.52% 8 (0.12) 10 (0.06) 26 (0.03) 45 (0.09) 56 (0.03) 61 (0.09) F12 52.7% 6 (0.04) 9 (0.15) 17 (0.26) 26 (0.07) 45 (0.00) 57 (0.00)
F13 68.09% 6 (0.34) 17 (0.34)
F14 46.81% 8 (0.19) 19 (0.10) 44 (0.03) 45 (0.06) 58 (0.04) 61 (0.05) F15 83.87% 8 (0.04) 10 (0.28) 22 (0.19) 44 (0.08) 45 (0.16) 56 (0.08) 57 (0.02) F20 88.32% 6 (0.13) 26 (0.21) 45 (0.01) 57 (0.01) 61 (0.20) 62 (0.32) F24 90.79% 5 (0.26) 6 (0.12) 10 (0.05) 26 (0.34) 56 (0.03) 57 (0.05) 61 (0.07) F30 36.80% 6 (0.05) 10 (0.03) 26 (0.09) 56 (0.20)
F35 9.23% 5 (0.01) 56 (0.04) 57 (0.04)
F42 46.15% 28 (0.15) 39 (0.19) 45 (0.12)
F43 70.16% 9 (0.20) 28 (0.10) 34 (0.17) 38 (0.18) 57 (0.04) F48 18.79% 8 (0.13) 45 (0.01) 56 (0.03) 57 (0.01) 58 (0.01) F50 59.09% 39 (0.08) 44 (0.05) 45 (0.08) 46 (0.31) 57 (0.22) 58 (0.05) F52 79.73% 8 (0.08) 44 (0.07) 45 (0.04) 46 (0.17) 53 (0.27) 57 (0.09) 58 (0.07) F59 35.99% 5 (0.13) 9 (0.02) 56 (0.21) 57 (0.00) F63 70.12% 6 (0.32) 10 (0.09) 17 (0.02) 26 (0.20) 45 (0.03) 57 (0.05)
different efficiencies are given in Table and the benchmarks of non-efficient operations according to the production model are given in Table .
According to the findings given in Table , it was determined that there are factories whose efficiency is under % (or non-effective). It was detected that the efficiency of six factories is under % (Table ).
[image:4.595.162.430.428.614.2]variable, which is the number of laborers. Factory code F is % similar to factory code F, % similar to factory code F, % similar to factory code F, % similar to factory code F, % similar to factory code F and % similar to factory code F.
As a result of the analyses which were carried out, in order for factory code F employing laborers to work more efficiently, it must decrease the number of laborers to . In addition, the sales rate in the internal market should be decreased from % to %, while the external sales rates are to be increased by %.
The reason why factory code F functioning with an efficiency score of .% is not functioning efficiently is because of the input variable being the number of laborers and the output variable which is production. Production which has a major impact on efficiency and the number of laborers should be reviewed in factory code F. This factory which employs laborers should decrease the number of laborers to . In addition, this factory which processes , mof marble per month can function more efficiently if the amount of processed marble is increased to , m.
The efficiency score of factory code F was determined to be .%. The reason this operation is unable to function with a % efficiency is due to the input variables which are the number of laborers, ratio of internal market sales and the monthly costs of the laborers. Factory code F must decrease its number of laborers from to , decrease its internal market sales rate from % to % and decrease its monthly laborers costs from , TL to , TL. In addition, factory code F is % similar to factory code F, % similar to factory code F, % similar to factory code F and % similar to factory code F.
The reason why factory code F with an efficiency score of .% failed in functioning efficiently is due to the input variables which are the number of laborers and the monthly electricity costs. In addition, the effective function of this operation is affected by the out-put variables of production and product variety. In order for factory code F to function efficiently, it must decrease the number of laborers from to , decrease monthly laborer costs from , TL to , TL and reduce the monthly electricity costs from , TL to , TL. In terms of the output variables, the monthly production must be decreased from , mto , mand the variety of products should be decreased from six to three. The resemblance ratio of this operation with other operations is realized in terms of a % similarity to factory code F and a % similarity to factory code F.
Factory code F with an efficiency score of .% has a % similarity with factory code F, % similarity with factory code F, % similarity with factory code F, % similarity to factory code F, % similarity to factory code F and a % similarity to factory code F. The inefficient function of this operation was caused by the input variables which are the number of laborers as well as monthly laborer and electricity costs. In addition, the output variable of monthly production amount also has an impact on the inefficient functioning of this operation. In order for factory code F to function more efficiently, the number of laborers must be reduced from to , the monthly laborer costs must be reduced from , TL to , TL and the monthly electricity costs must be reduced from , TL to , TL. The output variable monthly production amount must be increased from , mto , m.
order for factory code F to function more efficiently, the number of laborers must be reduced from to and the monthly production amount must be increased from , to , m. In addition, the ratio of similarities of this operation with the others is % with factory code F, % with factory code F, % with factory code F, % with fac-tory code F, % with facfac-tory code F, % with facfac-tory code F and % with facfac-tory code F.
The reason factory code F with its .% efficiency was unable to function with a % efficiency is due to the input variable which is the number of laborers. In order to function more efficiently, this operation must reduce its number of laborers from to . In addition, the ratio of similarities of this operation with the others is % with factory code F, % with factory code F, % with factory code F, % with factory code F, % with factory code F, and % with factory code F.
The similarities ratio of factory code F with an efficiency score of .% is % with factory code F, % with factory code F, % with factory code F, % with factory code F, % with factory code F, % with factory code F and % with factory code F. The inefficient function of this operation is due to the number of laborers and the monthly production amount. The operation must reduce its number of laborers from to and increase the monthly production amount from , mto , m.
In order to function more efficiently, factory code F with its efficiency score of .% must reduce its input variable of laborers to . In addition the output variable of monthly production amount must be increased from , mto , m. The similar-ity ratio of this operation to other operations is % with factory code F, % with factory code F, % with factory code F, % with factory code F.
The efficiency score of factory code F as calculated to be .%. In order for this op-eration to function with a more efficient score, the input variable of laborers must be reduced to . In addition, the similarity ratio of this operation with the others is % with factory code F, % with factory code F and % with factory code F.
The inefficient functioning of factory code F with its .% efficiency score is due to the input variables consisting of the number of laborers, variety of machinery and monthly laborer costs. The number of laborers employed by this operation must be reduced from to , the number of machines must be reduced from to and the monthly laborer costs must be reduced from , TL to , TL. In addition, the similarity of factory code F with other operations is % with factory code F, % with factory code F and % with factory code F.
The similarity ratio of factory code F which functions with an efficiency score of .% with other operations is % with factory code F, % with factory code F, % with factory code F, % with factory code F and % with factory code F. In addition, in order for this operation to achieve a more efficient score, the input variable of the number of laborers must be reduced from to . Another input variable which must be altered is the reduction of monthly laborers costs from , TL to , TL.
rated as % with factory code F, % with factory code F, % with factory code F, % with factory code F and % with factory code F.
Factory code F which has an efficiency score of .% has a similarity ratio with other operations rated as % with factory code F, % with factory code F, % with factory code F, % with factory code F, % with factory code F and % with factory code F. In order for factory code F to function effectively, the number of laborers must be reduced from to .
In order for factory code F which functions with an efficiency score of .% to be fully efficient, the input variables of the number of laborers must be reduced from to and the number of machines must be reduced from to . In addition, it has been determined that the similarity ratio of this operation with the others is % with factory code F, % with factory code F, % with factory code F, % with factory code F, % with factory code F, % with factory code F and % with factory code F.
The efficiency score of factory code F has been determined to be .%. In order for this operation to become % efficient, the input variable of the number of laborers must be reduced from to . In addition, the similarity ratio of this operation with the others is % with factory code F, % with factory code F and % with factory code F.
The reason for the inefficiency of factory code F with its efficiency score of .% is due to the input variable of the number of laborers. If the operation reduces its number of laborers to , it will be able to operate efficiently. In addition, the similarity ratio of this operation with the others is % with factory code F, % with factory code F, % with factory code F, % with factory code F, % with factory code F and % with factory code F.
Conclusions
Whereas Afyonkarahisar city is one of the leading cities in Turkey according to marble production and exportation, the production level is lower according to extracted raw ma-terials. With this study we aimed to examine the efficiencies of marble factories in Afy-onkarahisar city, we also gave some recommendations to the administrators of the facto-ries for upgrading their production levels by summarizing the deficiencies of the factofacto-ries, related with the results of the study.
We hope that following these recommendations the efficiencies of the factories will in-crease, and with increased and efficient productions, the importance of Afyonkarahisar city will be the highest in Turkey.
Competing interests
The authors declare that they have no competing interests.
Abbreviations
CC: Chance-Constrained; CCR: Charnes, Cooper and Rhodes model; DEA: Data Envelopment Analysis; DMUs: Decision-Making Units; IDEA: Imprecise Data Envelopment Analysis; MOLP: Multiobjective Linear Programming
Authors’ contributions
SS has made substantial intellectual and theoretical contributions in order to carry out this study and also has determined the research design as well as coordinated all the process. ˙IK has played a role in statistical analysis and interpretation of data. CG and ˙ID made various interviews and have played a significant role in the collection of the data set. All authors read and approved the final manuscript.
Author details
Acknowledgements
Dedicated to Professor Hari M Srivastava.
This study is funded by Afyon Kocatepe University Scientific Research Projects Unit (Project No: 11FENED09).
Received: 31 December 2012 Accepted: 8 March 2013 Published: 2 April 2013
References
1. Özmen, M: Kasım 2000 - ¸Subat 2001 Ekonomik Krizleri ve Göller Bölgesi Mermercilik Sektörüne Etkileri. Yüksek Lisans Tezi, Süleyman Demirel Üniversitesi Sosyal Bilimler Enstitüsü ˙Iktisat Anabilim Dalı, Isparta (2003)
2. Çapik, M, Çavu¸so ˘glu, ˙I, Yılmaz, AO: Türkiye Do ˘gal Ta¸s Sektörüne Genel Bir Bakı¸s. In: Ersoy, M, Çelik, MY, Ye¸silkaya, L (eds.) Mersem’7 Uluslararası Mermer ve Do ˘gal Ta¸s Kongresi Bildiriler Kitabı, Afyonkarahisar (2010)
3. Çetin, T: Türkiye Mermer Potansiyeli, Üretimi ve ˙Ihracatı. Gazi E ˘gitim Fakültesi Dergisi1, 243-256 (2003) 4. Ulucan, A: Measuring the efficiency of turkish universities using measure-specific data envelopment analysis.
Sosyoekonomi1, 182-196 (2011)
5. Dyson, RG, Shale, EA: Data envelopment analysis, operational research and uncertainty. J. Oper. Res. Soc.61, 25-34 (2010)
6. Mahgary, SE, Lahdelma, R: Data envelopment analysis: visualizing the results. Eur. J. Oper. Res.85, 700-710 (1995) 7. Liu, JS, Lu, LYY, Lu, WM, Lin, BJY: Data envelopment analysis 1978-2010: a citation-based literature survey. Omega41,
3-15 (2013)
8. Charnes, A, Cooper, WW, Rhodes, E: Measuring efficiency of decision making units. Eur. J. Oper. Res.2, 429-444 (1978) 9. Chang, KP, Kao, PH: The relative efficiency of public versus private municipal bus firms: an application of data
envelopment analysis. J. Product. Anal.3, 63-80 (1992)
10. Kao, C: Efficiency improvement in data envelopment analysis. Eur. J. Oper. Res.78, 1-8 (1994)
11. Murphy, GB, Trailer, JW, Hill, RC: Measuring performance in entrepreneurship research. J. Bus. Res.36, 15-23 (1996) 12. Athanassopoulos, A: Goal programming and data envelopment analysis (GoDEA) for target-based multi-level
planning: allocating central grants to the Greek local authorities. Eur. J. Oper. Res.87, 535-550 (1995)
13. Karlaftis, MG: A DEA approach for evaluating the efficiency and effectiveness of urban transit systems. Eur. J. Oper. Res.152, 354-364 (2004)
14. Amin, GR, Toloo, M, Sohrabi, B: An improved MCDM DEA model for technology selection. Int. J. Prod. Res.44, 2681-2686 (2006)
15. Cook, WD, Seiford, LM: Data envelopment analysis (DEA) - thirty years on. Eur. J. Oper. Res.192, 1-17 (2009) 16. Golany, B: An interactive MOLP procedure for the extension of DEA to effectiveness analysis. J. Oper. Res. Soc.39,
725-734 (1988)
17. Roll, Y, Cook, WD, Golany, B: Controlling factor weights in data envelopment analysis. IIE Trans.23, 2-9 (1991) 18. Roll, Y, Golany, B: Alternative methods of treating factor weights in DEA. Omega21, 99-103 (1993)
19. Karsak, EE, Ahiska, SS: A common-weight MCDM framework for decision problems with multiple inputs and outputs. In: Gervasi, O, Gavrilova, M (eds.) Computational Science and Its Applications - ICCSA 2007. Lect. Notes Comput. Sci., vol. 4705, pp. 779-790. Springer, Berlin/Heidelberg (2007)
20. Karsak, EE, Ahiska, SS: Practical common weight multicriteria decision-making approach with an improved discriminating power for technology selection. Int. J. Prod. Res.43, 1537-1554 (2005)
21. Chen, YW, Larbani, M, Chang, YP: Multiobjective data envelopment analysis. J. Oper. Res. Soc.60, 1556-1566 (2009)
doi:10.1186/1029-242X-2013-139