IJPSR (2016), Vol. 7, Issue 6 (Research Article)
Received on 29 December, 2015; received in revised form, 03 February, 2016; accepted, 03 April, 2016; published 01 June, 2016
RP-HPLC METHOD DEVELOPMENT AND VALIDATION OF STABILITY INDICATING METHOD A FOR ESTIMATION OF LOSARTAN POTASSIUM UNDER STRESS CONDITION AND TABLET DOSAGE FORM
Amna B.W.E Mohammed 1* and Elsadig H.Rudwan 2
College of Animal Production science and Technology 1, Sudan University of Science and Technology, Sudan
Amipharma Laboratories Ltd 2, Khartoum, Sudan
ABSTRACT: Losartan potassium, a highly effective blood pressure lowering agent, has widely used for treatment of hypertension. Simple, economic, selective, and precise and stability indicating HPLC method has been developed and validated for analysis of losartan potassium in bulk drug and formulation dosage form. In order to optimize more one response at time, the chemo metric approach which includes 23 factorial design at two level with three factors was set up to standardize the chromatographic condition. The mobile phase was 40:60 ACN: Buffer consist of 0.05% of orthophosphoric acid and 0.05% Triethylamine at flow rate 1.0ml/minute the eluent was monitored at 225nm. The calibration plots constructed using the concentration of 6.4 to 9.6µg/ml (80 -120%) with r2 =0.999, recovery =99.44% was indicative of accuracy of proposed method. The precision was calculated as repeatability, intraday (RSD) for the drug.
INTRODUCTION: Losartan potassium is chemically: 2-butyl-4-chloro-1-[[2’-(1H-tetrazol-5-yl) [1, 1’-biphenyl]-4-yl] methyl]-1H-imidazole-5-methanol monopotassium salt. Losartan is a phenyl tetrazole substituted imidazole compound which acts as a selective, angiotensin II receptor type I antagonist and is employed in the management of essential hypertension 1. Method validation study include system suitability, linearity, precision, accuracy, specificity, robustness, limit of detection, limit of quantification and stability of sample, reagents, instruments.
QUICK RESPONSE CODE
DOI:
10.13040/IJPSR.0975-8232.7(6).2343-51
Article can be accessed online on:
www.ijpsr.com
DOI link: http://dx.doi.org/10.13040/IJPSR.0975-8232.7 (6).2343-51
The aim of this investigation was to establishing a new simple and sensitive method that could be used in analysis degradation products of Losartan potassium.
FIG.1: LOSARTAN POTASSIUM Key words:
Losartan potassium, RP-HPLC, experimental design,
Tablet, ICH guideline.
Correspondence to Author: Amna B.W.E Mohammed
College of Animal Production science and Technology, Sudan University of Science and Technology, Sudan
Several analytical methods have been applied to the analysis of Losartan potassium in pharmaceutical products that make use of high performance thin layer chromatography (HPTLC, capillary electrophoresis (CE), capillary electro chromatography (CEC and spectrophotometry. The literature reports many analytical methods for the quantitation of Losartan in tablets using HPLC.
The USP describes an RP-HPLC method for the determination of LOP in tablets
MATREIAL AND METHODS:
All chemicals and reagents used in the present study were Anal R grade and solvents were of HPLC. To attain high accuracy and reliability of results of the research work. The commercial tablets of losartan potassium are procured from local market, the details of procured materials are shown in Table 1 and the details of instruments used are shown in Table 2.
TABLE1: DRUG AND CHEMICAL PROCURED AND USED FOR THE PRESENT STUDY
S.no Material Procured from
1 Losartan potassium working standard 99.86% HUNHN Pharmaceutical CO.Ltd China 2 Acetonitrile HPLC grade Merck pharmaceutical India 3 Methanol HPLC grade Merck pharmaceutical India 4 Water HPLC grade Merck pharmaceutical India 5 O-phosphoric acid S.D fine Chem ltd India 6 Triethylamine HPLC grade S.D fine Chem ltd India
TABLE 2: INSTRUMENT USED FOR PRESENT STUDY
S.no Name of instrument Model Manufacturer
1 Digital balance sartorius CP2245 Germany 2 Ultrasonic bath sonicator M0109 INDIA
3 pH meter MI180 U.K
4 Spectrophotometer UV-1800 JAPAN
5 HPLC SYKAM S3210 Germany
6 Stability Chamber INDIA
7 Water bath Type1083 Germany
Preparation of Standard:
Preparation of standard losartan potassium solution 109.26 mg of losartan potassium working standard 99.86% weighed and dissolve in dry clean 100ml volumetric flask, add 50 ml of methanol sounicate for 15 min in ultrasonic the volume completed to the mark to final obtained 1mg/ml stock solution. Series of five standard solution in the separate concentration range of 6.4 to 9.6 µg/ml were prepared by dilution with diluent.
Preparation of diluent: 9:1 of Acetonitrile and water.
Preparation of Sample:
20 tablets of losartan potassium was poured in a mortar and thoroughly ground into fine powder. Out of this tablet powder equivalent to 100mg of losartan potassium was taken and dissolved in 100ml volumetric flask 50 ml of methanol added, sonicate for 15min complete the volume to the mark , filtrate through 0.45µm filter and the same
solution was further diluted stepwise with diluent to have a concentration 8µg/ml.
Preparation of solutions for degradation studies Acid and base degradation:
and water, mixed well and injected into the HPLC system.
Oxidation degradation:
Accurately weight 54.63mg of losartan potassium and transferred into 100 volumetric flask, to it 10ml of methanol was added and sonicateted for 15 minutes with intermittent shaking. To it 5 ml of 3% H2O2 was added. The sample was heated on boiling
water bath for 45 minutes, cool to room temperature and diluted to volume with diluent, mixed well. This solution was filtered through 0.45um filter, 5ml of the filtrate was transferred to 25 ml volumetric flask, diluted to volume with diluent (9:1) acetonitrile and water, mixed well and injected into the HPLC system.
Thermal degradation:
Accurately weight 54.63mg of losartan potassium and transferred into 100 volumetric flask, to it 10ml of methanol was added and sonicateted for 15 minutes with intermittent shaking .The sample was heated on boiling water bath for 45 minutes, cool to room temperature and diluted to volume with diluent, mixed well. This solution was filtered through 0.45um filter, 5ml of the filtrate was
transferred to 25 ml volumetric flask, diluted to volume with diluent(9:1) acetonitrile and water, mixed well and injected into the HPLC system.
Photolytic degradation:
Accurately weight 54.63mg of losartan potassium and transferred into 100 volumetric flask, to it 10ml of methanol was added and sonicateted for 15 minutes with intermittent shaking. Kept in UV 254nm (UV radiation for 16 hours), completed to the mark with diluent. This solution was filtered through 0.45um filter, 5ml of the filtrate was transferred to 25 ml volumetric flask, diluted to volume with diluent (9:1) acetonitrile and water, mixed well and injected into the HPLC system.
RESULTS:
Selection of detection wavelength:
To a chief goal of this study was to develop a rapid RP-HPLC method for the determination of losartan potassium in bulk drug and tablet formulation by utilizing most commonly column C18 with
Ultra-violet detection at wavelength 225nm. By using UV spectrophotometer the losartan potassium was scanned in the region of 200-400 nm in spectrum mode, the outcome absorption 225nm Fig.1
FIG.2: FIRST DERIVATIVE SPECTRUM OF LOSARTAN POTASSIUM.ID 225NM
Optimization and method development:
The main intention of method development is that all required chromatographic conditions are inevitably optimized.
experiments to identify the optimal condition. Recently computer assessed to HPLC separation has addressed the problem using factorial design strategies.
In this work a three factors with two level was applied to predict the retention behavior of
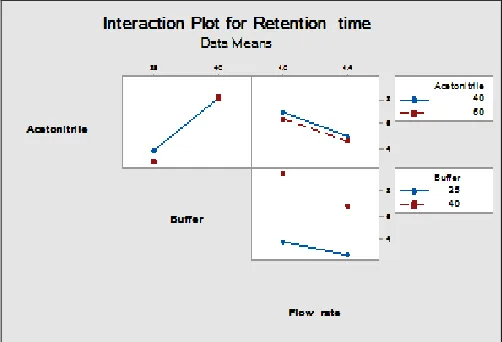
[image:4.612.58.561.311.443.2]Losartan potassium and optimize their isocratic elution using acetonitrile as organic modifier and buffer as mobile phase. The goal of this investigation was to establishing a new simple and sensitive method that could be used in analysis degradation products of Losartan potassium.
TABLE 3: MATRIX FOR THREE FACTORS (NUMBER OF RUNS =8)
Experiment Factor X1 Factor X2 Factor X3
Run1 -1 -1 -1
Run2 1 -1 -1
Run3 -1 1 -1
Run4 1 1 -1
Run5 -1 -1 1
Run6 1 -1 1
Run7 -1 1 1
Run8 1 1 1
TABLE 4: CHROMATOGRAPHIC CONDITION EMPLOYED AS PER 23 FACTORIAL DESIGN
X2 and X3 factors are represent, Acetonitrile, Buffer and low rate (-) and (+) represent the low and high of acetonitrile, buffer and flow rate.
Standard regression curve analysis was performed by used IPM SPSS software version 22and minitab17 and prism 6.07.
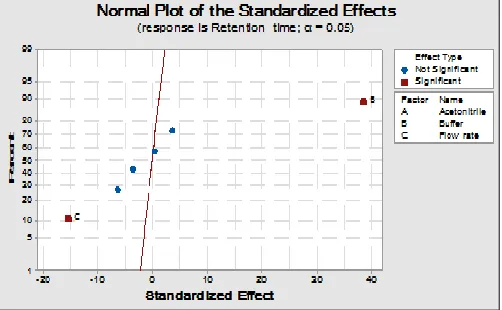
The model summary indicate that the model was fit, R2 =0.9961 and standard error of estimation was 0.1776%., this for dependent variable: retention time.
The obtained adjusted R2 were within acceptable limit of R2≥0.80, indicating that the experimental data were a good fit to the equation:
Y = ß0+β1 X1 +β2X2+β3X3+β4X1X2 +β5X2X3+ β6X1
X3+β7X1X2X3
Where Y is the level of the measured response, ß0
is the intercept, ß1 to ß7 are the regression
coefficients between,X1, X2 and X3 stand for the main effect, X1X2, X2X3 and X1X3 are the two – way interaction between the main effect and X1X2X3 is the three way interaction between the main effect 2, 3.
FIG.3: INTERACTION PLOT SHOWING THE INFLUENCE OF RETENTION TIME
Run
Factors Response Peak. area
tR Total plate asym5%
X1 X2 X3
Run1 40 35 1.0 4.40 4767 1.38 563.4
Run 2 60 35 1.0 3.316 4477 1.5 558.35
Run 3 40 40 10 9.45 5497 1.24 542.16
Run 4 60 40 1.0 9.533 5594 1.19 540.06
Run 5 40 35 1.4 6.816 4728 1.23 381.56
Run 6 60 35 1.4 2.383 2312 1.40 416.18
Run 7 40 40 1.4 3.10 2995 1.14 393.75
[image:4.612.314.565.544.715.2]FIG. 4: STANDARDIZED EFFECT SHOWING THE INFLUENCE OF RETENTION TIME
FIG.5: MAIN EFFECT SHOWING THE INFLUENCE OF RETENTION TIME
TABLE 5: OPTIMIZED CHROMATOGRAPHIC FOR THE PROPOSED METHOD
After close observation of the concerned parameters based on the detailed results obtained and discussions of this part the following procedures were recommended for deciding losartan potassium in bulk samples as pharmaceutical formulation.
For bulk samples:
To get a stable base line the HPLC system was stabilized for 40 minutes subject to the chromatographic conditions describe in Table 2. One blank followed by 6 replicates of a single
standard solution 8µg/ml was injected to check system suitability.
For pharmaceutical formulation:
Twenty tablets of losartan potassium 50mg was put into mortar and crouched to smooth powder. From this grounded tablet powder; equivalent to 50mg of losartan potassium was accurately and diluted with methanol sonicated for 15 min then the Solution was filtered through 0.45 µm membrane filter to have a concentration 8µg/ml,. The results of assay in respect of the proposed method are mentioned in Tanle15.
Method validation: 4.
According to guideline of ICH Q2 (R1) all parameters as discussed below were analyzed and validated accurately following the procedure of proposed method.
System suitability:
During analytical method development system suitability test give an added level of confidence that the accurate mobile phase, flow rate, temperature, and column were used which ensures the system performance (pump and detector) where in parameters of system suitability such as retention time, resolution, efficiency (number of theoretical plate) and tailing factor are involved and they should be within the defined limits. The results of system suitability in respect to the proposed method are mentioned in Table 6.
TABLE 6: SYSTEM SUITABILITY RESULTS FOR THE PROPOSED METHOD
S.no Parameters Results*
1 Retention time 9.98 minutes 2 Theoretical plate 3837 3 Theoretical plate per
meter(t.p/m)
0.065
4 Asymmetry 5% 1.1
5 Resolution -
* Results for triplicate value (n =3)
Specificity:
The excipients in tablets contained the following in active ingredients: Microcrystalline cellulose, lactose, maize starch and magnesium stearate as excipients, chromatograms showed that no excipients interfered with losartan potassium peak Fig.8.
Parameter Condition used for analysis
Mobile phase Acetonitrile,0.05% orthophosphoric acid+0.05% triethylamine ( 40:60 v/v)
Flow rate 1.0 ml/min
Wavelength 225 nm
Injection volume 20µl loop
Column C18 (250x4.6 mm,5µmm)
Column temperature
Ambient
Run time 20min
[image:5.612.49.300.57.212.2] [image:5.612.49.301.249.421.2] [image:5.612.47.298.458.577.2] [image:5.612.308.570.529.614.2]FIG. 7: ACID DEGRADATION OF LOSARTAN POTASSIUM
FIG.8: HPLC CHROMATOGRAM OF LOSARTAN
POTASSIUM WORKING STANDARD
Stress testing of losartan potassium:
Under acidic condition losartan potassium was degradated up to 0.7 %.Under alkali stress losartan potassium was degradated up to 1.63 %. Only small percent of degradation occurred in UV radiation and oxidation, degradated up to 1.87 under thermal condition.
TABLE 7: PERCENTAGE OF DEGRADATION
[image:6.612.314.570.207.538.2]The linearity for HPLC method was determined at five concentration levels ranging from 6.4-9.6 μg/mL for Losartan potassium the calibration curve was constructed by plotting response factor against respective concentration of Losartan potassium. The method of least square analysis was performed to obtain slope, intercept and correlation coefficient value. Figure. Shows the calibration curve of losartan potassium.
[image:6.612.313.569.207.538.2]TABLE 8: LINEARITY DATA OF LOSARTAN POTASSIUM
FIG.9: LINEARITY CURVE OF LOSARTAN POTASSIUM
TABLE 9: REGRESSION ANALYSIS DATA OF LOSARTAN POTASSIUM
The precision (system method) of the proposed method was evaluated by carrying out six S.n
o
Condition % Assay of
Losartan potassium
% degradation
1 No stress
treatment(control sample)
99.88 Nil
2 Acid 99.17 0.70
3 Alkali 98.25 1.63
4 H2O2 99.31 0.57
5 UV 99.84 0.37
6 Thermal 98.01 1.87
Level method%
Peak area at 225nm
Actual % RSD %
80 80 80
399.6630 398.956 401.1640
79.30 79.16 79.60
0.28
90 90 90
463.0825 459.1520 456.3130
91.89 91.11 90.54
0.74
100 100 100
504.380 503.350 504.140
100.07 99.88 100.04
0.10
110 110 110
556.816 548.022 552.9085
110.48 109.00 110.00
0.68
120 120 120
600.7550 597.909 594.933
119.2 119.00 118.00
0.54
Limit NMT 2%
Parameters Results
Linear range 6.4-9.6µg/ml
Regression equation(y=a+bx) y = 0.996x + 0.215 Correlation coefficient(r2 ) 0.9996
Slope ( b) 0.996
Intercept ( a) 0.215
Standard deviation of slope(sb) 0.009
Standard deviation of intercept(sa) 0.845
[image:6.612.48.302.631.748.2]independent assays of test sample. RSD (%) of six assay value obtained was calculated.
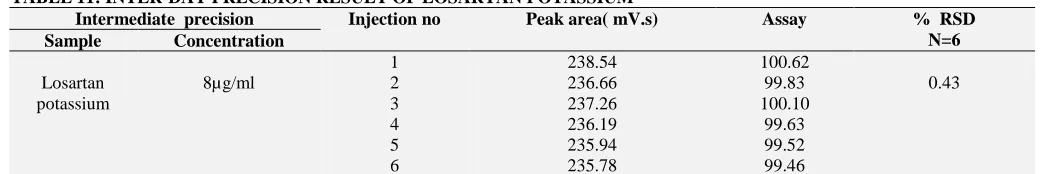
[image:7.612.60.557.107.203.2]The intermediate precision was carry out by analyzing the sample in different days.
TABLE 10: INTRA-DAY PRECISION RESULT OF LOSARTAN POTASSIUM Repeatability precision Injection
no
Peak area ( mV.s)
Assay % RSD N=6
Sample Concentration
Losartan potassium 8µg/ml
1 237.66 100.22
0.44
2 236.12 99.60
3 238.70 100.65
4 235.77 99.42
5 236.63 99.80
6 236.81 99.86
TABLE 11: INTER-DAY PRECISION RESULT OF LOSARTAN POTASSIUM
Intermediate precision Injection no Peak area( mV.s) Assay % RSD
N=6
Sample Concentration
Losartan potassium
8µg/ml
1 238.54 100.62
0.43
2 236.66 99.83
3 237.26 100.10
4 236.19 99.63
5 235.94 99.52
6 235.78 99.46
Accuracy (recovery studies)
The accuracy of the HPLC method was confirmed by recovery studies by spiking 80,100 and 120% of pure drugs to the pre analysed samples and the
samples after dilution injected into the system (n=3). The peak area of each drug was measured and recovery data for losartan potassium given in Table 12.
TABLE12: RECOVERY RESULTS OF LOSARTAN POTASSIUM
Robustness:
Robustness of the method was determined by small deliberate changes in flow rate, and wavelength. The content of the drug was not adversely affected
by these changes as evident from the low value of relative standard deviation indicating that the method was rugged and robust.
TABLE 13: CHANGE OF FLOW RATE
TABLE 14: CHANGE OF WAVELENGTH
Amount added µg/ml Amount found µg/ml Recovery% Statistical analysis of % recovery
6.4 6.34 99.06 MEAN 99.15
6.4 6.33 99.0 SD 0.17
6.4 6.36 99.4 %RSD 0.22
8.0 8..05 100.62 MEAN 100.22
8.0 8.00 100.00 SD 0.28
8.0 8.004 100.05 %RSD 0.34
9.6 9.54 99.37 MEAN 98.96
9.6 9.52 99.17 SD 0.45
9.6 9.44 98.33 %RSD 0.55
Flow rate(ml/min) Mean area ±SD
N= 3
SEM Mean tR±SD % Bias % RSD
Original Used Level
1.0
0.95 -0.05 227.27±1.81 1.28 10.12±0.097 0.0173 0.097
1.0 0 213.57±2.06 1.45 9.794±0.0098 0.00 0.10
1.05 +0.05 230,84±0.87 0.61 9.777±0.0098 -0.0093 0.1003
Wavelength Mean area ±SD
N= 3
SEM Assay % %Bias % RSD
Original used level
225
220nm -5 579.42±5.35 3.783 99.94 -0.022 0.923
225nm 0 521.39±0.690 0.487 100.05 0.008 0.132
[image:7.612.45.568.225.312.2]LOD and LOQ:
LOD and LOQ for losartan potassium were evaluated by injecting a series of solutions and diluted with known concentrations based on the peak response and the slope of the regression equation of the parameters of LOD and LOQ were decided. The LOD of drug noticed as 0.608µg/ml and LOQ was found 1.843µg/ml. By adopting the following formula LOD=3.3(SD)/S and LOQ = 10(SD)/S, where SD = standard deviation of
response and S= slope of the calibration curve were computed.
Comparison with the reported UV
spectrophotometric method:
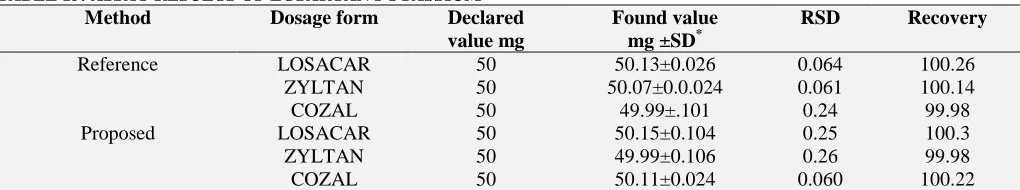
[image:8.612.50.560.217.312.2]The results obtained above were compared with that obtained from the reported HPLC method confirming similar accuracy and precision in the determination of losartan potassium by both methods Table 85.
TABLE 15: ASSAY RESULTS OF LOSARTAN POTASSIUM
Method Dosage form Declared
value mg
Found value mg ±SD*
RSD Recovery
Reference LOSACAR 50 50.13±0.026 0.064 100.26 ZYLTAN 50 50.07±0.0.024 0.061 100.14
COZAL 50 49.99±.101 0.24 99.98
Proposed LOSACAR 50 50.15±0.104 0.25 100.3
ZYLTAN 50 49.99±0.106 0.26 99.98
COZAL 50 50.11±0.024 0.060 100.22
*Average of three determination
DISCUSSION: The proposed method obeys linearity within the concentration range of 6.4 to 9.6µg/ml and coefficient correlation was found to be 0.999.The regression of the curve was Y=0.999x+0.215.The detection and quantization limit as LOD (K=3.3) and LOQ (K=10) were calculated and the these were found to be0.608µg/ml and 1.843µg/ml respectively. The precision measurement of intra-day and inter-day with percent relative standard deviation, 0.44% and 0.43%, which indicated that the method is highly précised. The main reason of study precision is to establish that promoted RP-HPLC is accurate for analyzing losartan potassium in pharmaceutical formulation as well as bulk forms. The percentage recovery value Table 6, bout % indicates the accuracy of the method. No excipients present or interference in the analysis market formulation tablets. The result of analysis of dosage form obtained were good agreement with label claim. Losartan potassium was stale drug toward stress testing.
CONCLUSION: The developed HPLC method is simple, precise, specific and accurate and the statistical analysis proved that method is reproducible and selective for the analysis of Losartan potassium in tablet dosage form.
REFERENCES:
1. K. E. McCarthy, Q. Wang, E. W. Tsai, R. E. Gilbert, D. P. Ip, and M. A. Brooks, “Determination of losartan and its degradates in COZAAR tablets by reversed-phase high-performance thin-layer chromatography,” Journal of Pharmaceutical and Biomedical Analysis, vol. 17, no. 4-5, pp. 671–677, 1998
2. BredaC.A., Breda m., Frigerio E., Bioanalytical method validation: a risk based approach, Journal of pharmaceutical and biomedical analysis2004; 35: 887-89. 3. Wayne W D, Biostatistics: Analysis in health Science, 5th
Ed, John Wiley& Sons, New York, 1991.
4. International Conference on Harmonization of Technical requirement for registration of pharmaceuticals for human Use (ICH), (2005).Validation of Analytical procedures: Text and Methodology Q2 (R1).
5. U.S .pharmacopoeia: National formulary. 2015; 38
All © 2013 are reserved by International Journal of Pharmaceutical Sciences and Research. This Journal licensed under a Creative Commons Attribution-NonCommercial-ShareAlike 3.0 Unported License.
This article can be downloaded to ANDROID OS based mobile. Scan QR Code using Code/Bar Scanner from your mobile. (Scanners are available on Google Playstore)
How to cite this article: