2665
COMPREHENSIVE FEATURE SELECTION BASED
SUPPORT VECTOR MACHINE CLASSIFIER (CFS-SVM) FOR
CLINICAL DATASET
S. KAVIPRIYA
1,DR.T. DEEPA21Research Scholar, Department of Computer Science, Sri Ramakrishna College of Arts and Science for
Women, Coimbatore, Tamil Nadu, India
2Assistant Professor, Department of Computer Science, Sri Ramakrishna College of Arts and Science for
Women, Coimbatore, Tamil Nadu, India Tamil Nadu, India
E-mail: [email protected], [email protected]2
ABSTRACT
Feature selection plays a significant role in any data mining research problem. In this research work, comprehensive feature selection is applied for selecting the attributes in the chosen PIMA Indian diabetes dataset. The comprehensive feature selection mechanism makes use of maximum significance pattern for selecting the most edifying features, which effectively distinguish between different classes of samples. By making use of the comprehensive feature selection mechanism, the degree of relevance between the feature variables and target variable is quantified, and the informativeness of features is determined according to the degree of the relevance score. In order to implement this mechanism, novel evidence metric, NEM, is employed to score the relevance degree of a candidate feature variable with respect to the target variable. Once after the feature selection is carried out, SVM classifier is applied for performing the prediction of heart disease among gestational diabetes patients in the dataset. Performance metrics such as sensitivity, specificity, true positive rate, false positive rate, precision, accuracy and time taken for feature selection are taken into account. The results are demonstrated with better performance.
Keywords: Feature Selection, Data Mining, Gestational Diabetes, Accuracy, Time Taken, Feature
Selection, Risk Prediction.
1. INTRODUCTION
Data mining in health informatics is a computational process for mining facts from available clinical databases. Data mining is broadly classified as predictive data mining and descriptive data mining. Classification and prediction falls under the category of predictive data mining. Risk prediction of heart diseases is one among the thrust research area in the field of clinical decision support system. Knowledge based clinical decision support system (CDSS) usually consists of three components namely knowledge base, inference engine and mechanism to communicate. Non-knowledge based CDSS makes use of machine learning algorithms namely support vector machine, relevance vector machine, artificial neural network and extreme learning machine. These machine learning algorithms countenance
computers to acquire from historical practices and/or find patterns in available clinical data. The non-knowledge based CDSS disregards the requirement for scripting rules and for proficient input. Nevertheless, these non-knowledge based CDSS based on machine learning possibly won’t elucidate the causes for their conclusions and hence known as “black boxes", for the reason that no expressive facts about the working will be distinguished by human scrutiny.
2666 early which includes decision tree, neural network, and association rule mining, [R Alizadehsani et al.,2013, J Nahar et al.,2013, I.Kurt et al.,2008, M.G. Tsipouras et al.,2008]. Decision tree is easy to implement and interpret and it provides a tree-based classification for developing a predictive model according to independent variables [M.J. Berry and G. Linoff.,1997]. Decision tree seems to be one the precise algorithms among data mining tools.
.
2. LITERATURE REVIEW
Adaptive Genetic Fuzzy System (AGFS) was proposed by B. Dennis and S.
Muthukrishnan.,2014 for optimizing rules and membership functions for medical data classification process. To establish the efficiency of the proposed classifier the presentation of the anticipated genetic-fuzzy classifier was evaluated with quantitative, qualitative and comparative analysis. Hybrid Prediction Model (HPM) proposed by B.M. Patil et al.,2010 used Simple K-means clustering algorithm aimed at validating chosen class label of given and subsequently applying the classification algorithm to the result set. C4.5 algorithm was used to build the final classifier model by using the k-fold cross-validation method. J. Jabez Christopher et al.,2015 used a meta-heuristic approach called Wind-driven Swarm Optimization (WSO). The uniqueness of this work lies in the biological inspiration that underlies the algorithm. WSO uses Jval, a new metric, to evaluate the efficiency of a rule-based classifier. Rules were extracted from decision trees. WSO was used to obtain different permutations and combinations of rules whereby the optimal rule set that satisfies the requirement of the developer was used for predicting the test data.
J. Mattila et al.,2012 presented a novel generic clinical decision support system, which models a patient's disease state statistically from heterogeneous multiscale data, where the goal was to aid in diagnostic work by analyzing all available patient data and highlighting the relevant information to the clinician. Jamal Salahaldeen Majeed Alneamy and Rahma Abdulwahid Hameed Alnaish, 2014 intended to use the hybrid teaching learning based optimization (TLBO) algorithm and fuzzy wavelet neural network (FWNN) for heart
disease diagnosis. The TLBO algorithm was applied to enhance performance of the FWNN. The hybrid TLBO algorithm with FWNN was used to classify the Cleveland heart disease dataset obtained from the University of California at Irvine (UCI) machine learning repository. Kalpana M and Kumar AS,2012 expressed the prominent features of the fuzzy expert system by applying the algorithm Fuzzy Assessment Methodology using K ratio, that was to diagnosis the diabetes Fuzzy Assessment Methodology using k ratio was developed. Fuzzy Expert System consists of following elements such as Fuzzification interface, Fuzzy Assessment Methodology using K ratio and Defuzzification interface.
Kamadi V.S.R.P. Varma et al.,2014 proposed a method to minimize the calculation of Gini indices by identifying false split points and used the Gaussian fuzzy function because the clinical data sets were not crisp, where the efficiency of the decision tree depends on many factors such as number of nodes and the length of the tree, pruning of decision tree plays a key role. Kindie Biredagn Nahato et al.,2016 proposed a classifier that combines the relative merits of fuzzy sets and extreme learning machine (FELM) for clinical datasets. The three major subsystems in the FELM framework were preprocessing subsystem, fuzzification subsystem and classification subsystem. Missing value imputation and outlier elimination were handled by the preprocessing subsystem.
2667
3. PROPOSED WORK
3.1 Design of Algorithm
O. Kurşun et al.,2010 and C.O. Sakar et al.,2012 scrutinized the risk related to insignificant repetition in minimal-Redundancy-Maximal-Relevance (mRMR). To outline the issue, a basic graphical representation is given. In Fig. 1 there are three factors, including an objective variable , a previously chosen feature and a candidate feature are given. As indicated by the max-relevance and min-redundancy standard, the mRMR Score (mRMRS) of regarding has the additional structure:
(1)
where is observed between two factors,
where is the significance between the applicant feature and aimed variable ) is the repetition of as for already chosen feature , and indicates the information area in Fig. 1. It can be seen that includes two sections, and . The two sections are considered as the important repetition and unimportant repetition individually, since denotes about the repetitive information that conveys the purposes, however is totally irrelevant to the purpose. It has been planned that the unimportant repetition have to be removed from the mRMR score, leaving the main , which denotes the special information about which transmits the target [C.O. Sakar et al.,2012].
Fig.1 Relation Between Available Variable and Target Variable
In Fig.1. the association between three factors, including a variable a formerly chosen feature and a candidate feature , where shows the information setting. Thus, a new channel feature selection method, CFS-SVM is designed to attempt to manage this issue. The Comprehensive Feature Selection based Support Vector Machine (CFS-SVM) value is given by:
where (Maximal Information Coefficient) is the measurements between two factors of Gram-Schmidt Orthogonalization (GSO), that is
between is the orthogonalized
variable of candidate feature about early chosen feature by methods for GSO function
and where it shows
the significance between the
orthogonalized variable and
target variable . In Fig.1, is denoted by , which is the information that is passed by however mainly from
and can be viewed as
subtracting from , just leaving . It can be seen that the insignificant repetition is rejected from the CFS-SVM. In this way, the planned comprehensive technique can remove the insignificant repetition from the established mRMR.
2668 3.2. Comprehensive Feature Selection (CFS)
Method
An information network is tabled as tests and features, where
feature variable is . The
objective variable , with regards a different number denote about various classes of the compared samples. Beneath the high-relevance and low-redundancy standard, the proposed feature selection method CFS-SVM in the present test means to locate a least subset of
helpful features , where the
capable feature variable , and the objective variable which could be perfectly described by the feature factors in .
3.2.1. High-Relevance
The high-relevance plan is focused to choose the most helpful features, which effectively identifies special classes of tests. In the plan, the level of significance between the feature factors and target variable is measured, and the values of features are determined by the level of the significance score. To apply this plan, a recently investigated information metric , was utilized as a part of the paper to score the significance level of a candidate feature variable as the objective variable. The High-Relevance Score (HRS) of feature variable
has the additional structure:
(3)
where is a score work from the Maximal Information-based Nonparametric study (MINE) application, which can be utilized to compute the MIC and other statistical scores. MIC is a statistical measure of the relationship between matched factors with regard to the relationship of linear or nonlinear. To receive the MIC score, the estimations of the two factors are divided into various numbers of cases to shape rectangular frames with various decisions. In this manner the delivery of the cells of every matrix can be received by giving the possibility chance to be grouped in every cell which is to be the part of focus falling into that particular cell, then the
MI measurements for every network is determined and the high value is picked as the MIC score. The MIC of two factors and is characterized as:
(4 )
where D is the example measure and which indicates the quantity of cases forced on
the and axis separately, and
is the MI which observes the value between the two factors for an -by - rectangular network. As marked by the meaning of , the value can be utilized to calculate the level of significance between a constant variable and a individual variable, however the two existing MINE application packages independently, which are not a correct fit for getting a individual target variable as input, since the typical whole number estimations of target variable speak about various classes of the comparing tests, and these individual esteems will be confidently divided into cases whose number is generally not equivalent to the quantity of test classes.
Along these lines in the current research, the last bundle was conformed to guarantee that the estimation of target variable is just allowed to be merged into indicated holders whose number is dependable with that test classes. Then the significance between constant feature factors and the individual target variable was figured to utilize the balanced package with default parameters, where the more important
, the higher observable power of the relating feature
.
3.2.2 High-Relevance (HR) and Low- Redundancy (LR)
The HR and LR expect to locate a minimal subset of informational features at the time of considering the subset. The basic solution of independently informational features does not really accomplish a better classification execution. Along these lines, "the m best features
are not the best m features" [H. Peng et al.,2005].
2669 Peng et al.,2005] and Quadratic Programming Feature Selection (QPFS) [I.Rodriguez-Lujan et al.,2010], in which the distinction between the significance and redundancy is overestimated to improve the HR and LR.
In the present investigation, the HR and LR were in approximate way which was improved for utilizing an comprehensive technique which concentrates the GSO and MIC together. The GSO is dedicated for figuring the orthogonalized variable of a candidate feature as for other features to expel the redundancy amongst them, and the MIC significance between the orthogonalized variable and target variable is maximized in an approximate way which advances the high-relevance and low-redundancy.
The proposed OMICFS score of candidate feature variable with respect to already chosen features is given by:
(5)
where is the
orthogonalized variable of feature about the
feature factors utilizing a GSO
work. The more notable CFS-SVM score, for all the more encouraging the feature . By real, the unessential duplication is removed in CFS-SVM score in view of the input for orthogonal change and the target variable.
3.2.3 Implementation
In real time implementation, a step by step procedure is utilized to choose features that reach a nearby value of highly relevant maximized value. In the initial step, HRS (High Relevance Score) of the whole candidate features are calculated, where the feature holding high value of HRS can be determined as the primary trusted feature variable,
(6)
The comparing orthogonalized variable is chosen as . Along these lines, the issue turns out to be in the manner by which it incrementally chooses the other capable features
from the rest of the features, where one feature denotes that one stage forward. Assuming that a
feature subset , made out of
promising features
which has been determined at step and the comparing orthogonalized factors are . The capable feature
can be chosen from at stage by
advancing the additional condition:
(7)
where is the orthogonalized
variable of candidate feature as for the already chosen feature factors in and it can be figured for utilizing a GSO work
(8
)
With the assurance of , the linked orthogonalized variable
can be done parallel, which will be precious in following advances. Hence, the capable feature factors could be incrementally improved until step where a sum of features is chosen. For instance, there are 3 capable features that should
be chosen from 5 capable
features .
Regarding initial step, the of the huge number of features is figured. Assuming has the maximal , it
can have .
The second step starts with the
calculation of
2670 have the maximal OMICFS score which is chosen, leaving the other three features which to be picked later.
In the third step, since
is considered
as more important than
and . The last encouraging feature is determined as
. In this manner, the three probable
capable features are
at last captured.
Moreover, the theory of Sure Independence Screening (SIS) [J. Fan and J. Lv.,2008] can be utilized to increase the speed of CFS-SVM when managing high-dimensional information. In each series of non-quickening CFS-SVM, the orthogonalized factors and MIC significance for every candidate feature which must be recalculated to be determine high CFS-SVM score. In this manner, when the feature measurement is highly-high, the computation becomes become tough. The SIS theory argues that the first arrangement of features can be pointed to a little subset whose measurement is in the request of under the certain state of D, which provides the measurements of single features and size of tests individually, then feature selection can be a specialist by some advanced lower dimensional methods [J. Fan and J. Lv.,2008, Q. He and D.Y. Lin.,2011]. As per SIS, when OMICFS is utilized for high-dimensional and low-example estimate the data value, the candidate features can be positioned in dropping request by HRS, and just the best features are boosted into the stepwise search to reduce the computational weight.
The pseudo code of this proposed research work is given below:
Input: Candidate feature
factors, ,
denoted as tests and features, and target
variable
Output: Ordinal number of D chosen features, D < E
1 : for do
2 :
3 : end for 4 : if E >> D
5 : in
sliding request
6 :
7 : else
8 :
9 : end if
10 :
11 :for do
12 :
13 :refresh 14: end for
14 :restore the ordinal number of the chose features in
3.3. Classifier
The Support Vector Machines (SVM) classifier is one among the machine learning algorithms which is based on the structural risk minimization principle and statistical learning theory. The basic idea of SVM is to transform the data into a higher dimensional space and find a classification hyper-plane that separates the data with the maximum margin. The standard SVM model is as follows:
(9) Subject to
where
where and are the
2671 Instead of solving the above said optimization problem, it is feasible to solve the dual problem:
(10)
Subject to where
where . is called
kernel function. The binary classifier and the decision function could be calculated as follows:
(11)
where
is an optimal solution of the
problem
in
eqn
(10),
<
C, SV is the set of support vectors,
4. ABOUT THE DATASET
[image:7.612.324.524.561.718.2]The performance of the proposed CFS-SVM is experimented in PIMA Indian diabetes dataset [Kindie Biredagn Nahato et al.,2016] that has been obtained from National Institute of Diabetes and Digestive and Kidney Diseases. The chosen dataset is multivariate in nature and it contains 768 instances with 9 attributes including the class label. 268 instances are identified as the patients with gestational diabetes. The attribute contains mixture of integer and real numbers. The attribute information is shown in Table. 4.1.
Table 4.1. Attribute Information Of PIMA Dataset
S.
No Feature Description Domain Zero En try
1 Preg Number of times pregnant
0-5 11
1 2 Glu Plasma glucose
concentration a 2 h in an oral glucose
tolerance test
0-199 5
3 Bp Diastolic blood
pressure (mm Hg) 0-122 35 4 Skin Triceps skin fold
thickness (mm) 0-99 227 5 Insu
lin 2-h serum insulin (mu U/ml) 0-846 374
6 BM
I Body mass index ( kg/mt sq) 0-67 11 7 DPF Diabetes pedigree
function
0.078-2.42
-
8 Age Age (years) 21-81 -
9 Clas
s Class label 0 or 1 NIL
5. PERFORMANCE METRICS
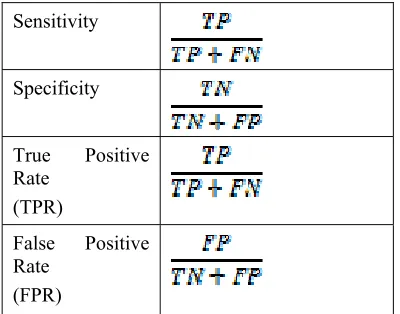
Experiments were conducted on the selected clinical datasets using SCILAB 6.0.0. The performance metrics namely, accuracy, sensitivity, specificity, True Positive Rate (TPR), False Positive Rate (FPR) and precision were used for evaluating the proposed work. The metrics are computed by considering True Positives (TP), False Negatives (FN), True Negatives (TN) and False Positives (FP). True positives (TP) refer to those instances that are truly identified as a diseased patient by the classifier. If the patient is not correctly classified, it becomes False Negatives (FN). Healthy instances correctly identified by the classifier becomes True Negatives (TN), if not it becomes False Positives (FP).
Sensitivity
Specificity
True Positive Rate
(TPR)
False Positive Rate
2672 Precision
Accuracy
6. RESULTS AND DISCUSSIONS
The overall performance analysis of the FELM and the proposed CFS based SVM (CFS-SVM) in terms of TP, TN, FP, FN, sensitivity and specificity is presented in Table-6.1. Also the performance analysis in terms of TPR, FPR, precision and Accuracy is portrayed in Table-6.2. As far as inferences from the results are concerned, the accuracy of the proposed CFS-SVM is improved and the time taken for feature selection is reduced. It is to be noted that the existing and proposed classifiers are allowed to train first and tested next.
Fig.6.1 Performance Comparison Of Sensitivity For PCA-SVM Vs CFS-SVM With Varying Training And
Testing Rate
Sensitivity is the measure of proportion of actual positives which are correctly identified as positives by the classifier. From the Fig 6.1 it is clearly evident that the proposed classifier performs better in identifying the positives than the FELM (Fuzzy-sets and Extreme Learning Machine) [Kindie Biredagn Nahato et al.,2016]. The result values of Fig.6.1 are predicted in Table-6.1.
Fig.6.2 Performance Comparison Of Specificity For PCA-SVM Vs CFS-SVM With Varying Training And
Testing Rate
Specificity is the measure of classifier’s ability to identify negative results. From the Fig. 6.2 it can be observed that the proposed mechanism does not work better in terms of specificity than the FELM (Fuzzy-sets and Extreme Learning Machine) [Kindie Biredagn Nahato et al.,2016]. This is due to the degree of relevance mismatch. The result values of Fig.6.2 are predicted in Table-6.1.
F
Fig.6.3 Performance Comparison Of True Positive Rate For PCA-SVM Vs CFS-SVM With Varying
Training And Testing Rate
2673
Fig.6.4 Performance Analysis Comparison Of False Positive Rate For PCA-SVM Vs CFS-SVM With
Varying Training And Testing Rate
[image:9.612.326.518.368.496.2]False Positive Rate (FPR) refers to the negatives that were incorrectly labelled as positive. From the Fig. 6.4, it is clear that CFS-SVM attains the certain degree of relevance mismatch and results in producing a little bit of increase in the false positive rate in certain Training and Testing Rate when comparing with FELM (Fuzzy-sets and Extreme Learning Machine) [Kindie Biredagn Nahato et al.,2016]. The result values of Fig.6.4 are predicted in Table-6.2.
Fig.6.5 Performance Analysis Comparison Of Precision For PCA-SVM Vs CFS-SVM With Varying
Training And Testing Rate
Precision is the measure of accurately predicted positive values to the total predicted positive values. From Fig 6.5 it is clear that, CFS-SVM predicts the accurate positives than the FELM (Fuzzy-sets and Extreme Learning Machine) [Kindie Biredagn Nahato et al.,2016]. The result values of Fig.6.5 are predicted in Table-6.2.
Fig.6.6 Performance Analysis Comparison Of Accuracy For PCA-SVM Vs CFS-SVM With Varying
Training And Testing Rate
Accuracy is the measure of ratio of correctly predicted observation to the total observations. The accuracy result is portrayed in Fig.6.7 and it illustrates that the proposed CFS-SVM harvests better accuracy than FELM (Fuzzy-sets and Extreme Learning Machine) [Kindie Biredagn Nahato et al.,2016]. The result values of Fig.6.6 are predicted in Table-6.2.
.
Fig.6.7 Performance Analysis Comparison Of Elapsed Time For PCA-SVM Vs CFS-SVM With Varying
Training And Testing Rate
Time taken is the measure of finding how much period the algorithm takes for feature selection. Fig 6.7 shows that CFS-SVM took low time for feature selection than the FELM (Fuzzy-sets and Extreme Learning Machine) [Kindie Biredagn Nahato et al.,2016].
7. CONCLUSIONS
[image:9.612.93.284.391.540.2]2674 is quantified, and the informativeness of features is determined according to the degree of the relevance score. A novel evidence metric, NEM, which is the statistical measure is used to score the relevance degree of a candidate feature variable with respect to the target variable. For obtaining the NEM score, the values of the two variables are partitioned into different number of bins to form rectangular grids with different resolutions, thus the distribution on the records in the dataset by letting the probability weight. After that certain statistics will be calculated, and the maximum is chosen as the MIC score. Once after the feature selection is carried out, SVM classifier is applied for performing the prediction of heart disease among gestational diabetes patients in the dataset. The results comparatively obtains overall better performance, but still there is a future scope of research in reducing the number of false positive and false negative. For this reason, in the next work we aim to employ an adaptive optimization technique for decreasing the false positive and false negative.
REFERENCES
[1] B. DENNIS, S. MUTHUKRISHNAN, AGFS:
ADAPTIVE GENETIC FUZZY SYSTEM FOR
MEDICAL DATA CLASSIFICATION,IN APPLIED
SOFT COMPUTING,VOLUME 25,2014,PAGES 242-252.
[2] B.M. PATIL, R.C. JOSHI, DURGA
TOSHNIWAL, HYBRID PREDICTION MODEL
FOR TYPE-2 DIABETIC PATIENTS,IN EXPERT SYSTEMS WITH APPLICATIONS,VOLUME 37, ISSUE 12,2010,PAGES 8102-8108.
[3] C.O. Sakar, O. Kursun, F. Gurgen, A feature selection method based on kernel canonical correlation analysis and the minimum Redundancy–Maximum Relevance filter method, Expert Systems with Applications, 39 (2012) 3432-3437.
[4] H. Peng, F. Long, C. Ding, Feature selection based on mutual information: criteria of max-dependency, max-relevance, and min-redundancy, IEEE transactions on pattern analysis and machine intelligence, 27 (2005) 1226-1238.
[5] I Kurt, M Ture, AT Kurum, Comparing performances of logistic regression, classification and regression tree, and neural networks for predicting coronary artery disease, Expert Syst. Appl. 34 (1) (2008) 366–374.
[6] I. Rodriguez-Lujan, R. Huerta, C. Elkan, C.S. Cruz, Quadratic programming feature
selection, Journal of Machine Learning Research, 11 (2010) 1491-1516.
[7] J Nahar, T Imam, KS Tickle, Y-PP Chen, Association rule mining to detect factors which contribute to heart disease in males and females, Expert Syst. Appl. 40 (4) (2013) 1086–1093.
[8] J. Fan, J. Lv, Sure independence screening for ultrahigh dimensional feature space, Journal of the Royal Statistical Society: Series B (Statistical Methodology), 70 (2008) 849-911.
[9] J. Jabez Christopher, H. Khanna Nehemiah, A. Kannan, A Swarm Optimization approach for clinical knowledge mining, In Computer Methods and Programs in Biomedicine, Volume 121, Issue 3, 2015, Pages 137-148.
[10]J. Mattila, J. Koikkalainen, A. Virkki, M. van Gils and J. Lötjönen; for the Alzheimer's Disease Neuroimaging Initiative, "Design and Application of a Generic Clinical Decision Support System for Multiscale Data," in IEEE Transactions on Biomedical Engineering, vol. 59, no. 1, pp. 234-240, Jan. 2012.
[11]Jamal Salahaldeen Majeed Alneamy and Rahma Abdulwahid Hameed Alnaish, “Heart Disease Diagnosis Utilizing Hybrid Fuzzy Wavelet Neural Network and Teaching Learning Based Optimization Algorithm,” Advances in Artificial Neural Systems, vol. 2014, Article ID 796323, 11 pages, 2014.
[12]Kalpana M, Kumar AS. Design and Implementation of Fuzzy Expert System using Fuzzy Assessment Methodology. Int J 2012;1(1):39–45.
[13]Kamadi V.S.R.P. Varma, Allam Appa Rao, T. Sita Maha Lakshmi, P.V. Nageswara Rao, A computational intelligence approach for a better diagnosis of diabetic patients, In Computers & Electrical Engineering, Volume 40, Issue 5, 2014, Pages 1758-1765.
[14]KINDIE BIREDAGN NAHATO, KHANNA H.
NEHEMIAH,A.KANNAN,HYBRID APPROACH
USING FUZZY SETS AND EXTREME LEARNING
MACHINE FOR CLASSIFYING CLINICAL
DATASETS, IN INFORMATICS IN MEDICINE
UNLOCKED,VOLUME 2,2016,PAGES 1-11. [15]Kindie Biredagn Nahato, Khanna H.
2675 Informatics in Medicine Unlocked, Volume 2, 2016, Pages 1-11
[16]MANJEEVAN SEERA, CHEE PENG LIM, A
HYBRID INTELLIGENT SYSTEM FOR MEDICAL DATA CLASSIFICATION,IN EXPERT SYSTEMS WITH APPLICATIONS, VOLUME 41, ISSUE 5, 2014,PAGES 2239-2249.
[17]MG Tsipouras, TP Exarchos, DI Fotiadis, AP Kotsia, KV Vakalis, KK Naka, et al., Automated diagnosis of coronary artery disease based on data mining and fuzzy modeling, IEEE Trans. Inf. Technol. Biomed. 12 (4) (2008) 447–458.
[18]MJ Berry, G Linoff, Data Mining techniques: For marketing, sales, and Customer Support, John Wiley & Sons, Inc., 1997.
[19]Muhammad Waqar Aslam, Zhechen Zhu, Asoke Kumar Nandi, Feature Generation Using Genetic Programming With Comparative Partner Selection For Diabetes Classification, In Expert Systems With Applications, Volume 40, Issue 13, 2013, Pages 5402-5412.
[20]O. Kurşun, C.O. ŞAKAR, O. Favorov, N. Aydin, S.F. GÜRGEN, Using Covariates For Improving The Minimum Redundancy Maximum Relevance Feature Selection Method, Turkish Journal Of Electrical Engineering & Computer Sciences, 18 (2010) 975-989.
[21]Q. He, D.Y. Lin, A Variable Selection Method For Genome-Wide Association Studies, Bioinformatics, 27 (2011) 1-8. [22]R Alizadehsani, J Habibi, MJ Hosseini, H
Mashayekhi, R Boghrati, A Ghandeharioun, Et Al., A Data Mining Approach For Diagnosis Of Coronary Artery Disease, Comput. Methods Programs Biomed. 111 (1) (2013) 52–61.
[23]Vijaya K, Khanna NH, Kannan A, Bhuvaneswari NG. Fuzzy Neuro Genetic Approach For Predicting The Risk Of Cardiovascular Diseases. International Journal Of Data Mining, Modelling And Management 2010;2(4):388–402.
2676
Table-6.1: Performance Analysis of TP, TN, FP, FN, Sensitivity and Specificity
Metri cs
TP TN FP FN Sensitivity Specificity
Algm
Rate
FEL M
CFS - SV
M
FEL M
CFS - SVM
FEL M
CFS - SVM
FEL M
CFS - SVM
FEL M
CFS - SVM
FEL M
CFS - SVM
80-20 199 208 49 42 10 9 10 9 95.22 95.85 83.05 82.35
70-30 186 191 53 54 20 16 9 7 95.38 96.46 72.60 77.14
60-40 178 199 52 37 21 17 17 15 91.28 92.99 71.23 68.52
50-50 177 189 44 40 22 18 25 21 87.62 90.00 66.67 68.97
Table-6.2: Performance Analysis of TPR, FPR, Precision, F-1 Measure and Accuracy
Metrics
TPR FPR Precision Accuracy
Algm
Rate FELM
CFS -
SVM FELM
CFS -
SVM FELM
CFS -
SVM FELM
CFS - SVM
80-20 95.22 95.85 16.95 17.65 95.22 95.85 92.54 93.28
70-30 95.38 96.46 27.40 22.86 90.29 92.27 89.18 91.42
60-40 91.28 92.99 28.77 31.48 89.45 92.13 85.82 88.06