International Journal of Emerging Technology and Advanced Engineering
Website: www.ijetae.com (ISSN 2250-2459,ISO 9001:2008 Certified Journal, Volume 4, Issue 6, June 2014)
933
Segmenting the Optic Disc in Retinal Images Using
Bi-Histogram Equalization and Thresholding the Connected
Regions
Prashant Choukikar
1, Arun Kumar Patel
2, Ravi Shankar Mishra
31, 2, 3Department of Electronics & Communication, SISTEC Bhopal India Abstract— Optical disc segmentation and localization is an
essential task for diabetic retinopathy and retinal image analysis. The pervious methods of thresholding using histogram equalization are unable to threshold the disc for diabetic images, since they contain multiple connected regions. This paper presents a simple and efficient approach for segmentation of the optic disc in such retinal images using thresholding the morphologically connected regions and boundary extraction. The input optical image is enhanced using Bi-histogram equalization. This improves the efficiency of the conventional thresholding method. Gray level thresholding is applied on the enhanced retinal images. The desired optical disc is determined by finding the label connected neighbourhood with 8-conect mask. Then morphological boundary extraction and circle fitting method is used for extracting the optical disk. The method is tested on the 40 different optical disc images. It is found to be less complex and efficiently recognizes the boundary of the optic disc and also evaluates the optical canter. The optical canters are tabulated for original and corrupted images. The results are also compared with the existing standard methods.
Keywords - Retina, Optical Disc, Segmentation, Thresholding, Bi histogram equalization, Circle fitting, Morphological boundary extraction.
I. INTRODUCTION
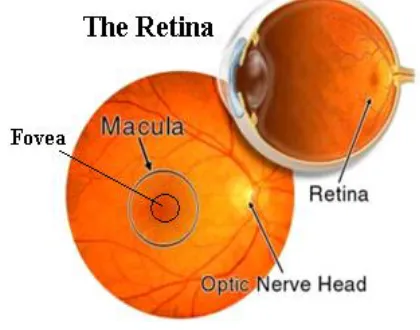
Optical disc is the region where blood vessels and optic nerves enter to the retina of human eyes. It is the brightest part of the normal fundus images. Detection of the optic disc (OD) is considered as one of the essential part of analysis of digital colour retinal images [1, 2 and 14]. Since the location of optical disc is considered as the landmark for the analysis and identification of eye disease and blood vessels in retinal images. The false detection of the optical disc may cause faulty response of linear blood vessel filters. Optical disc locations are responsible for the tracking of various anatomical features like blood vessels and also for extracting Exudates, Drusens and locating the macula.etc present in the diabetic retinal eye. The diameter of optical disc is commonly used as a reference length for measuring distances and sizes in retinal images [7].
[image:1.612.337.547.405.570.2]If the optic disc is efficiently located, then locations of the critical areas like fovea may also be determined. Researchers have proposed various methods for extracting optic disk boundary in the past [1, 3, 4 and 5]. In Ref. [1], was located the optic disk center by identifying the area of highest intensity variation among adjacent pixels. The algorithm in [3] uses a cost function, which is based on a combination of both global and local cues, to the optic disc. The optic disc was localized using Hausdorff based template matching and pyramidal decomposition in [4]. In [5] a two-stage method was reported. In the first stage, the image was processed using grey level mathematical morphology to remove blood vessel regions.
Figure 1 Retina components
International Journal of Emerging Technology and Advanced Engineering
Website: www.ijetae.com (ISSN 2250-2459,ISO 9001:2008 Certified Journal, Volume 4, Issue 6, June 2014)
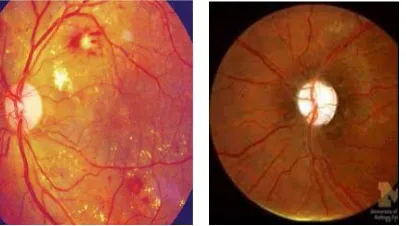
934 The most of existing methods of optical disc detection using thresholding and histogram equalization are unable to threshold the disc for diabetic images, since they contain multiple connected regions. It is hard to decide the threshold for such images and thus difficult to fit the circle. Also these methods are unable to locate the disc having multiple regions. An example of two such images (one each) are given in the Figure 2
The efficiency of the thresholding based optical disc localization technique mainly depends upon the efficiency of enhancement stage and on the efficiency of thresholding stage
[image:2.612.70.273.279.392.2]
Figure 2 Cases of failure of existing optical disc methods a) Diabetic Image b) Image with multiple bright regions
Therefore in this paper simple and efficient optical disc segmentation method is proposed using the Bi-histogram equalization (BBHE) and thresholding with morphologically level connected regions. First all morphologically connected levels are determined using 8-connected mask. And then level containing the optical disc is manually selected. It is found that the enhancing the optical image before thresholding clearly represents the optical disc as a brightest region. Thus improves the efficiency of gray level thresholding. The circle fitting algorithms is applied on the respective level only
In rest of the paper after introduction section 2 has discussed literature review of some of the related existing works. Section 3 describes the histogram based enhancement methods. Proposed optical disk segmentation method is described in section 4. The section 5 presents proposed segmentation method using level connected regions. In section 6 optical disc location methods along with circle fitting is discussed. Results based on proposed method are discussed in section 7. It is found that this method is computationally less complex and efficient.
II. LITERATURE REWIRE
There is lot of research done for the improvement of optical image quality as [4, 6, 13, and 14]. Contrast limited adaptive histogram equalization (CLAHE) method by Barkana et. al. [5] have described various reasons for detecting the optical disc size for assessing Glaucoma. They have also reviewed different methods of measuring the optical disc size. Agung W et al.[4] have proposed to use the CLAHE method for enhancing the colour retinal images using the (green) G channel. In the colour retinal image a unique characteristic exist than other medical images that these images in green (G) channel, the blood vessels looks more contrast than the background. Kim et. al. [6] have presented a contrast enhancement method for color images using Brightness Preserving Bi-Histogram Equalization (BBHE) method which not only enhance the image contrast but also preserve the brightness.
International Journal of Emerging Technology and Advanced Engineering
Website: www.ijetae.com (ISSN 2250-2459,ISO 9001:2008 Certified Journal, Volume 4, Issue 6, June 2014)
935 III. HISTOGRAM EQUALIZATION
The Histogram equalization (HE) is a widely used method for enhancing the contrast of the retinal images [3, 7, and 17]. The enhanced images represent the small blood vessels in much better manor. The current paper deals with the two histogram based contrast enhancement methods sequential.
A. Global Histogram Equalization
The GHE method aims to generate the uniform histogram distribution therefore stretches dynamic range of the histogram and results in overall contrast improvement [3, 4]. GHE enhances the image contrast by transforming the values in an intensity image so that output image contains flat histogram. Cumulative density function (CDF) is efficiently used transformation function to produce the flat equalized histogram as shown in Figure 3. The CDF function is obtained by simply summing up the Probability density functions (PDF) and is given as;
Figure 3 Equalized Cumulative distribution function
( ) =
r
dr
r
P
0;
)
(
0 r 1 (2)Now differentiating the equation (2) will give;
)
(
r
P
dr
ds
(3)
Thus finding the CDF will flatten the histogram. But HE method may significantly change the brightness of an input image and cause problem in some applications where brightness preservation is necessary.
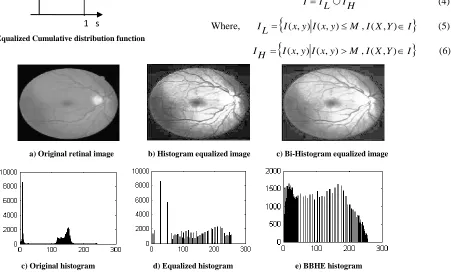
B. Brightness preserving Bi Histogram Equalization This method is an improvement over the conventional histogram equalization method [HE]. The Brightness preserving Bi Histogram Equalization (BBHE) method was proposed by Y.T.Kim [6], this method sub divides the input image into two images as and based on the mean brightness as threshold. Let is the mean brightness of the input image. By setting mean brightness as threshold the input image is divided to two sub images and represented as
I ILIH (4)
Where, IL
I(x,y)I(x,y)M,I(X,Y)I
(5)IH
I(x,y)I(x,y)M,I(X,Y)I
(6)
a) Original retinal image b) Histogram equalized image c) Bi-Histogram equalized image
[image:3.612.113.564.408.680.2]
c) Original histogram d) Equalized histogram e) BBHE histogram
Figure 4 Example of retinal image enhancement
1 s
1
International Journal of Emerging Technology and Advanced Engineering
Website: www.ijetae.com (ISSN 2250-2459,ISO 9001:2008 Certified Journal, Volume 4, Issue 6, June 2014)
936 Then, the probability density function is individually calculated for the and images as;
L k L K L
n
n
I
P
(
)
Where,k
0
,
1
,
m
(7)H k H K H
n
n
I
P
(
)
Where,k
m
1
,
M
2
N
(8)
Where, and are the gray levels in both sub images and are total number of gray levels in and sub images. N is length of gray levels in the images and is given as .
Then cumulative density function CDFL and CDFH are
calculated using the equation (2) defined as in [6];
m
k 1PL(IK) L
CDF , and
N
m
k 1PH(IK) H
CDF
(9)
Then each sub image is equalized independently. By using the equations (9) the transfer functions for the histogram equalization are defined as;
fL(Ik)I0(ImI0)CDFL (10) and fH(Ik)Im1(IN Im1)CDFH (11) the equalized image is the union of the both transformed gray levels and is given by;
Y fL(Ik)fH(Ik) (12) Figure 4 shows an example of the original and equalized image along with their histogram. The BBHE method preserves the brightness much better than the GHE method
IV. PROPOSED OPTICAL DISC SEGMENTATION
In this paper an efficient method of segmenting the optical disc is proposed.
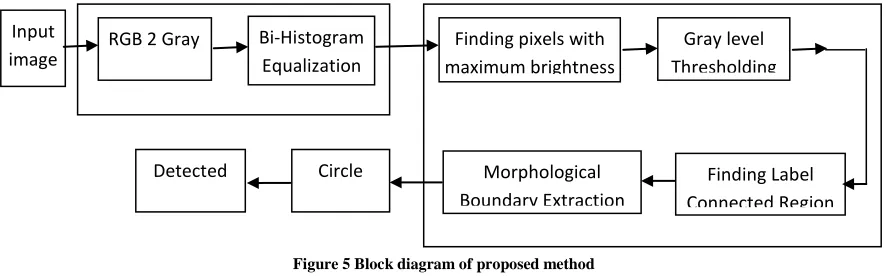
The block diagram of proposed method is shown in Figure 5. The sequential processing of proposed method is given as;
1. Convert input image to the gray level image.
2. Equalized using the Bi-histogram equalization method for enhancing the poor contrast and brightness. 3. Then gray level thresholding is applied on enhanced
image.
4. For improving the efficiency of thresholding the derided label connected region containing the optical disc in threshold image is selected.
5. In the next stage the morphological operator‟s erosion and dilation are used for the optical disk boundary extraction.
6. Finally circle fitting is applied on the detected boundary pixels for finding the disc.
A. Gray image conversion
Colours displayed on retinal images are usually defined in the tri colours as red, green and blue, space is called as RGB colour space [16]. The colour retinal images are converted to the corresponding gray images. This is achieved by neglecting the hue and saturation and only selecting the intensity of the gray level as average of RGB spaces mathematically given as;
3
:)
,
(;
:)
(:,
:)
(:,
:)
(:,
R
G
B
I
(13)
B Image Enhancement
In order to improve the efficiency of the image segmentation method in this paper it is proposed to enhance the gray level optical retinal image using Bi-histogram equalization method [6].
[image:4.612.84.527.584.722.2]It is found that since this method preserves the brightness thus is capable of representing the optical disc as the brightest region of the retinal image. This improves the efficiency of the thresholding method.
Figure 5 Block diagram of proposed method
Segmentation of Disc Image Enhancement Input image Bi-Histogram Equalization Gray level Thresholding Detected Optical Disk RGB 2 Gray
Conversion
International Journal of Emerging Technology and Advanced Engineering
Website: www.ijetae.com (ISSN 2250-2459,ISO 9001:2008 Certified Journal, Volume 4, Issue 6, June 2014)
937 V. SEGMENTATION BY THRESHOLDING LABLE
CONNECTED REGIONS
A. Finding Pixels with Maximum Brightness
For gray images, separation of darker background from brighter foreground is thresholding. Optical images do not have such simple histograms hence thresholding require some other techniques. The coordinates of pixels with the maximum brightness are identified in the enhanced image. Then the row and columns are selected as;
mb=max(max(bw)) (14)
[ro co]=find(bw==mb) (15) ro=min(ro) ; co=max(co) (16)
A. Gray Level Thresholding
Since the optical disc in equalized image is corresponding to maximum brightness regions. Thus in order to segment the optical disc the suitable threshold is selected as;
( ) ( ) ( )
Where, ( ) is the gray level value of the equalized image. The threshold is set to 251 in this paper. Now the segmentation is perfumed based on the selected threshold and the segmented image is given as;
Th
y
x
bw
if
Th
y
x
bw
if
y
x
g
)
,
(
)
,
(
255
0
)
,
(
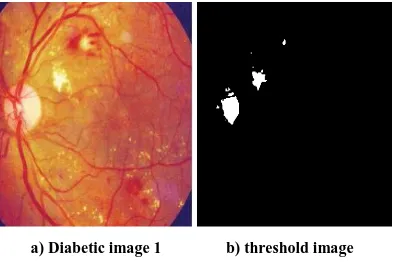
(18)Where, ( ) is a logical segmented image, then the optical disc boundary is extracted using sequential morphological operations. Figure 6 shows the example of the gray level thresholding.
[image:5.612.71.269.526.657.2]a) Diabetic image 1 b) threshold image
Figure 6 Example of Gray level thresholding
C. Finding Label Connected Regions
It is observed that thresholding an image results in number of connected components such as part of optic disc, some noise and other bright features.
This is more severing in case of diabetic retinal image due to Drusens. These connected components are candidate regions for optic disc. In order to find the label connected components in the threshold image first image is ssmoothen to reduce the number of connected components. A smoothening mask is used for this purpose defined as;
0 0 0 0 0 0 1 1 1 0 0 1 1 1 0 0 1 1 1 0 0 0 0 0 0 msk (19)Now the morphologically 8 connected components are determined using standard Sedgewick, Robert algorithms [18]. There will be connected components. is a variable containing index of the level The desired connected component containing the optical disc is selected manually by observing the entire labels. Now the pixels contained by the selected label are find which are corresponding to optical disc.
VI. DISC BOUNDARY EXTRACTION
A boundary extraction method using morphological operators is used here to locate the disc. Boundary extraction method includes two fundamental processes Dilation and Erosion. Erosion is used to smooth the image to erode the outer unwanted pixel in the retina. After the process of erosion some pixel in the optic disc will also get eroded so we are going for the process dilation to reconstruct the image and also it is used in the process of edge detection
A. Erosion of threshold image
Erosion is a morphological operator which erodes he features of the image. Let the B is represented by the structuring mask and is the threshold image. Then the
gray-scale dilation of by ( ) is defined as
( )( ) { ( )
International Journal of Emerging Technology and Advanced Engineering
Website: www.ijetae.com (ISSN 2250-2459,ISO 9001:2008 Certified Journal, Volume 4, Issue 6, June 2014)
938 Where, DB is the domain of the structuring element B
and ( ) is assumed to be −∞ outside the domain of the
image and ( ) is the pixels of the image.
B. Dilation of threshold image
Let the B is represented by the structuring mask and is the threshold image. Then the gray-scale dilation of
by ( ) is defined as:
( )( ) { ( )
( )| ( ) } ( )
Where, DB is the domain of the structuring element B
and ( ) is assumed to be −∞ outside the domain of the
image and ( ) is the pixels of the image.
C. Extracting the boundary of the Disc
In order to find the inner part of the disc, subtract the eroded image from the dilated image. After the process of image subtraction we will get the edges of the optic disc
( )( ) ( )( ) ( )
D Circle Fitting
[image:6.612.322.573.129.356.2]Proposed method uses the circle fitting method of Izhk Bucher [2004] which fits a circle in plane in a more accurate manor but using more memory. Where, x and y are column vector where ( ( ) ( )) is a measured points. The result of fitting is canter point (yc, xc) and radius R. Figure 7 shows the example of basic circle fitting result for optical image 2.
An optional output is the vector of coefficient a describing the circle's equation
( ) ( ) ( ) (22)
The circle fitting algorithm is given as;
( ) ( ) (23)
( ( )) ( ) ( )
[image:6.612.347.542.573.679.2]( ) (24)
Figure 7 Basic Circle Fitting curves
VII. EXPERIMENTAL RESULTS
In this paper an efficient method of segmenting the optical disc images is presented using the label connected regions. The performance of the proposed method is compared to the existing methods of optical disc segmentation.
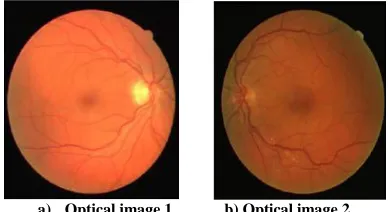
A. Input Images Used
The input Retinal images used for the simulation are taken from the different data sets and references and also includes diabetic images as shown in Figure 8. The optical image 1 and 5 are the image of -right eye, image 2 and Diabetic image are the image of left eyes. The optical images 4 and 7 are of closer view of the retina. Some of the images suffer from the poor contrast due to noisy optical environment. For the analysis purpose all the images are resized to same image size of 240 x 320.
International Journal of Emerging Technology and Advanced Engineering
Website: www.ijetae.com (ISSN 2250-2459,ISO 9001:2008 Certified Journal, Volume 4, Issue 6, June 2014)
939
c) Diabetic image 1 d) Optical image 5
[image:7.612.72.271.122.381.2]
e) Optical image 4 f) Optical image 7
Figure.8 Original input images used in the paper
B. Result of optical disc segmentation
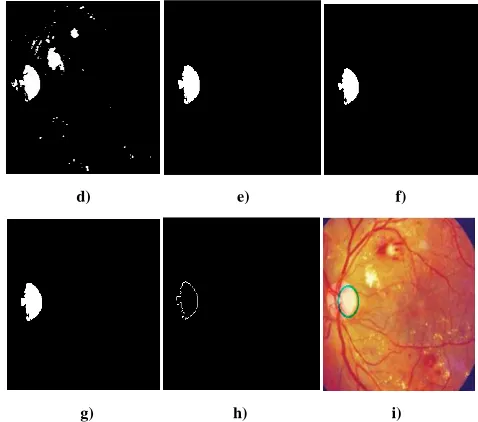
Figure 9 shows the sequential results of proposed segmentation method and optical disk detection for the Diabetic optical image 1. The Bi-histogram equalized image in Figure 9(c) preserves the brightness and represents the optical disc region as highest brightness regions therefore improves the efficiency of the optical disc detection.. It can be seen that the threshold diabetic images contains multiple connected regions similar to the optical disc regions as shown in Figure 9(d). It is hard to find the optical disc. The gray level threshold selected for this image is 245. Thus selecting the label connected region (L=3) helps in this regards as in Figure 9(e). The morphological boundary extraction and circle fitting is used to detect the optical disc as shown by green circle in Figure 9 (i).
a) b) c)
d) e) f)
[image:7.612.324.563.135.346.2]g) h) i)
Figure 9 Sequential results of the proposed method for Diabetic image a) Original image b) Gray converted image, c) Bi-histogram equalized image, d) Threshold image, e) Level connected image f) Eroded image, g) Dilated image, h) Extracted disc boundaries, i) detected optical disc
after circle fitting..
The segmented optic disc consists of a canter point and a radius. For performance evaluation 87 retinal images were tested by the proposed algorithm. The results of the six distinguished images from database are presented here. The coordinates of canter and the radius of the detected optical disc are respectively compared in Table 1 and Table 2 for detected optical disc with and without equalization. The – in the Table 1 and 2 shows the failure cases. The equalized image represents the higher disc radius thus gives better segmented disc. Also the threshold is different for different images if equalisation is not used. While after equalization same threshold may be used for most of the images. The threshold used with equalization for this paper is 251.
[image:7.612.50.288.583.693.2]International Journal of Emerging Technology and Advanced Engineering
Website: www.ijetae.com (ISSN 2250-2459,ISO 9001:2008 Certified Journal, Volume 4, Issue 6, June 2014)
[image:8.612.47.554.113.685.2]940
Table 1 Comparison of Canter
S. No
Images With HE Equalizat
ion
With BBHE Equalizat
ion
With Label connected
BBHE 1 Optical image 1 249 , 111 253 , 111 251 , 114 2 Optical image 5 -- -- 73 . 115 3 Optical image 4 182 108 184 , 109 184 , 111 4 Optical image 5 290 , 189 286 , 171 282 , 153 5 Optical image 7 147 , 113 147 , 113 150 , 116 6 Diabetic image 1 -- -- 53 , 116
Table 2 Comparison of Radius
S. No
Images With HE Equalizat
ion
With BBHE Equalizat
ion
With Label connected
BBHE 1 Optical image 1 16.2934 18.37066 18.1535 2 Optical image 3 -- -- 13.46386 3 Optical image 4 20.4107 22.49187 30.7530 4 Optical image 5 35.3448 30.4607 30.6064 5 Optical image 7 24.9819 23.6509 28.0190 6 Diabetic image 1 -- -- 21.54707
Result of C. Li et. al [9]
Result of P. K. Kohli [10]
Our Proposed Results
[image:8.612.329.568.132.252.2]
Figure 10 Result comparison of the detected optical disc for various methods
VIII. CONCLUSION
[image:8.612.94.519.425.665.2]International Journal of Emerging Technology and Advanced Engineering
Website: www.ijetae.com (ISSN 2250-2459,ISO 9001:2008 Certified Journal, Volume 4, Issue 6, June 2014)
941
[image:9.612.105.521.131.477.2]
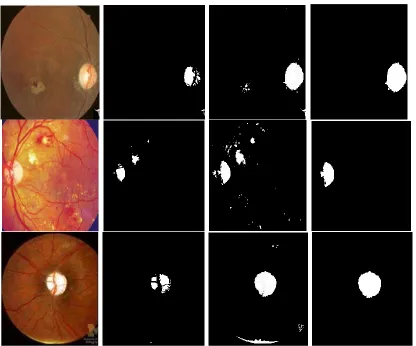
Figure 11 optical disc after the thresholding a) First column shows input images, b) Second column is gray level threshold image with HE c) Third is threshold image with BBHE, d) Last is proposed label connected threshold image with BBHE,
The canter of disc and disc radius are calculated and compared. It is found that enhancing the image using histogram equalization before segmentation improves the efficiency significantly. It allows us to use the same threshold for most of the images. In future the efficient circle fitting and other brightness preserving enhancement methods can be used to improve the efficiency of the canter point detection.
Acknowledgment
Author wishes to acknowledge each and every individual who have supported for the current work directly or indirectly.
REFERENCES
[1] Adria Perez Rovira; Emanuele Trucco , “Contextual optic disc location in retinal fundus images “, Journal of Modern Optics, Volume 57, Issue 2 January 2010 , pages 136 – 144
[2] A. D. Fleming, K. A. Goatman, S. Philip et al. “Automatic detection of retinal anatomy to assist diabetic retinopathy screening”, Physics in Medicine and Biology 52, pp. 331–345, 2007.
[3] Vasile V. Buruloin, Mihai Ciuc, Raugaraj M. Rangavyan, Loic Kjj, Constantim Vertan., “Histogram equalization of colour images using the adaptive neighbourhood approach”, Proc. SPIE 3646, Nonlinear Image Processing, X, 330, 1999.
[4] Agung W. Setiawan, Tati R. Mengko, Oerip S. Santoso, Andriyan B. Suksmono, “Color Retinal image enhancement using CLAHE”, IEEE Conf. 2007
[5] Yaniv Barkana, Robert Ritch, "Size matters: Why optical disc size should be measured when assessed for Glaucoma", Journal of current Glaucoma practice, Vol. 1, No. 1, pp. 17-20, 2007.
[6] Y.-T. Kim Contrast Enhancement Using Brightness Preserving Bi-Histogram Equalization , IEEE Transactions on Consumer Electronics, Vol. 43, No. 1, FEBRUARY 1997
International Journal of Emerging Technology and Advanced Engineering
Website: www.ijetae.com (ISSN 2250-2459,ISO 9001:2008 Certified Journal, Volume 4, Issue 6, June 2014)
942 [8] V. Vijaya Kumari, N. Suriyanarayanan, "Detection of optic disk in
retinal Images -A comparison", International Journal on Computer Science and Engineering Vol.1(3), pp. 192-195 2009.
[9] Chunming Li, C. Xu, C. Gui, and M. D. Fox, “Level set evolution without re- initialization: A new variational formulation” IEEE Computer Society Conference on Computer Vision and Pattern Recognition, vol. 1, pp. 430 - 436, 2005.
[10] Prabhjot Kaur Kohli, “Exact detection of optic disc in retinal images using segmentation based on level set method and morphological operations”, M. Tech. Report Thaper University India 2012. [11] Niemeijer M. , Ginneken B., Loog M., Abramoff M.D.,
“Comparative study of retinal vessel segmentation methods on a publically available database”, SPIE Medical Imaging , 5370 : 648-656, 2004.
[12] Foracchia M., Grisan E., and Ruggeri A., “Detection of vessel calibre irregularities in color retinal fundus images by means of a matched filter responce”, IEEE trains, on Medical. Images, Vol. 19: pp 203-210, 2000.
[13] D. Santhi, D. Manimegalai, “ Location of optical disc in retinal image”, IEEE International conf. ICCIMA 07, vol. 3, pp 333-338 , 2007
[14] Qinghui Cao, Jianli Liu, Qiuhong Zhao., “Fast automatic optical disc localization in retinal images”, IEEE Proc. of Seventh International Conference on Image and Graphics, pp. 827-831, 2013
[15] D. Jude Hemanth, J.Anitha, “Hybrid clustering method for optic disc segmentation and feature extraction in retinal images”, IEEE World Congress, on Information and Communication Technologies, pp. 320-325, 2012.
[16] Gopal Datt Joshi*, Jayanthi Sivaswamy,S. R. Krishnadas, “Optic Disk and Cup Segmentation From Monocular Color Retinal Images for Glaucoma Assessment”, IEEE TRANSACTIONS ON MEDICAL IMAGING, VOL. 30, NO. 6, JUNE 2011.
[17] Sandeep Kumar ,Puneet Verma, Manoj Dahiya,Aakash Gupta, “Presence Of Noise In Dualistic Sub-Image Histogram Equalization Technique of Image Enhancement”, International Journal of Engineering Research & Technology (IJERT) Vol. 1 Issue 3, May – 2012.
[18] Huiqi Li and Opus Chutatape, „Automatic location of optical disc in retinal images” IEEE transaction on Electrical and electronic engineering. 2001, vol. 2 pp 837-840
[19] Sedgewick, Robert, Algorithms in C, 3rd Ed., Addison-Wesley, pp. 11-20. In 1998,
Authors:
1. Prashant Choukikar: have completed the BE in Electronics and Communication engineering from MITS college Bhopal and is currently pursuing M. Tech degree from SISTECH college Bhopal India
2. Prof. Arun Kumar Patel : Have received M. Tech degree and pursuing PhD, and is currently working as Astt. Prof at SISTEC College Bhopal in Electronics and communication department