BIROn - Birkbeck Institutional Research Online
Tao, D. and Tang, X. and Li, Xuelong and Wu, X. (2006) Asymmetric
bagging and random subspace for support vector machines-based relevance
feedback in image retrieval.
IEEE Transactions on Pattern Analysis and
Machine Intelligence 28 (7), pp. 1088-1099. ISSN 0162-8828.
Downloaded from:
Usage Guidelines:
Please refer to usage guidelines at
or alternatively
Birkbeck ePrints: an open access repository of the
research output of Birkbeck College
http://eprints.bbk.ac.uk
Tao, Dacheng; Tang, Xiaoou; Li, Xuelong and Wu,
Xindong (2006). Asymmetric bagging and random
subspace for support vector machines-based
relevance feedback in image retrieval. IEEE
Transactions on Pattern Analysis and Machine
Intelligence 28 (7) 1088-1099.
Copyright © 2006 IEEE. Reprinted from IEEE Transactions on Pattern
Analysis and Machine Intelligence (ISSN 0162-8828)
.This material is posted
here with permission of the IEEE. Such permission of the IEEE does not in
any way imply IEEE endorsement of any of Birkbeck’s products or services.
Internal or personal use of this material is permitted. However, permission to
reprint/republish this material for advertising or promotional purposes or for
creating new collective works for resale or redistribution must be obtained
from the IEEE by writing to [email protected].
By choosing to view this document, you agree to all provisions of the
copyright laws protecting it.
Citation for this copy:
Tao, Dacheng; Tang, Xiaoou; Li, Xuelong and Wu, Xindong (2006).
Asymmetric bagging and random subspace for support vector
machines-based relevance feedback in image retrieval. London: Birkbeck ePrints.
Available at:
http://eprints.bbk.ac.uk/archive/00000443
Citation as published:
Tao, Dacheng; Tang, Xiaoou; Li, Xuelong and Wu, Xindong (2006).
Asymmetric bagging and random subspace for support vector
machines-based relevance feedback in image retrieval. IEEE Transactions on Pattern
Analysis and Machine Intelligence 28 (7) 1088-1099.
http://eprints.bbk.ac.uk
Asymmetric Bagging and Random Subspace
for Support Vector Machines-Based
Relevance Feedback in Image Retrieval
Dacheng Tao,
Student Member
,
IEEE
, Xiaoou Tang,
Senior Member
,
IEEE
,
Xuelong Li,
Member
,
IEEE
, and Xindong Wu,
Senior Member
,
IEEE
Abstract—Relevance feedback schemes based on support vector machines (SVM) have been widely used in content-based image retrieval (CBIR). However, the performance of SVM-based relevance feedback is often poor when the number of labeled positive feedback samples is small. This is mainly due to three reasons: 1) an SVM classifier is unstable on a small-sized training set, 2) SVM’s optimal hyperplane may be biased when the positive feedback samples are much less than the negative feedback samples, and 3) overfitting happens because the number of feature dimensions is much higher than the size of the training set. In this paper, we develop a mechanism to overcome these problems. To address the first two problems, we propose an asymmetric bagging-based SVM (AB-SVM). For the third problem, we combine the random subspace method and SVM for relevance feedback, which is named random subspace SVM (RS-SVM). Finally, by integrating AB-SVM and RS-SVM, anasymmetric bagging and random subspaceSVM (ABRS-SVM) is built to solve these three problems and further improve the relevance feedback performance.
Index Terms—Classifier committee learning, content-based image retrieval, relevance feedback, asymmetric bagging, random subspace, support vector machines.
æ
1
I
NTRODUCTIONR
ELEVANCEfeedback [21] is an important tool to improvethe performance of content-based image retrieval (CBIR) [22]. In a relevance feedback process, the user first labels a number of relevant retrieval results as positive feedback samples and some irrelevant retrieval results as negative feedback samples. Then, a CBIR system refines all retrieval results based on these feedback samples. These two steps are carried out iteratively to improve the performance of the image retrieval system by gradually learning the user’s preferences.
Many relevance feedback methods have been developed in recent years. They either adjust the weights of various features to adapt to the user’s preferences [21] or estimate the density of the positive feedback examples [5]. Moreover, discriminant learning has also been used as a feature selection method for relevance feedback [32]. These methods work well with certain limitations. The method in [1] is heuristic. The density estimation method in [5] loses information contained in negative samples. The discriminant learning in [32] often suffers from the matrix singular problem.
Regarding the positive samples and the negative samples as two difference groups and aiming at finding a classifier to identify these two groups from each other, relevance feedback in CBIR becomes an online learning problem. In other words, it is a real-time classification problem. Recently, classification-based relevance feedback [8], [31], [27], [6], [25] has become a popular topic in CBIR. Many binary-classification algorithms were designed to treat the positive samples and negative samples equally [31], [27]. In One-Class SVM [5], the algorithm only estimates the data density of the positive samples. Zhou and Huang [32] also proposed an (1 + x)-class classification in which there is an unknown number of classes but the user only concerns one class (positive feedback samples). Multiclass-based rele-vance feedback [18] was also developed to scale the performance of this key part of a CBIR system.
Among these classifiers, the Support Vector Machines (SVM) [8], [31], [27], [6], [25] based relevance feedback (SVM RF) has shown promising results owing to its good general-ization ability. SVM has a very good performance for pattern classification problems by minimizing the Vapnik-Chervo-nenkis dimensions and achieving a minimal structural risk [29]. SVM active learning [27] halves the image space each time in which the most positive samples are selected farthest from the classifier boundary on the positive side and the samples close to the boundary are deemed as the most-informative ones for the user to label. Guo et al. [6] developed a constrained similarity measure (CSM) for image retrieval in which the SVM is also employed with AdaBoost. The CSM also learns a boundary that halves the images in the database into two groups and images inside the boundary are ranked by their Euclidean distances to the query. There are also some more kinds of SVM-based relevance feedback algorithms [33]. However, when the number of positive feedback . D. Tao and X. Li are with the School of Computer Science and Information
Systems, Birkbeck, University of London, Malet Street, London WC1E 7HX, UK. E-mail: {dacheng, xuelong}@dcs.bbk.ac.uk.
. X. Tang is with the Department of Information Engineering, The Chinese University of Hong Kong, Shatin, New Territories, Hong Kong. E-mail: [email protected].
. X. Wu is with the Department of Computer Science, University of Vermont, 33 Colchester Avenue, Burlington, VT 05405.
E-mail: [email protected].
Manuscript received 4 Jan. 2005; revised 17 Aug. 2005; accepted 30 Sept. 2005; published online 11 May 2006.
Recommended for acceptance by A. Rangarajan.
For information on obtaining reprints of this article, please send e-mail to: [email protected], and reference IEEECS Log Number TPAMI-0010-0105.
samples is small, the performance of SVM RF becomes poor. This is mainly due to the following three reasons:
. First, an SVM classifier is unstable for a small-sized training set, i.e., the optimal hyperplane of SVM is sensitive to the training samples when the size of the training set is small. In SVM RF, the optimal hyper-plane is determined by the feedback samples. However, more often than not, the users would only label a few images and cannot label each feedback sample accurately all the time. Therefore, the performance of the system may be poor with insufficient and inexactly labeled samples.
. Second, SVM’s optimal hyperplane may be biased when the positive feedback samples are much less than the negative feedback samples. In the relevance feedback process, there are usually many more negative feedback samples than positive ones. Because of the imbalance of the training samples for the two classes, SVM’s optimal hyperplane will be biased toward the negative feedback samples. Consequently, SVM RF may mistake many query-irrelevant images as relevant ones.
. Finally, in relevance feedback, the size of the training set is much smaller than the number of dimensions in the feature vector and, thus, may cause an overfitting problem. Because of the existence of noise, some features can only discriminate the positive and negative feedback samples but cannot distinguish the relevant or irrelevant images in the database. So, the learned SVM classifier, which is based on the feedback samples, cannot work well for the remaining images in the database.
In order to overcome these problems, we design a set of new algorithms to improve the SVM RF for CBIR. The key idea comes from the classifier committee learning (CCL) [2], [7], [12]. Since each classifier has its own unique ability and property to classify relevant and irrelevant samples, the CCL can pool a number of weak classifiers to improve the recognition performance. We use bagging and a random subspace method to improve the SVM since they are especially effective when the original classifier is not very stable.
The rest of the paper is organized as follows: In Section 2, SVM-based relevance feedback is briefly introduced. In Section 3, we propose three algorithms based on SVM and CCL, and in Section 4, we present our image retrieval system. A large number of experiments are given in Sections 5 (with toy problems) and Section 6 (using the Corel Photo Gallery with 17,800 images). Related work is discussed in Section 7 and the conclusion is drawn in Section 8.
2
B
ACKGROUND: SVM-B
ASEDR
ELEVANCEF
EEDBACK INC
ONTENT-B
ASEDI
MAGER
ETRIEVALSVM [29], [3] is a very effective binary classification algorithm. Consider a linearly separable binary classifica-tion problem (as shown in Fig. 1):
fðxi; yiÞgNi¼1andyi¼ þf 1;1g; ð1Þ
wherexiis an n-dimension vector andyi is the label of the class that the vector belongs to. SVM separates the two classes of points by a hyperplane,
wTxþb¼0; ð2Þ
wherewis an input vector,xis an adaptive weight vector, andbis a bias. SVM finds the parameterswandb for the optimal hyperplane to maximize the geometric margin
2=kwk, subject to
yi wTxiþb
þ1: ð3Þ
The solution can be found through a Wolfe dual problem with the Lagrangian multiplied byi:
QðÞ ¼X m
i¼1
i
Xm
i;j¼1
ijyiyjðxixjÞ=2; ð4Þ
subject toi0andPim¼1iyi¼0.
In the dual format, data points only appear in the inner product. To get a potentially better representation of the data, the data points are mapped into a Hilbert Inner Product space through a replacement:
xixj!ðxiÞ ðxjÞ ¼Kðxi;xjÞ; ð5Þ
where Kð:Þ is a kernel function. We then get the kernel version of the Wolfe dual problem:
QðÞ ¼X m
i¼1
i
Xm
i;j¼1
ijyiyjKðxi;xjÞ=2: ð6Þ
Thus, for a given kernel function, the SVM classifier is given by
Fð Þ ¼x sgnðfð Þx Þ; ð7Þ
where fð Þ ¼x Pli¼1iyiKðxi;xÞ þb is the output hyper-plane decision function of the SVM.
[image:4.612.323.508.78.201.2]In general, whenjfð Þxjfor a given pattern is high, the corresponding prediction confidence will be high. Mean-while, a lowjfð Þxjof a given pattern means that the pattern is close to the decision boundary and its corresponding prediction confidence will be low. Consequently, the output of SVM, fð Þx, has been used to measure the dissimilarity [8], [31] between a given pattern and the query image, in traditional SVM-based CBIR RF.
3
T
HREEC
LASSIFIERC
OMMITTEEL
EARNING(CCL)
A
LGORITHMS FORSVM
STo address the three problems of SVM-based relevance feedback described in the introduction, we propose three algorithms in this section.
3.1 Asymmetric Bagging SVM (AB-SVM)
Bagging [2] incorporates the benefits of bootstrapping and aggregation. Multiple classifiers can be generated by training on multiple sets of samples that are produced by bootstrapping, i.e., random sampling with replacement on the training samples. Aggregation of the generated classi-fiers can then be implemented by majority voting [1].
Experimental and theoretical results have shown that bagging can improve agood but unstableclassifier significantly [2]. This is exactly the case of the first problem of SVM RF. However, directly using bagging in SVM RF is not appropriate since we have only a very small number of positive feedback samples. To overcome this problem, we develop a novel asymmetric bagging strategy. The bootstrapping is executed only on the negative feedback samples since there are far more negative feedback samples than the positive feedback samples. This way each generated classifier will be trained on a balanced number of positive and negative samples, thus solving the second problem as well. The asymmetric bagging SVM (AB-SVM) algorithm is described in Table 1.
In AB-SVM, the aggregation is implemented by the Majority Voting Rule (MVR). The asymmetric bagging strategy solves the unstable problem of SVM classifiers and the unbalance problem in the training set. However, it cannot solve the small sample-size problem. We will solve it by the Random Subspace Method (RSM) in the next section.
3.2 Random Subspace SVM (RS-SVM)
Similar to bagging, the random subspace method (RSM) [7] also benefits from bootstrapping and aggregation. How-ever, unlike bagging that bootstraps training samples, RSM performs the bootstrapping in the feature space.
For SVM RF, overfitting happens when the training set is relatively small compared to the high dimensionality of the feature vector. In order to avoid overfitting, we sample a small subset of features to reduce the discrepancy between the training data size and the feature vector length. Using a random sampling method, we construct a multiple number of SVMs. We then combine these SVMs to construct a more powerful classifier to solve the overfitting problem. Our
RSM-based random subspace SVM (RS-SVM) is described in Table 2.
3.3 Asymmetric Bagging and Random Subspace SVM (ABRS-SVM)
Since the asymmetric bagging method can overcome the first two problems of SVM RF and the RSM can overcome the third problem of the SVM RF, we should be able to integrate the two methods to solve all the three problems together. So, we propose an asymmetric bagging and random subspace
SVM (ABRS-SVM) to combine the two. The algorithm is described in Table 3.
In order to explain why the asymmetric bagging and random subspace strategy works, we derive the proof following a similar discussion on bagging in [2].
Letðy;xÞ be a data sample in the training setLwith a feature vectorF, whereyis the class label of the samplex andLis drawn from a probability distributionP. Suppose
’ðx; L; FÞ is a simple predictor (classifier) constructed by theasymmetric bagging and random subspacestrategy and the aggregated predictor is
’Aðx; PÞ ¼EFEL’ðx; L; FÞ:
Let random variables ðY ;XÞ be drawn from the distribution independent of the training set L. The average predictor error, estimated by ’ðx; L; FÞ, is TABLE 1
[image:5.612.294.537.92.462.2]Algorithm of Asymmetric Bagging SVM (AB-SVM)
TABLE 2
[image:5.612.30.272.101.232.2]Algorithm of Random Subspace SVM (RS-SVM)
TABLE 3
ea¼EFELEY ;xðY ’ðX; L; FÞÞ2. The corresponding error
estimated by the aggregated predictor is
eA¼EY ;xðY ’AðX; PÞÞ2: ð8Þ
Using the inequality,
1 M
XM
j¼1
1 N
XN
i¼1
zij 2
1
M XM
j¼1
1 N
XN
i¼1
zij
!2
;
we have
EFEL’2ðX; L; FÞ ðEFEL’ðX; L; FÞÞ2: ð9Þ
Through (9), we have
EY ;XEFEL’2ðX; L; FÞ EY ;X’2AðX; PÞ: ð10Þ
Thus, from (8) and (10), we can obtain
ea¼EY ;XY22EY ;XY ’AþEY ;XEFEL’2ðX; L; FÞ
EY ;XðY ’AÞ2¼eA:
ð11Þ
Here, we have made an assumption that the average performance of all the individual classifiers’ðx; L; FÞ, each trained on a subset of features and the training set replicas, is similar to a classifier which uses the full feature set and the whole training set.
This can be true when the sizes of features and training data are adequate to approximate the full data distribution. Even when this is not true, the drop of accuracy for each single classifier may be well compensated in the aggrega-tion process.
As in (11), from the inequality, we can see that the more diverse is the’ðx; L; FÞ, the more accurate is the aggregated predictor. Practically, the aggregated predictor is not
’Aðx; PÞ, but ’Aðx; P0Þ because theasymmetric bagging and
random subspacestrategy is used on the training set.P0and
P are consistent in the probability space.
If the classifier’is stable,’Aðx; P0Þ(which approximates
’ðx; L; FÞ) given by the asymmetric bagging and random subspacestrategy is not as accurate as’ðx; PÞ. Therefore, the strategy may not work. However, if is unstable (because
weak classifiers are diverse), ’ðx; P0Þ can improve the performance.
In CBIR RF, SVM classifiers are unstable both for the training features and for the training samples. Conse-quently, theasymmetric bagging and random subspacestrategy can improve the performance to generate the asymmetric bagging and random subspaceSVM (ABRS-SVM).
There are many different ways to do the aggregation, two of which are hierarchical and parallel structures. The hierarchical ABRS-SVM (HABRS-SVM) structure of the aggregation is shown in Fig. 2 and Fig. 3 illustrates the parallel ABRS-SVM (PABRS-SVM) structure.
For a given pattern, we first recognize it by a series of weak SVMs, which are constructed by the bootstrapping training set and features and are denoted as fCij¼C Fi; Sj
j1
iTf;1jTsg. Then, we recognize it on a subset of weak classifiersfCi¼C Fi; Sj
j1iTfg, which are con-structed on the same training examples, but with different training features. At last, we use these outputs and the aggregation rule to construct the destination classifier. For example, if the aggregation rule is majority voting and the weak classifierCijðx;Fi;SjÞ 2f0;1g, we can represent it as:
Cð Þ ¼x sgn X
j
sgn X
i
Cijðx;Fi;SjÞ Tf1
2
" #
Ts1
2
( )
:
ð12Þ
The parallel structure of the aggregation is shown in Fig. 3. For a given pattern, we recognize it by all weak SVMs
Cij¼C F i; Sjj1iTf;1jTs
. Then, an aggrega-tion rule is utilized to classify it as query relevant or irrelevant. For example, if the aggregation rule is majority voting and the weak classifierCijðx;Fi;SjÞ 2f0;1g, we can represent it as:
Cð Þ ¼x sgn X
i;j
Cijðx;Fi;SjÞ
TsTf1
2
( )
: ð13Þ
[image:6.612.118.431.67.272.2] [image:6.612.293.540.559.601.2]Since theasymmetric bagging and random subspacestrategy can generate more diversified classifiers than using bagging or RSM alone, it should outperform the two. In order to Fig. 2. Hierarchical structure of aggregation.
achieve the maximum diversity, we choose to combine all generated classifiers in parallel as shown in Fig. 3. The experiments (Figs. 10, 11, 12, and 13 in Section 6.3) show that this is better than combining bagging or RSM first and then combing RSM or bagging.
In summary, for a given test sample, we first recognize it by allTfTsweak SVM classifiers:
Cij¼C F i; Sjj1iTf;1jTs
: ð14Þ
Then, an aggregation rule is used to integrate all the results from the weak classifiers for final classification of the sample as either relevant or irrelevant.
3.4 Aggregation Model
After training a given classifier committee learning (CCL) model, such as AB-SVM or RS-SVM, an aggregation rule should be given to combine the weak classifiers. Many aggregation models have been developed, such as the MVR [1], Bayes sum rule (BSR) [12], Bayes product rule [12], LSE-based weighting rule [11], double-layer combination [10], Dempster-Shafer model [28], and some nonlinear methods. In this paper, we only focus on the MVR and the BSR, due to their good performance in pattern classification.
3.4.1 Majority Voting Rule (MVR)
MVR is the simplest method to combine multiple classifiers. Given a series of weak classifiers fCiðxÞ;1iNg, the MVR can be represented as follows:
Cð Þ ¼x sgn X
i
CiðxÞ N1
2
( )
: ð15Þ
MVR does not consider any individual behavior of each weak classifier. It only counts the largest number of classifiers that agree with each other.
3.4.2 Bayes Sum Rule (BSR)
MVR does not consider the behaviors of the weak classifiers. If one classifier is much more accurate than all the others, the MVR cannot take advantage of it. To address this problem, Kittler et al. [12] proposed a general theoretical framework based on the Bayesian decision rule. We select BSR in this paper to aggregate multiple classifiers because BSR outper-form most of the other rules.
Let zið1iRÞ be the ith classifier, where R is the number of classifiers. In the BSR measurement space, each class Yk is modeled by the probability density function (PDF)pðzijykÞ. Assuming its priori-probability ispðykÞ, BSR combineszi as follows:
Cð Þ ¼x arg max
k
1R
ð ÞP yð Þ þk
XR
i¼1
P yð kjziÞ
" #
: ð16Þ
To use the BSR in our schemes (AB-SVM, RS-SVM, and ABRS-SVM), a probability model is required. As shown in [19], the sigmoid function combined with the output of SVM can be used to estimate the class-conditional prob-ability for a given instancexby
PðykjziÞ ¼1=f1þexpðjfiðxÞjÞg: ð17Þ
We do not need to consider pðykÞ here because the probability for an unknown sample to be query relevant or irrelevant is equal. Then, BSR is simplified as follows:
Cð Þ ¼x arg max
k
XR
i¼1
P yð kjziÞ
" #
: ð18Þ
3.5 Dissimilarity Measure
3.5.1 Using MVR to Combine SVMs (MVR-SVM)
For a given sample, we first use the MVR to recognize it as query relevant or irrelevant. Then, we measure the dissim-ilarity between the sample and the query as the output of the individual SVM classifier, which gives the same label as the MVR and produces the highest confidence value (the absolute value of the decision function of the SVM classifier).
3.5.2 Using BSR to Combine SVMs (BSR-SVM)
For a given sample, we first use the BSR to recognize it as query relevant or irrelevant. Then, we measure the dissimilarity between the sample and the query using the individual SVM classifier, which gives the same label as the BSR and has the highest confidence value.
3.5.3 Bayes Sum Rule (BSR)
From the definition of the BSR, the output of the BSR
PR
i¼1P yð kjxiÞ can also be used as a dissimilarity measure between a given sample and the query.
In this paper, we will compare all the three rules for ABRS-SVM-based relevance feedback.
3.6 Computational Complexity Analysis
From [3], we know that the computational complexity for training a SVM isO SV Mð Þ ¼Oðn3sþns2LþnsnfLÞ, wherens is the number of support vectors,nfis the number of feature dimensions, andLis the size of the training set. From the formula of the output of SVM, the number of the support vectorsnsdetermines the computational complexity in the testing stage. We denote the computational complexity for a multiplication and addition of two real values asN andL, respectively. Then the computational complexities of SVM, AB-SVM, RS-MSVM, and ABRS-SVM are given in Table 4.
4
T
HEC
ONTENT-B
ASEDI
MAGER
ETRIEVALS
YSTEMCBIR assumes that the user expects the best possible retrieval results after each relevance feedback iteration, i.e., the search engine is required to return the most semantically relevant images based on the previous feedback samples. At the same time, the user is impatient and 1) will never label a significant number of images for each relevance feedback iteration and
TABLE 4
2) only does a few numbers of iterations. To deal with this type of scenario, the following CBIR framework is proposed. With the proposed system, we can embed many kinds of relevance feedback algorithms easily.
From Fig. 4, when a query (image) is given, the low-level visual features are extracted. Then, all images in the database are sorted based on a similarity metric. If the user is satisfied with the results, the retrieval process is ended. However, most of the time, the relevance feedback is needed because of a poor retrieval performance. The user labels some top images as positive feedback samples or negative feedback samples. Using these feedback samples, a relevance feedback model can be trained based on certain machine learning algorithms. The similarity metric can be updated as well as the relevance feedback model. Then, all the images are resorted based on the recalculated similarity metric. If the user is not satisfied with the results, the relevance feedback process will be performed iteratively.
This system implements the ABRS-SVM algorithm in Section 3 and compares its accuracy with several state-of-the-artrelevance feedback algorithms. In the system, images are represented by three main features: color [23], [17], [14], [9], [16], texture [14], [24], [13], [15], [4], [30], and shape [9], [16]. The color information is the most informative feature for image retrieval because of its robustness with respect to scaling, rotation, perspective, and occlusion of the image [23]. The texture information is another important cue for image retrieval. Previous studies have shown that texture informa-tion according to the structure and orientainforma-tion fits well with the model of human perception and so does the shape information. Details of the three features are given as follows:
. Color. A 256-bin HSV color histogram [23] is selected. Hue and saturation are both quantized into eight bins, while value is quantized into four bins.
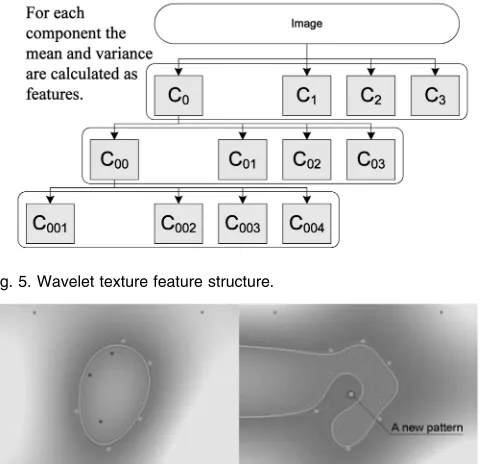
. Texture. The system selects the pyramidal wavelet transform (PWT) from the Y component in the YCrCb space for texture representation. An image is decomposed by the traditional PWT with Haar wavelet, and the mean and standard deviation are calculated in terms of the subbands at each decom-posed level. The decomposition procedure can be seen from Fig. 5.
. Shape. the edge direction histogram (EDH) [14] is employed to capture the spatial distribution of edges as a good shape figure. EDH is calculated upon the Y component in the YCrCb color space into five categories, namely, horizontal, 45 diagonal, vertical, 135 diagonal, and isotropic.
Each feature has its own power to characterize a type of image content. The system combines the color, texture, and shape features into a feature vector and then normalizes the vector into a normal distribution.
5
E
XPERIMENTS WITHT
OYP
ROBLEMS5.1 SVM is Unstable for a Small-Sized Training Set
The toy problem in Fig. 6 shows that the optimal hyperplane of the SVM is sensitive to small changes of the training set. The left figure shows an optimal hyperplane, which is trained by the original training set. The right figure shows a much different optimal hyperplane, which is trained by the original training set with only one incremental pattern.
5.2 SVM is Biased with Unbalanced Training Set
[image:8.612.139.427.74.185.2]The toy problem in Fig. 7 shows that the optimal hyperplane of the SVM, which is trained by an unbalanced training set, will bias toward the class with more training samples. The left figure shows the overview of the training set. Through the right figure, which is cut from the bottom-right part of the left figure, we can see that the optimal hyperplane biases toward the class with more training examples.
[image:8.612.305.530.499.624.2]Fig. 4. Image retrieval system flow chart.
[image:8.612.296.537.500.732.2]Fig. 5. Wavelet texture feature structure.
[image:8.612.293.537.652.743.2]5.3 The Visual Features Are Diverse for CBIR
This toy problem is constructed from some real-world data in relevance feedback. There are four positive and seven negative feedback samples. We randomly select two features to construct SVM’s optimal hyperplane for three times. They are visualized in Fig. 8. We can see that the individual SVM classifiers are diverse with different features.
6
E
XPERIMENTALR
ESULTS WITHC
ORELI
MAGES Our image retrieval system is implemented with a real-world image database including 17,800 Corel images—a subset of the Corel Photo Gallery [30]. Some samples are shown in Fig. 9.In the Corel Photo Gallery, each folder includes 100 images. However, the folders’ names are not suitable as conceptual classes. So, the 17,800 images are manually labeled into about 90 concepts as the ground truth.
The experiments are simulated by a computer automati-cally. First, 300 queries are randomly selected from the data, and then relevance feedback is automatically done by the computer: All query relevant images (i.e., images of the same concept as the query) are marked as positive feedback samples in the top 40 images and all the other images are marked as negative feedback samples. In general, we have about five images as positive feedback samples. The procedure is close to
real-world circumstances because the user typically would not like to click on the negative feedback samples.
Requiring the user to mark only the positive feedback samples in the top 40 images is reasonable. Since the visual features cannot well describe semantic contents, a system usually asks the user to mark three-four screen shots of images in the current retrieval process. Meanwhile, for some applications, the user would like to label only a small number of feedback samples and expect to get the best results hitherto wherever they terminate the query process. However, for some other users, they would like to cooperate with the system and, thus, can provide many (screens of) positive/negative examples [33]. In addition, even though the user stops earlier, the proposed scheme can still work well upon the Corel image database—when negative feedback samples are not as many as positive feedback samples, we can conduct bagging (not the asymmetric bagging) directly. Therefore, the assumption of top 40 images is made for our experiments below.
[image:9.612.34.270.70.244.2] [image:9.612.305.521.72.250.2]In this paper, precision and the standard deviation (SD) are used to evaluate the performance of a relevance feedback algorithm. Precision is the percentage of relevant images in the top N retrieved images. The SD serves as an error-bar, while the precision is the major evaluation method. As an important auxiliary of the precision, the SD can well describe the stability of different algorithms and, so, it is also a key Fig. 7. SVM’s optimal hyperplane is deflected.
[image:9.612.302.520.81.421.2]Fig. 8. The features are diverse.
Fig. 9. Samples in the relabeled image database.
Fig. 10. AB-SVM-based relevance feedback.
[image:9.612.303.521.265.453.2] [image:9.612.30.271.269.437.2]feature of any relevance feedback schemes. The precision curve is the averaged precision values of 300 queries and the SD values are the standard deviation of the 300 queries’ precision values. The precision curve evaluates the effective-ness of a given algorithm and the corresponding SD evaluates the robustness of the algorithm. In the precision and SD curves, 0 feedback refers to the retrieval based on the Euclidean distance measure without relevance feedback.
We compare all the proposed algorithms with the original SVM RF [31] and the constrained similarity measure using SVM (CSM)-based relevance feedback [6]. We chose the Gaussian kernel Kðx;yÞ ¼ekxyk2
with ¼1 for all the algorithms because it achieves the best performances for all kernel-based algorithms according to a series of experiments with different kernel parameters. In our paper, we use the OSU-SVM [34] for all SVM-based RFs. Furthermore, since the Gaussian kernel is used here, the kernel Gram matrix is always full rank. Consequently, the training error is zero during the RF procedure for all SVM-based RFs.
6.1 Performance of AB-SVM
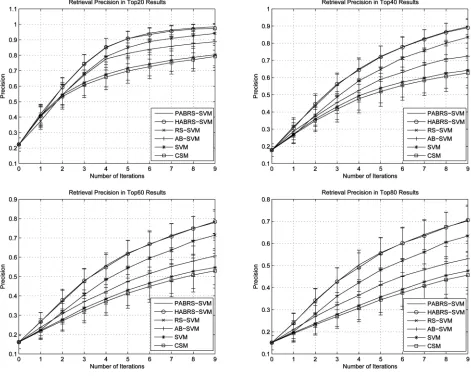
Fig. 10 shows the precision and SD values when using different numbers of SVMs in AB-SVM. The results demonstrate that the number of SVMs does not affect the performance of the asymmetric bagging method.
From these experiments, we can see that five weak SVMs are enough for AB-SVM, and AB-SVM clearly outperforms both SVM and CSM. The precision curve of AB-SVM is higher than that of SVM and CSM and the SD value is lower than that of SVM and CSM.
In Figs. 10, 11, 12, and 13, the SD (error bar) values are scaled by 4 for a clearer presentation.
6.2 Performance of RS-SVM
Fig. 11 shows the precision and SD values when using different numbers of SVMs of RS-SVM. The results show that the number of SVMs does not affect the performance of RS-SVM.
The results demonstrate that five weak SVMs are enough for the RS-SVM and RS-SVM outperforms SVM and CSM.
6.3 Performance of ABRS-SVM
This set of experiments evaluate the performances of the proposed ABRS-SVM, AB-SVM, and RS-SVM. We chose
Ts¼5 for ABSVM, Tf¼5 for RS-SVM, and Ts¼Tf¼5 for ABRS-SVM.
[image:10.612.47.518.75.451.2]The results in Fig. 12 show that ABRS-SVM gives the best performance followed by RS-SVM then AB-SVM. They all outperform SVM and CSM.
6.4 Evaluation of Aggregation Models
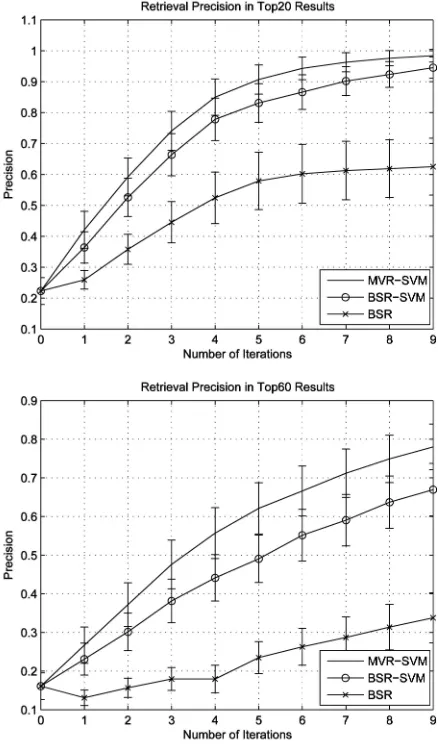
[image:11.612.46.265.72.445.2]This set of experiments evaluates the performances of three different dissimilarity measures, MVR-SVM, BSR, and BSR-SVM, for the proposed ABRS-SVM-based relevance feed-back. All algorithms are evaluated over nine iterations. The precision and SD curves are reported in Fig. 13. From this figure, we see that MVR-SVM can outperform both BSR-SVM and BSR.
BSR-SVM considers the behavior of weak classifiers, so, in theory, it may outperform MVR-SVM. However, according to the experimental results, its performance is worse than MVR-SVM, because we cannot estimate the behavior exactly for unstable weak classifiers. From Fig. 13, we find that BSR is much worse than MVR-SVM and BSR-SVM because MVR-BSR-SVM and BSR-BSR-SVM choose the best individual SVM to measure the dissimilarity between a given image and the user’s sentiment. BSR uses the averaged probabilities, which cannot be estimated exactly. Therefore, MVR-SVM is the best choice.
6.5 Computational Complexity
Because the size of the training set is small, the overall computational complexity is mostly determined by the testing stage. Thensfor SVM RF is much bigger than that of AB-SVM and ABRS-SVM, and the nf of SVM RF is much
bigger than that of RS-SVM and ABRS-SVM. Thus, the computational complexity of SVM RF is much higher than that of AB-SVM, RS-SVM, and ABRS-SVM. In general, for each of the four algorithms, the inequality nf> ns holds because the number of feedback samples is much smaller than the number of feature dimensions. Consequently, the computational complexity of AB-SVM is higher than RS-SVM and ABRS-SVM, and the computational complexity of RS-SVM is lower than that of ABRS-SVM. Our experiments have confirmed these observations.
To verify the efficiency of the proposed algorithms, we record the computational time in the experiments. The ratio for the time used by different methods are SVM: CSM: AB-SVM: RS-SVM: ABRS-SVM = 25: 25: 11: 3: 5. This shows that the new SVM-based algorithms are much more efficient than existing SVM-based algorithms.
7
R
ELATEDW
ORK [image:11.612.297.519.72.443.2]differs from both Tieu and Viola’s AdaBoost image retrieval in [26] and Guo’s AdaBoost [6], for the following reasons:
. Tieu and Viola employed more than 45,000 highly selective features. These features were demonstrated to be sparse with high kurtosis and were argued to be expressive for high-level semantic concepts [26], [33]. However, our scheme is designed to work upon the traditional low-level visual features (as intro-duced in Section 4). The constrained similarity measure (CSM) [6] claimed that the SVM outper-forms AdaBoost when the traditional visual features are selected as the image description method.
. In [26], AdaBoost was used for feature selection based on the training set (the selected feedback samples). In our work, the new scheme randomly selects features and training samples.
. Boosting aims to minimize the training error by assigning a weight to each of a series of weak classifiers and then combining them for a vote. Conventional boosting schemes, such as AdaBoost, cannot boost the performance of strong classifiers (e.g., SVM) since the
zero-training-errorin strong classifiers is generally set as the criterion for stopping the boosting training. The
zero-training-erroris easy to get because the dimension-ality of the low-level features is much larger than the number of the feedback samples in relevance feed-back. Consequently, boosting methods degenerate to a single strong classifier. On the contrary, for our presented scheme, from the mathematical description of the working principle, we can see that the scheme can combine a series of diverse SVM classifiers and yield better performances.
. Both SVM and Adaboost use the margin maximization criterion (MMC). However, SVM and AdaBoost use
L2norm andL1norm for weight vectors, respectively. Furthermore, SVM and AdaBoost useL2norm and
Linfnorm for instance vectors, respectively.
There are also significant differences between boosting and the bagging approach we have used. First, boosting trains weak classifiers based on a resampling using the training error information, so boosting can only improve the performance of basic classifiers, which cannot correctly classify some of the training samples. In relevance feedback, the samples’ size is smaller than the number of the samples’ feature dimensions, so boosting cannot work well in our context when the selected basic classifiers are SVMs. Second, for relevance feedback in retrieval, the feedback samples are limited, especially the positive feedback samples, so the weights for boosting-leant basic/weak classifiers are only optimal for the training set but not the testing set. Unlike the boosting, bagging does not generate any weights for its weak classifiers. Therefore, bagging does not meet the overfitting issues in boosting.
Furthermore, we do not use traditional supervised feature selection methods because they generally face an overfitting problem as well. This overfitting problem is due to the limited feedback samples especially the positive samples in the relevance feedback procedure. Unlike traditional supervised feature selection methods, the
ran-dom subspace method does not select features to minimize the training error or maximize the margin between the positive and negative feedback samples, but utilizes the diverse characteristics of different features. The mathema-tical explanation of the working principle of the framework in Section 3.2 can well explain this claim.
For unsupervised feature selection, it is always based on some selection criterion. When the criterion is good enough to capture the user’s preferences, it might work more effectively than ours. However, because the size of a real-world image database can be very large, to find such a criterion seems to be impossible. In addition, different users can have different viewpoints on the same images. Finally, unsupervised feature selection is time consuming and, thus, it does not fit with online learning. Consequently, using the same unsupervised feature selection criterion for all users is not a wise option.
8
C
ONCLUSIONWith the explosive growth in image records and the rapid increase of computer power, retrieving images from a large-scale image database becomes one of the most active research fields. Content-based image retrieval (CBIR) is a technique to retrieve images semantically relevant to the user’s query from an image database. Relevance feedback (RF) is a way of bridging this gap and scaling the performance in CBIR systems. Support vector machines (SVM) based rele-vance feedback is widely employed. However, when the number of positive feedback samples is small, the perfor-mance of SVM RF becomes poor because of the following facts: 1) the SVM classifier is unstable for a small-sized training set, 2) the optimal hyperplane of SVM may be biased, and 3) SVM always encounters an overfitting problem. In this paper, we have designed a newasymmetric bagging and random subspace mechanism (with three algorithms) to address the three key problems. Extensive experiments on a Corel Photo database with 17,800 images have shown that the new mechanism can improve the performance of relevance feed-back significantly.
In our proposed system, it is found that the kernel parameters affect the performance of relevance feedback algorithms. Unfortunately, how to select the kernel para-meters is a problematic issue. Recently, a tuning method has been provided in our system for the user to select the parameters of SVM. In the future, the tuning method will be tested and generalized to select the parameters of kernel-based algorithms. For relevance feedback in CBIR, the size of the training set is small, so theleave-one-outmethod to tune the parameters will be a good choice.
A
CKNOWLEDGMENTSR
EFERENCES[1] D. Bahler and L. Navarro, “Methods for Combining Heteroge-neous Sets of Classifiers,” Proc. 17th Nat’l Conf. Am. Assoc. for Artificial Intelligence,2000.
[2] L. Breiman, “Bagging Predictors,”Machine Learning,vol. 24, no. 2, pp. 123-140, 1996.
[3] J.C. Burges, “A Tutorial on Support Vector Machines for Pattern Recognition,”Data Mining and Knowledge Discovery,vol. 2, no. 2, pp. 121-167, 1998.
[4] T. Chang and C. Kuo, “Texture Analysis and Classification with Tree-Structured Wavelet Transform,”IEEE Trans. Image Processing,
vol. 2, no. 4, pp. 429-441, 1993.
[5] Y. Chen, X. Zhou, and T.S. Huang, “One-Class SVM for Learning in Image Retrieval,”Proc. IEEE Int’l Conf. Image Processing,pp. 815-818, 2001.
[6] G. Guo, A.K. Jain, W. Ma, and H. Zhang, “Learning Similarity Measure for Natural Image Retrieval with Relevance Feedback,”
IEEE Trans. Neural Networks,vol. 12, no. 4, pp. 811-820, 2002.
[7] T.K. Ho, “The Random Subspace Method for Constructing Decision Forests,” IEEE Trans. Pattern Analysis and Machine Intelligence,vol. 20, no. 8, pp. 832-844, Aug. 1998.
[8] P. Hong, Q. Tian, and T.S. Huang, “Incorporate Support Vector Machines to Content-Based Image Retrieval with Relevant Feed-back,”Proc. IEEE Int’l Conf. Image Processing,pp. 750-753, 2000.
[9] A. Jain and A. Vailaya, “Image Retrieval Using Color and Shape,”
Pattern Recognition,vol. 29, no. 8, pp. 1233-1244, 1996.
[10] M. Jordan and R. Jacobs, “Hierarchical Mixtures of Experts and the EM Algorithm,” Int’l. J. Neural Computation, vol. 6, no. 5, pp. 181-214, 1994.
[11] D. Kim and C. Kim, “Forecasting Time Series with Genetic Fuzzy Predictor Ensemble,” IEEE Trans. Fuzzy Systems, vol. 5, no. 4, pp. 523-535, 1997.
[12] J. Kittler, M. Hatef, P.W. Duin, and J. Matas, “On Combining Classifiers,”IEEE Trans. Pattern Analysis and Machine Intelligence,
vol. 20, no. 3, pp. 226-239, Mar. 1998.
[13] B. Manjunath and W. Ma, “Texture Features for Browsing and Retrieval of Image Data,”IEEE Trans. Pattern Analysis and Machine Intelligence,vol. 18, no. 8, pp. 837-842, Aug. 1996.
[14] B. Manjunath, J. Ohm, V. Vasudevan, and A. Yamada, “Color and Texture Descriptors,” IEEE Trans. Circuits and Systems for Video Technology,vol. 11, no. 6, pp. 703-715, 2001.
[15] J. Mao and A. Jain, “Texture Classification and Segmentation Using Multiresolution Simultaneous Autoregressive Models,”
Pattern Recognition,vol. 25, no. 2, pp. 173-188, 1992.
[16] W. Niblack, R. Barber, W. Equitz, M. Flickner, E. Glasman, D. Petkovic, P. Yanker, C. Faloutsos, and G. Taubino, “The QBIC Project: Querying Images by Content Using Color, Texture, and Shape,” Proc. SPIE Storage and Retrieval for Images and Video Databases,pp. 173-181, 1993.
[17] G. Pass, R. Zabih, and J. Miller, “Comparing Images Using Color Coherence Vectors,”Proc. ACM Int’l Conf. Multimedia,pp. 65-73, 1996.
[18] J. Peng, “MultiClass Relevance Feedback Content-Based Image Retrieval,”Computer Vision and Image Understanding,vol. 90, no. 1, pp. 42-67, 2003.
[19] J. Platt, “Probabilistic Outputs for Support Vector Machines and Comparison to Regularized Likelihood Methods,”Proc. Advances in Large Margin Classifiers,pp. 61-74, 2000.
[20] G. Ratsch, S. Mika, B. Scholkopf, and K.R. Muller, “Constructing Boosting Algorithms from SVMs: An Application to One-Class Classification,” IEEE Trans. Pattern Analysis and Machine Intelli-gence,vol. 24, no. 9, pp. 1184-1199, Sept. 2002.
[21] Y. Rui, T.S. Huang, and S. Mehrotra, ”Content-Based Image Retrieval with Relevance Feedback in MARS,” Proc. IEEE Int’l Conf. Image Processing,vol. 2, pp. 815-818, 1997.
[22] A.W.M. Smeulders, M. Worring, S. Santini, A. Gupta, and R. Jain, “Content-Based Image Retrieval at the End of the Early Years,”
IEEE Trans. Pattern Analysis and Machine Intelligence,vol. 22, no. 12, pp. 1349-1380, Dec. 2000.
[23] M. Swain and D. Ballard, “Color Indexing,” Int’l J. Computer Vision,vol. 7, no. 1, pp. 11-32, 1991.
[24] H. Tamura, S. Mori, and T. Yamawaki, “Texture Features Corresponding to Visual Perception,”IEEE Trans. Systems, Man, and Cybernetics,vol. 8, no. 6, pp. 460-473, 1978.
[25] D. Tao and X. Tang, “Random Sampling Based SVM for Relevance Feedback Image Retrieval,”Proc. IEEE Int’l Conf. Computer Vision and Pattern Recognition,pp. 647-652, 2004.
[26] K. Tieu and P. Viola, “Boosting Image Retrieval,”Proc. IEEE Int’l Conf. Computer Vision and Pattern Recognition,vol. 1, pp. 228-235, 2001.
[27] S. Tong and E. Chang, “Support Vector Machine Active Learning for Image Retrieval,”Proc. ACM Int’l Conf. Multimedia,pp. 107-118, 2001.
[28] V. Tresp and M. Taniguchi, “Combining Estimators Using Non-Constant Weighting Functions,” Advances in Neural Information Processing Systems,pp. 419-426, 1995.
[29] V. Vapnik, The Nature of Statistical Learning Theory. Springer-Verlag, 1995.
[30] J. Wang, J. Li, and G. Wiederhold, “SIMPLIcity: Semantics-Sensitive Integrated Matching for Picture Libraries,”IEEE Trans. Pattern Analysis and Machine Intelligence,vol. 23, no. 9, pp. 947-963, Sept. 2001.
[31] L. Zhang, F. Lin, and B. Zhang, “Support Vector Machine Learning for Image Retrieval,” Proc. IEEE Int’l Conf. Image Processing,pp. 721-724, 2001.
[32] X. Zhou and T.S. Huang, “Small Sample Learning During Multimedia Retrieval Using Biasmap,” Proc. IEEE Int’l Conf. Computer Vision and Pattern Recognition,vol. 1, pp. 11-17, 2001.
[33] X. Zhou and T.S. Huang, “Relevance Feedback for Image Retrieval: A Comprehensive Review,”ACM Multimedia Systems J.,vol. 8, no. 6, pp. 536-544, 2003.
[34] http://www.ece.osu.edu/~maj/osu_svm/, 2002.
Dacheng Taoreceived the BEng degree from the University of Science and Technology of China and the MPhil degree from the Chinese University of Hong Kong. He is currently a PhD candidate at the University of London. His research interests include acoustic signal matching and retrieval, bioinformatics, bio-metrics, computer vision, data mining, image processing, machine learning, multimedia infor-mation retrieval, pattern classification, and visual surveillance. He has published extensively withIEEE TPAMI,TIP,TMM, TCSVT, CVPR, ACM SIGMM, etc. He was a program committee member for several conferences such as the Sixth IEEE International Workshop on Visual Surveillance (in conjunction with ECCV 2006). Previously he gained several Meritorious Awards from the International Interdisciplinary Contest in Modeling, which is the highest level mathematical modeling contest in the world, organized by COMAP. He is a reviewer for a number of major journals and conferences such as TIP. He is a student member of the IEEE.
Xuelong Li is a lecturer at the University of London. His current research interests include visual surveillance, biometrics, data mining, multimedia information retrieval, cognitive com-puting, image processing, pattern recognition, and industrial applications. He has published more than 40 papers in the journals (TCSVT, TIP, TMM, TPAMI, etc.) and conferences (CVPR, ICASSP, ICDM, etc.). He was on the PCs of more than 30 conferences (BMVC, ECIR, ICDM, ICME, ICMLC, ICPR, PAKDD, PCM, SMC, WI, etc.). He has cochaired the fifth UKCI. He is an AE of theIJIG(World Scientific) andNeurocomputing(Elsevier). He is also on the EB ofIJITDM(World Scientific). He is a GE for anIJCM(Taylor & Francis) special issue. He is a reviewer for around 60 journals and conferences, including nine IEEE transactions. He is a member of the IEEE.
Xindong Wu received the PhD degree in artificial intelligence from the University of Edinburgh, Britain. He is a professor and the chair of the Department of Computer Science at the University of Vermont. His research interests include data mining, knowledge-based systems, and Web information exploration. He has pub-lished extensively in these areas in various journals and conferences, includingIEEE TKDE, TPAMI,ACM TOIS, IJCAI, AAAI, ICML, KDD, ICDM, andWWW, as well as 12 books and conference proceedings. Dr. Wu is the Editor-in-Chief of theIEEE Transactions on Knowledge and Data Engineering, the founder and current steering committee chair of the IEEE International Conference on Data Mining (ICDM), an honorary Editor-in-Chief of Knowledge and Information Systems (Springer), and a series editor of the Springer book series on advanced information and knowledge processing (AI&KP). He is the 2004 ACM SIGKDD Service Award winner. He is a senior member of the IEEE and the IEEE Computer Society.