5012
IMPROVEMENT OF DETECTING SMALL-SIZED TRAFFIC
SIGNS BASED ON DEEP LEARNING
HOANH NGUYEN
Faculty of Electrical Engineering Technology, Industrial University of Ho Chi Minh City, Ho Chi Minh City, Vietnam
E-mail: [email protected]
ABSTRACT
Traffic sign detection plays an important role in intelligent transportation systems. This paper proposes a new method for detecting small-sized traffic signs based on deep learning. MobileNets architecture is adopted as the base network to provide a rich and discriminative hierarchy of feature representations. A deconvolutional module is then integrated into Faster R-CNN framework to bring additional context information which is helpful to improve the detection accuracy for small-sized traffic signs. Additionally, atrous convolution is used in the region proposal network to enlarge the receptive field of the synthetic feature map. The proposed framework is trained and evaluated on German traffic sign detection benchmark. The results show that the proposed approach obtained an accuracy comparable to other the state-of-the-art approaches in traffic sign detection.
Keywords: Traffic Sign Detection, Convolutional Neural Network, Intelligent Transportation Systems,
Object Detection, Deep Learning
1. INTRODUCTION
Traffic sign detection plays an important role in intelligent transport systems, traffic management, and so on, and it has been an active area of research over the past decade. An automatic traffic sign detection system can assist the driver on the road such as reminding the driver of traffic constraints, stopping driver from performing inappropriate actions. Further, it could be integrated into an Automated Driving System (ADS) and Advanced Driver Assistance System (ADAS). Traditional approaches for traffic sign detection usually use color, texture, edge and other low-level features to detect the area or the edge of a traffic sign in an image such as adaboost [1], support vector machine (SVM) [2], Hough transform [3] and so on. These approaches based on low-level features do not detect or recognize traffic signs well because of variations in the traffic sign appearance due to different sign shapes or colors. Furthermore, objects such as trees and vehicles which may occlude the traffic signs make traffic sign detection become harder.
Recently, with fast development of deep learning [4, 5], a certain number of methods for traffic sign detection based on deep learning have been proposed. These methods show better performance than traditional methods. Deep CNN-based methods
firstly create traffic sign candidates. Then, a deep CNN-based classifier is used to reject non-traffic sign candidates. Although these methods perform well in complex conditions, the small size of traffic signs makes them hard to detect, and useful context information is not exploited fully by CNN-based approaches. A popular solution to this problem in CNNs is to combine information from the background [6] or relationships among the objects [7], which combines finer details from multiple convolution layers with different local receptive fields. But it has been found that simply concatenating these feature maps does not significantly improve the accuracy due to over-fitting caused by curse of dimensionality.
5013 authors combined coarse high-layer information with fine low-layer information for semantic segmentation.
Motivated by the above ideas, a novel effective traffic sign detection framework based on the Faster R-CNN [15] pipeline is introduced in this paper. This framework can achieve state-of-the-art performance on traffic sign detection. The main contributions of this paper are summarized as follows:
1) A novel traffic sign detection framework is proposed by adding the deconvolutional module to the traditional Faster R-CNN network. The deconvolutional module can bring in more semantic context information to enhance the feature map, thereby improving the detection performance.
2) This paper proposes using a reduced network architecture, in which the prior layer is used as the initial feature map with a relatively large spatial resolution, instead of using the last layer as the output feature map. In addition, proper adjustment of the network has been made to avoid downsampling. The proposed architecture help retain more detailed information for traffic signs, especially with small-sized traffic signs.
3) Instead of using multi-layer feature map, in which low-level layers have less semantic information regarding small instances, a synthetic feature map that combines the initial feature map and the deconvolution layer with semantic information is proposed.
4) This paper proposes applying atrous convolution on the synthetic feature map to enlarge the receptive field and inject detailed context information. Larger receptive fields help the detection of large-sized instances and detailed context information helps the detection of small-sized instances of traffic signs. Therefore, application of atrous convolution can improve the detection accuracy of multi-scale object detection. This paper is organized as follows: an overview of previous methods is presented in Section 2. Section 3 describes the detail of the proposed method. Section 4 demonstrates experimental results. Finally, the conclusion is made in Section 5.
2. RELATED WORK
In this section, this paper introduces previous work on license plate detection, including traditional methods and recently proposed methods based on deep CNN.
Traditional approaches to traffic sign detection include a wide variety of algorithms and various representations [22]. Escalera et al. [16] took advantage of color and shape features to detect road traffic signs, while Shadeed et al. [17] used histogram equalization, light control and color segmentation to locate road signs. Later, Garcia-Garrido et al. [3] employed the Hough transform to get the information from the edges in the image, but the computational complexity was high so that it hindered the real-time application. To deal with the efficiency problem, Bahlmann et al. [1] detected traffic signs using a set of Haar wavelet features obtained from AdaBoost training [18]. To balance effectiveness and efficiency, Salti et al. [2] proposed an approach in which the regions of interest rather than the sliding window were extracted at first, and then a histogram of oriented gradients (HOG) in the regions of interest was extracted, to be the input feature of the SVM classifier [19]. Recently, Berkaya et al. [20] extended this approach by using an ensemble of features including HOG, local binary patterns (LBP) and Gabor features within an SVM classification framework. To improve results obtained by single view analysis, Timofte et al. [21] combined 2D and 3D techniques to generate and evaluate 3D proposals. Traditional methods can be processed in real-time on low-end systems, and these methods achieve good performance in limited conditions such as simple background and environment, fixed illumination and so on. However, the performance of these methods will significantly reduce in complex conditions.
Recently, with fast development of deep learning, a certain number of methods for traffic sign detection based on deep CNN have been proposed. John et al. [23] used CNN to extract features and detect road traffic signs, making a saliency map containing the traffic light location. For network optimization, Jin et al. [24] suggested a hinge loss stochastic gradient descent (HLSGD) method to train a detection network. To perform fast and accurate traffic sign detection and recognition, Zhu et al. [25] employed a holistically nested edge detection network [26]. Deep CNN-based approaches are able to detect some traffic signs. However, constrained by feature map size, none show significant advantages.
3. THE PROPOSED FRAMEWORK
5014 that shares full-image convolutional features with the detection network, thus enabling nearly cost-free region proposals. RPN creates a set of anchor boxes from the convolution features created by the base network. For each anchor box, RPN outputs two predictions including objectness score and bounding box regression. Faster R-CNN is chosen for detecting traffic signs in this study because this framework shown the best performance for detecting small objects compared to other state-of-the-art deep CNN-based object detection frameworks such as R-FCN and SSD, while license plates usually have small size in an image. There are some deep CNN architectures that showed state-of-the-art performance on many competitions such as VGG-16, Resnet-101, Inception v2 and so on. Google recently released an efficient model called MobileNets for mobile and embedded vision applications. MobileNets splits the convolution into a 3x3 depthwise convolution and a 1x1 pointwise convolution, effectively reducing both computational cost and number of parameters. It introduces two parameters that we can tune to fit the resource/accuracy trade-off, including width multiplier and resolution multiplier. The width multiplier allows us to thin the network, while the resolution multiplier changes the input dimensions of the image, thus reducing the internal representation at every layer. In this study, MobileNets is adopted to build the base convolutional layers in Faster R-CNN. Figure 1 shows the overall framework of the proposed approach. As shown in this Figure, the proposed method consists of the base network for generating feature map, the deconvolution module for generating synthetic feature map, and region proposal network generated with atrous convolution and classification. Each image is forwarded through the convolution layers to generate feature maps. Based on these feature maps, this paper applies deconvolution with the encoder-decoder structure, combining the deconvolution layer with feature maps to generate the synthetic feature map that collects additional context information. Finally, atrous convolution is applied to the synthetic feature map to generate region proposals. These proposals are then classified and adjusted with the detection module. Details of the proposed approach are explained in next sections.
3.1 The Base Network
MobileNets architecture is used as a base network in this study. Since this paper uses only the convolution layers in MobileNets architecture, the size of the input image does not have to be fixed.
Supposing the size of the input image is 224 x 224 x 3, the architecture of the base network is defined as Table 1.
where:
‘Conv’ represents as a standard convolution ‘Conv dw’ represents as a depthwise separable convolution
‘s1’ represents that the convolution stride is 1 x 1 ‘s2’ represents that the convolution stride is 2 x 2
Depthwise separable convolution are made up of two layers: depthwise convolutions and pointwise convolutions. Depthwise convolutions is used to apply a single filter per each input channel, while pointwise convolution, a simple 1x1 convolution, is used to create a linear combination of the output of the depthwise layer. MobileNets use both batchnorm and ReLU nonlinearities for both layers. The reduction of computational cost is in proportion to the number of output feature map channel and the square of kernel size. More details about MobileNets architecture can be found in [27].
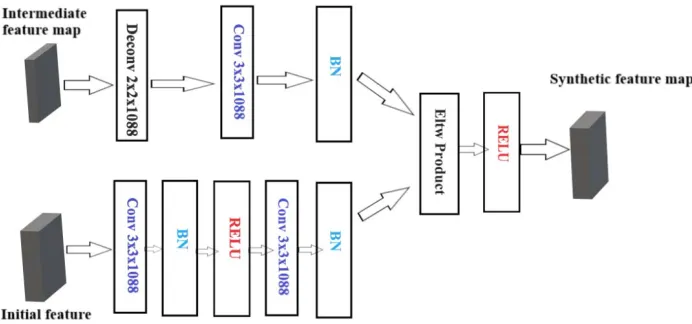
3.2 Deconvolutional Module
Pinheiro et al. [28] suggested that a factored version of the deconvolutional module for a refinement network has the same accuracy as a more complicated one and the network will be more efficient. Deconvolutional module is effective for small object detection [8]. Thus, to enhance the detection of traffic sign, adding extra deconvolution layers is proposed in this study. The deconvolutional module is built at the end of the base network. The structure of deconvolutional module is shown in Figure 2. As shown in this Figure, a 3 × 3 convolution layer and rectified linear activation are used. For the deconvolution branch, the encoder-decoder structure with 2×2 deconvolution is used followed by a 3×3 convolution. A batch normalization layer (BN) is added after each convolution layer. An intermediate feature map is extracted after Conv / s1 layer. Then, the deconvolution layer is added to enlarge the feature map size in order to match the size of the initial feature map. Finally, element-wise product is performed as a combination method, which is followed by rectified linear activation to generate the synthetic feature map.
3.3 Region Proposal Network (RPN)
5015 convolution onto the synthetic feature map to enlarge the receptive field and inject context information. Atrous convolution, which is a powerful tool in dense prediction tasks, allows us to effectively enlarge the field of view of filters to incorporate larger context without increasing the number of parameters or the amount of computation. Another advantage is that atrous convolution can be conveniently and seamlessly integrated to compute the responses of any layer. Figure 3 shows an example of feature extraction with atrous convolution. As shown, feature map a is produced from feature map b by an atrous convolution with rate r = 2. Feature map a corresponds to a receptive field of 9 × 9.
Atrous convolution with a rate r introduces r − 1
zeros between consecutive filter values, effectively enlarging the kernel size of a k × k filter to k′ × k′
without increasing the number of parameters or the amount of computation by using the following equation.
𝑘 𝑘 𝑘 1 𝑟 1 (1)
In this paper, the atrous convolution is used with a 3 × 3 kernel size and rate r = 2 leading to k′ = 5. The corresponding receptive field of each element is 47 × 47. After atrous convolution, the output shape is still unchanged, but the receptive field of each element is 79 × 79. Thus, more context information can be obtained. To solve the multiple-scale detection problem this paper uses three scales and three aspect ratios for each anchor, different anchors are used with four scales [0.25, 0.5, 1.0, 2.0] and three aspect ratios [0.5, 1.0, 2.0].
4. RESULTS
In this section, this paper compares the performance of the proposed method with other state-of-the-art methods. The proposed method is implemented on a machine with Core I5 6400, 8GB of RAM, NVIDIA GTX 1050Ti GPU. This paper uses TensorFlow for implementing deep CNN frameworks.
4.1 Dataset
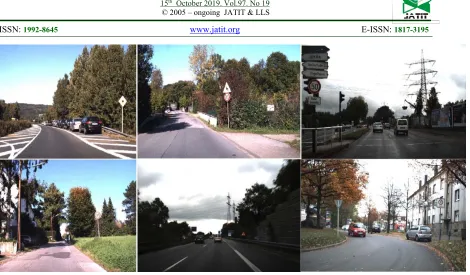
The GTSDB database [10] is adopted in this paper to train and evaluate traffic sign detector. GTSDB is the most widely used dataset in traffic sign detection. This dataset contains 900 images and is divided into 600 training images and 300 testing images. Each image has the size of 1360×800 pixels. The traffic signs in the GTSDB database can be divided into four categories: 161 Prohibitory signs
(usually of red color and circular shape), 49 Mandatory signs (usually of blue color and circular shape), 63 Danger signs (usually of red color and triangular shape), and other signs with different shapes and colors which cannot be classified into these three categories. Some examples of traffic sign in this dataset is shown in Figure 4. The sizes of traffic signs to detect in the GTSDB database vary from 16 × 16 to 128 × 128 and the size of traffic scenes is 800 × 1360.
4.2 Evaluation Criterion
In order to compare this work with other state-of-the-art methods on the same dataset, this paper uses the same widely used evaluation criteria in traffic sign detection, including precision and recall. A traffic sign is correctly detected only if the overlap between the detected bounding box and ground truth bounding box (Intersection over Union-IoU) is greater than 0.5. Precision is defined as ratio between the number of correctly detected traffic signs and the number of detected bounding box, while recall is defined as ratio between the number of correctly detected traffic signs and the number of ground truths. IoU is a threshold which measure the quality of detection.
4.3 Training
This paper uses MobileNet pre-trained model on ImageNet dataset and further fine-tuned on training data. The resulting model is fine-tuned using Stochastic Gradient Descent (SGD) with an initial learning rate of 0.0001, momentum of 0.9, and batch size of 1; the learning rate is reduced by a factor of 10 after 500,000 iterations and again after 700,000 iterations. Learning stops after 800,000 iterations. With the fine-tuned network of region proposals, non-maximum suppression (NMS) is adopted to eliminate highly overlapped bounding boxes with lower scores. After using non-maximum suppression (NMS), a total of 100 proposals are generated for the second stage detection part.
4.4 Experimental Results
This paper compares the effectiveness of the proposed approach to other deep CNN-based approaches, including HOG+LDA+SVM [31],
HOG+SVM [32], ROI+HOG+SVM [33],
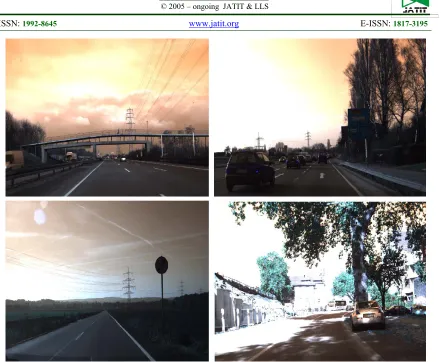
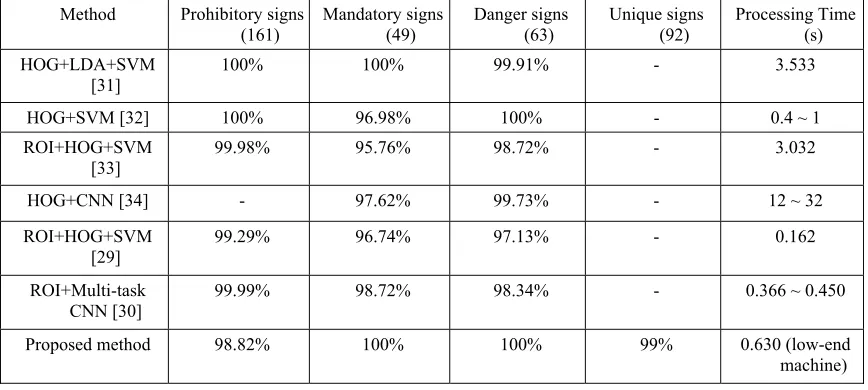
5016 well. Figure 6 shows some examples of detection results on the GTSDB dataset. As shown in this figure, the proposed approach can locate exactly traffic signs in the wild, especially with small traffic sign. Table 2 shows a comparison to other state-of-the-art methods. As shown in this table, the proposed approach outperforms others on the GTSDB database, considering generality, reliability and run time.
Table 2 also shows a comparison report between different traffic sign detection methods in terms of their computation efficiency. Because the proposed method is implemented on a low-end machine, processing time of different methods cannot compare directly. Thus, Table 2 shows processing time of different methods based on their hardware configuration. While other methods were implemented on high-end GPU, the proposed method meets the requirement of real-time processing on low-end GPU. This shows that the proposed method outperforms both in accuracy and in run time.
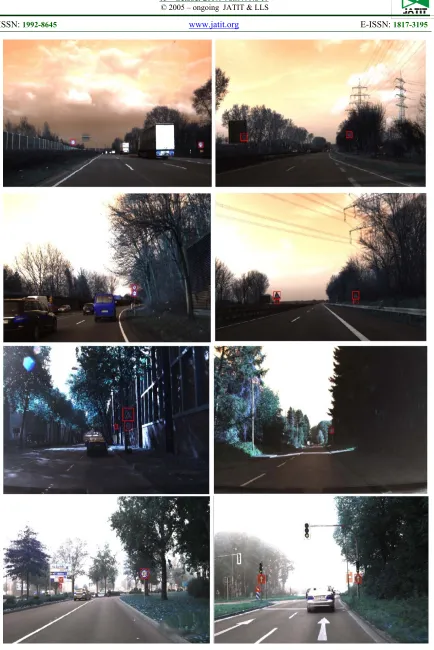
Figure 7 shows some unsuccessful detection results. As shown in this Figure, the proposed method cannot detect traffic sign that are blurred, tiny or backlit. The results could be improved by enlarging the amount of the training data and enriching the diversity of the samples (the GTSDB has only 600 training images). In the future, the proposed method will be extended to handle situations where the lighting is uneven, perspective irregular or the image is blurry.
5. CONCLUSIONS
In this paper, a new method is proposed for detecting small-sized traffic signs. The proposed approach is based on the Faster R-CNN framework with MobileNets architecture. Moreover, deconvolutional module and atrous convolution adopted to capture more context information. Experimental results show that the proposed method achieves better results than other state-of-the-art methods in terms of detection accuracy and run-time efficiency, especially for small-sized traffic signs on GTSDB dataset. For future works, this paper will improve the detection performance on traffic signs that are blurred, tiny or backlit by enlarging the amount of the training data.
REFRENCES:
[1] C. Bahlmann, Y. Zhu, V. Ramesh, M. Pellkofer, and T. Koehler, “A system for traffic sign detection, tracking, and
recognition using color, shape, and motion information”, Proc. IVS, 2005, pp. 255– 260.
[2] S. Salti, A. Petrelli, F. Tombari, N. Fioraio, and L. Di Stefano, “Traffic sign detection via interest region extraction”, Pattern
Recognit., vol. 48, no. 4, 2015, pp. 1039–
1049.
[3] M. A. Garcia-Garrido, M. A. Sotelo, and E. Martin-Gorostiza, “Fast traffic sign detection and recognition under changing lighting conditions”, Proc. ITSC, 2006, pp. 811–816.
[4] Y. LeCun, L. Bottou, Y. Bengio, and P. Haffner, “Gradient-based learning applied to document recognition”, Proc. IEEE, vol. 86, no. 11, 1998, pp. 2278–2324.
[5] Hanafi, Nanna Suryana, Abd Samad Bin Hasan Basarideep, "Learning for recommender system based on application domain classification perspective: a review", Journal of Theoretical and
Applied Information Technology, Vol. 96,
No. 14, 2018, pp. 4513-4529.
[6] B. Yang, J. Yan, Z. Lei, and S. Z. Li, “CRAFT objects from images”, Proc. CVPR, 2016, pp. 805–813.
[7] X. Chen and A. Gupta, “Spatial memory for context reasoning in object detection”,
Proc. ICCV, 2017, pp. 117–125.
[8] Fu C-Y, Liu W, Ranga A, Tyagi A, and Berg AC, “DSSD: deconvolutional single shot detector”, arXiv:1701.06659 [cs.CV]. http://arxiv.org/abs/1701.06659. Accessed Jan 2017.
[9] Cai Z, Fan Q, Feris RS, and Vasconcelos N, “A unified multi-scale deep convolutional neural network for fast object detection”,
Lecture Notes in Computer Science, vol
9908, 2016.
[10] S. Houben, J. Stallkamp, J. Salmen, M. Schlipsing, and C. Igel, “Detection of traffic signs in real-world images: The German traffic sign detection benchmark”,
Proc. IEEE Int. Joint Conf. Neural Netw.,
2013, pp. 1–8.
[11] Russakovsky O, Deng J, Su H, Krause J, Satheesh S, Ma S, Huang Z, Karpathy A, Khosla A, and Bernstein M, “Imagenet large scale visual recognition challenge”,
Int J Comput Vis, 2015, pp. 211–252.
5017
Pattern Analysis and Machine Intelligence,
2017, pp. 640-651.
[13] Hariharan B, Arbeláez P, Girshick R, and Malik J, “Hypercolumns for object segmentation and fine-grained localization”, IEEE Conference on Computer Vision and Pattern Recognition
(CVPR), 2015, pp. 447–456.
[14] Chen L-C, Papandreou G, Kokkinos I, Murphy K, and Yuille AL, “DeepLab: semantic image segmentation with deep convolutional nets, atrous convolution, and fully connected CRFs”, IEEE Trans
Pattern Anal Mach Intell, 2017, pp.
834-848.
[15] Ren S, He K, Girshick R, and Sun J, “Faster R-CNN: towards real-time object detection with region proposal networks”, IEEE Transactions on Pattern Analysis &
Machine Intelligence, 2015, pp.
1137-1149.
[16] A. de la Escalera, L. E. Moreno, M. A. Salichs, and J. M. Armingol, “Road traffic sign detection and classification”, IEEE
Trans. Ind. Electron., vol. 44, no. 6, 1997,
pp. 848–859.
[17] W. G. Shadeed, D. I. Abu-Al-Nadi, and M. J. Mismar, “Road traffic sign detection in color images”, Proc. ICECS, vol. 2, 2003, pp. 890–893.
[18] G. Rätsch, T. Onoda, and K. Müller, “Soft margins for AdaBoost”, Mach. Learn., vol. 42, no. 3, 2001, pp. 287–320.
[19] C. Cortes and V. Vapnik, “Support vector machine”, Mach. Learn., vol. 20, no. 3, 1995, pp. 273–297.
[20] S. K. Berkaya, H. Gunduz, O. Ozsen, C. Akinlar, and S. Gunal, “On circular traffic sign detection and recognition”, Expert
Syst. Appl., vol. 48, 2016, pp. 67–75.
[21] R. Timofte, K. Zimmermann, and L. Van Gool, “Multi-view traffic sign detection, recognition, and 3D localisation”, Mach.
Vis. Appl., vol. 25, no. 3, 2014, pp. 633–
647.
[22] A. Mogelmose, M. M. Trivedi, and T. B. Moeslund, “Vision-based traffic sign detection and analysis for intelligent driver assistance systems: Perspectives and survey”, IEEE Trans. Intell. Transp. Syst., vol. 13, no. 4, 2012, pp. 1484–1497. [23] V. John, K. Yoneda, B. Qi, Z. Liu, and S.
Mita, “Traffic light recognition in varying illumination using deep learning and
saliency map”, Proc. ICITS, 2014, pp. 2286–2291.
[24] J. Jin, K. Fu, and C. Zhang, “Traffic sign recognition with hinge loss trained convolutional neural networks”, IEEE
Trans. Intell. Transp. Syst., vol. 15, no. 5,
2014, pp. 1991–2000.
[25] Y. Zhu, C. Zhang, D. Zhou, X. Wang, X. Bai, and W. Liu, “Traffic sign detection and recognition using fully convolutional
network guided proposals”,
Neurocomputing, vol. 214, 2016, pp. 758–
766.
[26] S. Xie and Z. Tu, “Holistically-nested edge detection”, Proc. ICCV, 2015, pp. 1395– 1403.
[27] Howard, A.G., Zhu, M., Chen, B. et al., “MobileNets: Efficient Convolutional Neural Networks for Mobile Vision Applications”, CoRR, 2017.
[28] Pinheiro PO, Lin TY, Collobert R, and Dollár P, “Learning to refine object segments”, ECCV, 2016.
[29] Y. Yang, H. Luo, H. Xu, and F. Wu, “Towards real-time traffic sign detection and classification”, IEEE Trans. Intell.
Transp. Syst., vol. 17, no. 7, 2016, pp.
2022–2031.
[30] H. Luo, Y. Yang, B. Tong, F. Wu, and B. Fan, “Traffic sign recognition using a multi-task convolutional neural network”,
IEEE Trans. Intell. Transp. Syst., vol. 19,
no. 4, 2018, pp. 1100–1111.
[31] G. Wang, G. Ren, Z. Wu, Y. Zhao, and L. Jiang, “A robust, coarse to fine traffic sign detection method”, Proc. IEEE Int. Joint
Conf. Neural Netw., 2013, pp. 1–5.
[32] M. Liang, M. Yuan, X. Hu, J. Li, and H. Liu, “Traffic sign detection by roi extraction and histogram features-based recognition”, Proc. IEEE Int. Joint Conf.
Neural Netw., 2013, pp. 1–8.
[33] S. Salti, A. Petrelli, F. Tombari, N. Fioraio, and L. Di Stefano, “A traffic sign detection pipeline based on interest region extraction”, Proc. IEEE Int. Joint Conf.
Neural Netw., 2013, pp. 1–7.
5018
[image:7.612.136.482.280.442.2]Figure 1: The Overall Framework of The Proposed Method
[image:7.612.239.396.488.658.2]Figure 2: Deconvolutional Module
5019
Figure 4: Examples Traffic Sign Images in The GTSDB Dataset
5020
5021
Figure 7: Examples of Unsuccessful Detection
Table 1: The architecture of the base network
Type / Stride Filter Shape Input Size Conv / s2 3 × 3 × 3 × 32 224 × 224 × 3 Conv dw / s1 3 × 3 × 32 dw 112 × 112 × 32 Conv / s1 1 × 1 × 32 × 64 112 × 112 × 32 Conv dw / s2 3 × 3 × 64 dw 112 × 112 × 64 Conv / s1 1 × 1 × 64 × 128 56 × 56 × 64 Conv dw / s1 3 × 3 × 128 dw 56 × 56 × 128 Conv / s1 1 × 1 × 128 × 128 56 × 56 × 128 Conv dw / s2 3 × 3 × 128 dw 56 × 56 × 128 Conv / s1 1 × 1 × 128 × 256 28 × 28 × 128 Conv dw / s1 3 × 3 × 256 dw 28 × 28 × 256 Conv / s1 1 × 1 × 256 × 256 28 × 28 × 256 Conv dw / s2 3 × 3 × 256 dw 28 × 28 × 256 Conv / s1 1 × 1 × 256 × 512 14 × 14 × 256
Conv dw / s1
5× Conv / s1 3 × 3 × 512 dw 1 × 1 × 512 × 512
[image:10.612.90.340.477.698.2]5022
Table 2: Experimental Results on GTSDB Dataset
Method Prohibitory signs
(161) Mandatory signs (49) Danger signs (63) Unique signs (92) Processing Time (s) HOG+LDA+SVM
[31] 100% 100% 99.91% - 3.533
HOG+SVM [32] 100% 96.98% 100% - 0.4 ~ 1
ROI+HOG+SVM
[33] 99.98% 95.76% 98.72% - 3.032
HOG+CNN [34] - 97.62% 99.73% - 12 ~ 32
ROI+HOG+SVM
[29] 99.29% 96.74% 97.13% - 0.162
ROI+Multi-task CNN [30]
99.99% 98.72% 98.34% - 0.366 ~ 0.450
Proposed method 98.82% 100% 100% 99% 0.630 (low-end