5146
AN EVALUATION OF THE USAGE OF ASPECT
ORIENTATION AND THE GAP BETWEEN ACADEMIC
RESEARCH AND INDUSTRY NEEDS
1AWS A. MAGABLEH, 2ANAS M. R. ALSOBEH AND 3AHMAD F. KLAIB Faculty of Information Technology and Computer Science, Department of Information Systems
Yarmouk University, Irbid, Jordan
E-mail: 1[email protected], 2[email protected], 3[email protected]
ABSTRACT
In industrialized nations there is a very strong relationship between university research centers and industry players, which supports the exchange of knowledge and the development of new technologies, particularly in the software engineering domain. This paper analyzes the extent of cooperation between university and industry specifically in relation to research and utilization of aspect orientation (AO). It also assesses whether AO is still an area of interest for software engineering researchers and ICT industry professionals. The study achieves these aims by gathering and analyzing the opinions of 52 researchers and 66industry professionals by means of domain-specific questionnaire surveys. Out of an original sample size of 196, 118 participated in this study, representing a 60.2% response rate. The originality and value of this study lies in the fact that it is the first to examine AO from two different perspectives (research and industry).The findings reveal the level of correlation between the behaviors of researchers and industry professionals toward AO. The research outcomes indicate that while there is an acceptable level of cooperation and synchronization between research institutes and ICT firms, it is less than ideal. The results also show that there are significant differences between the respondents’ points of view by experience, gender and/or job role/research interest. In light of these findings, some suggestions are made to improve the synergy between research and industry. Generally, both parties need to have more trust in AO in order to employ it in all stages of the software development life cycle. Thus, more workshops, seminars and training sessions need to be conducted to increase awareness of the capabilities of AO to encourage is utilization in both research and industry.
Keywords: Aspect Orientation, AO, Software Engineering, ICT Industry, Empirical Study, University Research Center
1. INTRODUCTION
The demand for aspect orientation (AO) is increasing significantly particularly due to the rapid developments taking place in science and technology and the need to manufacture complex, sensitive equipment such as rockets spacecraft and satellites, which requires a very high level of security, reliability and funding [39] [40] [41]. Thus, aspect-oriented programming (AOP), which was first introduced in 1996 [19], has become a much-needed tool, not least because it enhances the object-oriented programming paradigm by separating the crosscutting concerns (the aspects) from the business logic structure [1]. In 2001, AOP was identified as one of the most significant technologies of the twentieth century for its potential capacity to facilitate the creation of
advanced technologies [20]. However, more than 15 years since its appearance, it is still not being used to its full potential.
5147 Currently, university researchers working in the AO field are investigating the use of AO in a range of applications and new technologies, such as the cloud, the internet of things and cell phone software and applications, to name but a few. However, industry professionals are not utilizing the results of such studies. This means that, on the one hand, research is being conducted in vain and, on the other, industry is not benefiting from groundbreaking research, and ultimately, the gap between research and industry is growing.
Therefore the objectives of this study are threefold: First, to assess the current state-of-the-art AO concepts in academia and industry; second, to identify the mechanisms that could be employed to bridge the gap between AO research and AO usage in industry; and third, to investigate the dimensions of applicability of AO concepts in research and industry and determine whether there are any differences between the two contexts. Thus this research revolves around two key questions: (1) How are researchers in the AO field currently approaching this topic? (2) Are ICT industry professionals deploying AO concepts and implementing them in real systems (thus making use of research output)? One of the overriding reasons for attempting to achieve these objectives is to find a way to predict the implied behaviors of researchers and ICT companies/industry professionals toward AO and thereby propose a number of ways in which to encourage the utilization of AO. To this end, we develop two questionnaire instruments to test a number of hypotheses specifically formulated to match the objectives of this study. We believe that this empirical study is the first to explore the co-relationships between what research is investigating and inventing and what industry is applying. As a corollary, this study also highlights the limitations of AOP in the IT sector. However, the importance of this study mainly lies in its identification of mechanisms by which to bridge the gap between academic research on AO and the real AO needs of industry.
The remainder of this paper is organized as follows: Section 2 presents the results of a literature review that was undertaken to underpin the rationale for this study. Section 3 explains the research design and methodology adopted for the study. Section 4 presents and discusses the results of the survey and hypotheses testing. Section 5 draws some conclusions and makes some recommendations based on the findings. Finally,
section 6 highlights the limitations of the study and potential areas of further research.
2. LITERATURE REVIEW
For years, software engineers have struggled to structure code in such a way so as to optimize the quality of software applications. In an attempt to address this problem, researchers have investigated the benefits of using AOP to improve a variety of quality attributes. Yet, from an software architecture point of view, many challenges need to be considered in managing and developing software systems using AOP instead of pure object-oriented programming (OOP). Several authors across a variety of research disciplines have highlighted the importance of AO and suggested AOP-based solutions.
Initially, in 1996, a group of researchers at the Xerox Palo Alto Research Center (PARC) introduced AOP as a potential extension of OOP [1]. The PARC also created AspectJ as an extension of Java OOP, which was being used in AOP for designing programs, for example, to improve monitoring performance [43]. The creators of AOP were of the opinion that AOP, when combined with AspectJ, would have the potential to become a very popular AOP tool in the academic world because it is easy to use and very powerful [1]. Importantly, it can cleanly separate, encapsulate and abstract crosscutting concerns from core code logic by horizontally integrating the core code with the logic of secondary requirements in a process termed “weaving” [44].
5148 improvements in the quality of the software development process.
Then, in 2005, [6] and [30] studied various contemporary non-AO approaches in order to design a comprehensive set of AO approaches. Many of these AO approaches were built on the strengths of the non-AO approaches, but the issue of modularizing crosscutting concerns was by and large neglected. These two works presented some initial ideas about the operations involved in AO requirements analysis, design and engineering that could serve as a basis for ensuring complementarily between AO software development for a variety of industrial projects. Some of the issues related to the integration of formal specification work (within the AOSD-Europe Formal Methods Lab) were also raised [6]. Subsequently, in 2006, research was undertaken to determine how best to manage the maintenance of AOP software systems and the results of this research showed that the average impact of changes in AOP software systems is less than that of the changes in OOP across systems [7].
A few years later, in 2010, the limitations of AO applications in respect of exception handling concerns were assessed [6] [7]. These works also provided some AOP-based tools, such as SAFE which is based on static analysis, to verify the reliability of the exception handling code in AspectJ-based applications. Since then, many other researchers have developed good models using AOP language to express a static and dynamic solution for modeling crosscutting concerns. In [8], a systematic review of 3307 papers identified 22 empirical studies that compared AOP with non-AOP approaches such as structured programming languages and, based on the data extracted from those papers, it was determined that quality attributes : performance, code size, modularity, and evolution related characteristics are important for AOP success [8]. Most of those 22 studies reported positive effect on those quality attributes.
Some of the big ICT industry giants such as Motorola, Siemens, HP and SAP have successfully implemented AOP projects: Motorola developed a weaver for communication needs, Siemens applied AOP-Java to obtain the best-possible architectural features, HP adopted AOP in C++ to develop VLSI CAD applications and SAP used ABAP to access AOP constructs. The key factors that promote the usage of AOP in industry have been identified in [9]. In our research paper, we used some of those factors to compare study and evaluate the current trends of using AOP
techniques in industrial application against OO techniques.
A good number of researchers have investigated the effectiveness of AOP language in providing dynamic solutions that improve the performance of AOP systems against traditional systems. An empirical, socio-technical study of Java and AspectJ showed that developers need to make changes to the core code several times [10]. The study [10] proved that while there are frequent changes in the crosscutting code, you do not change the core logic frequently. It also showed that the changes that need to be made to alter the logic of the concern result in a longer development time when using AOP [10].
The development of complex applications for high-performance embedded systems is usually prone to error and conflicting requirements. However, a programming technique called LARA has been proposed that is likely to enable developers to overcome the increasingly demanding challenges faced in building embedded systems [11]. LARA uses an AOP language, thus allowing for the specification of collection strategies to enable the efficient generation of core code for target architectures. LARA can handle a variety of join points, models, and features and can generate an intermediate representation [8].
Also, recently, AOP language has been used to solve many of the technical problems inherent in distributed systems [13] [14]. AspectJ has also been extended to cover some common crosscutting concerns in complex systems. For example, conversation-aware aspects have been developed to improve the reuse and maintenance of applications that require network communications, called CommJ, which is an extension of the AspectJ framework that allows developers to define point cuts in the natural language of inter-process communications, such as connect, send, receive, etc. [12]. Moreover, further extensions to AspectJ have been proposed that encapsulate the transaction-related crosscutting concerns in modular aspects, called transJ [13] [14]. Essentially, TransJ improves the reuse and performance of distributed applications requiring transactions [15].
5149 computing architecture at runtime [16]. The framework is implemented using AOP techniques to integrate cloud security solutions at the software-as-a-service layer and it does not need the source code of the cloud service in order to work. This means that it is easier to reuse security-related crosscutting concerns where needed. Nevertheless, generally speaking, AOP has not been applied as it was intended. Therefore, most of the works that have been published to date are not very practical in real-world terms, which create a clear gap between research and industry.
3. RESEARCH DESIGN AND
METHODOLOGY
3.1 Research Design
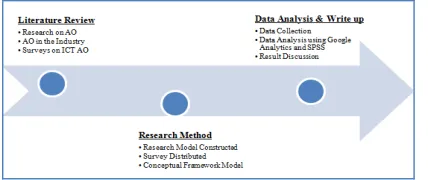
[image:4.612.306.528.243.730.2]A research design has been defined as “a blueprint for conducting a study with maximum control over factors that may interfere with the validity of the findings” [17]. It has also been described as “a plan that describes how, when and where data are to be collected and analyzed” [17]. Our research design is a mixed methods approach that combines qualitative and quantitative research techniques. The quantitative technique involves the use of questionnaire surveys and the qualitative technique involves a literature review. Figure 1 depicts our research design.
Fig. 1. Research design and flow
3.1.1 Conceptual framework
A conceptual framework was constructed to clarify the problem being addressed and how to approach a solution. The aim of developing such a framework is to find a way to overcome the problems described in the problem statement [21]. In order to construct the conceptual framework for this research, we conducted a literature review to assess all the existing approaches and their applicability to our study objectives.
[image:4.612.89.303.484.574.2]The developed conceptual framework consists of four phases: (1) a theoretical study, (2) the development of principles and framework, (3) the implementation of the framework and (4) an analysis of the resultant data. Each phase of the framework is explained in Table 1, which shows how we aimed to study the effect of AO research activities and industry practices on the attitudes of those working in the two domains (research and industry) toward developing AOP and the perceived current and future intentions to use it.
Table 1. Conceptual Framework Phase Activity
Phase 1 Theoretical
Study
Activity to Deliver
Review of the literature Key Inputs
Books
Journals
Proceedings
Publishing
Online content
White papers Key Activities and Tools
Study all existing AO approaches and tools
Review AOP issues in industry
Review issues in existing OO tools and approaches in modeling aspects Deliverables
Literature summary
Problem statement and issues
Phase 2 Principles and
Framework Suggestion
Activity to Deliver
Development of a research design and model
Development of a research methodology
Design the questionnaire for researchers and ICT industry
Design hypotheses
Key Inputs
Literature summary, documentation, issues identified and problem statement from Phase 1
Key Activities and Tools
Study how to design the research
5150
Study how to design a survey and questionnaire
Discuss how a new model can be proposed
Deliverables
Research design and model
Final hypotheses
Methodology
Questionnaire
Initial idea on new model for AO use in the industry
Phase 3 Conceptual Framework Implementation
Activity to Deliver
Implement the
questionnaire for AO and SE researchers
Implement the
questionnaire for AO and SE ICT professionals
Key Inputs
Existing studies on AOM, AOD, and AOA
Existing studies on AODA to support AspectJ
Existing AO design and modeling tools that support AO.
Key Activities and Tools
Distribute the
questionnaire that is related to researchers and industries to collect responses.
Determine the sample size.
Use different ways to disseminate the questionnaires on social media LinkedIn AO groups.
Deliverables
Questionnaire response
Initial figures and diagrams.
Test the hypothesis Phase 4
Analysis
Activity to Deliver
Collect data
Analyze data using SPSS
Generate results Key Inputs
Questionnaire response
SSPS knowledge
Analysis skills Key Activities and Tools
Export data
Classify data
Analyze data and discuss outcomes
Deliverables
Final outcomes and results
Judge the hypotheses
State limitations and shortages in AO research and industry
Identify the gap between research and industry
Propose an AO model to fill in the gap
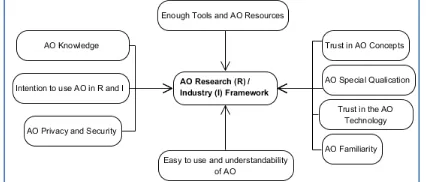
[image:5.612.315.528.404.495.2]The assumptions about the relationships between the variables and the conceptual framework are shown in Figure 2. These expected associations informed the formulation of the research questions and hypotheses as well as methods to be employed in the data collection and analysis process.
Fig. 2. Directive Dimensions Between The Conceptual Model And Variables
3.1.2 The research questions and hypotheses To realize the goals of this research, this study attempted to answer three questions, formulating seven main hypotheses to do so. These hypotheses were dealt with by different parts of the questionnaire. Table 2 maps the research questions to the hypotheses and relevant parts of the questionnaire.
Table 2. Mapping For Rqs, Hypotheses And Questionnaire Part
Questionnaire Part Research
Hypothesis Research
Questions
Part 2: Software H1:
5151 Development Lifecycle (SDLC) and ICT industry professionals are not utilizing AO in the SDLC stages RQ1: To what
extent is the concept of AO and its components used in the research and ICT Industry Software Development Lifecycle (SDLC) (which includes the analysis, design, implementatio n, and testing stages)? Part 2.1: Analysis and Design H2: Researchers and ICT industry professionals are not using AO in the analysis and design stages Part 2.2: Implementatio n and Development H3: Researchers and ICT industry professionals are not using AO in the implementatio n and development stages Part 2.3: Software Testing and Maintenance H4: Researchers and ICT industry professionals are not using O in the software testing and maintenance stages Part 3: Challenges and Opportunities H5: AO does
not have a good future in industry and the research field considering the challenges and opportunities. RQ2: What is
the future of AO researchers and the ICT industry, considering the challenges, opportunities and supporting resources? Part 4: Supporting References H6: The researchers and ICT industry professionals cannot find resources for learning AO Part 1: Demographic Information + Other Overlapped H7: There are
not any significant differences between the RQ3: What are the significant differences between the Parts respondents’ answers' means at the level of (a ≤ 0.05) related to the dependent variables of gender, work experiences, their role in software development and the nature of their research respondents’
answers' means at the level of (a ≤ 0.05) related to the dependent variables of gender, work experiences, their role in software development and the nature of their research?
3.2 Research Methodology
This study utilized two questionnaires, and each questionnaire consisted of four parts. The first dimension introduced the research area and the objectives of the research. This introduction was important because the respondents were randomly selected from among ICT businesses and university researchers in many countries. The second dimension included simple demographic questions to gather data on the age, gender, and total years of working in the field of ICT of the respondents. The third dimension contained 27 items (for the ICT professionals’ questionnaire) and 28 items (for the researchers’ questionnaire) to measure the seven hypotheses (refer to Table 4). Some items/questions were adopted from previous questionnaires [23] [25], which were helpful despite the fact they were not developed for the AO context. These questions were therefore adapted accordingly. The fourth dimension was phrased so as to obtain data regarding the respondents’ points of view on AO software applications in the SDLC. This dimension of the questionnaire also included an open-ended question to invite suggestions from the respondents about the usage of AO in SDLC.
5152 where necessary. Then, to verify the credibility and reliability of this study, four referees (two computer science professors, one software engineering professor and one educational technology professor) reviewed the modified questionnaires and provided their opinions on the clarity and the extent to which the study was likely to meet the intended objectives. Cronbach’s alpha was used to measure reliability of the final version of the questionnaires in line with previous work [27] [28] [29]. The stability coefficient was 0.869 for the researchers’ questionnaire and 0.707 for the industry professionals’ questionnaire, which was deemed acceptable for the purposes of this study (see Tables 3 and 4, respectively).
Table 3. Reliability Statistics For Researcher Cronbach's
Alpha Cronbach's Alpha Based on Standardized Items N of Items
.869 .788 26
Table 4. Reliability Statistics For Industry Cronbach's
Alpha Cronbach's Alpha Based on Standardized Items N of Items
.707 .781 25
3.2.2 Distribution of the Questionnaires This research aimed to have global coverage and thus did not focus on any one region or country or on particular universities or businesses. It considered respondents from all over the world as long as they had an understanding of software engineering and/or AO. The sampling of such a population cannot be fully randomized because the ordinary ICT professional and researcher might not be using AO or even be aware of it. Hence, the AO questionnaire was accredited by a set of AO professionals and researchers. The questionnaire was made available online via a website and was also distributed via e-mail from September 2017 to January 2018. The target respondents for the researchers’ questionnaire included lecturers and researchers in universities and research centers, while the target respondents for the industry professionals’ questionnaire included ICT professionals in the fields of software analysis, design and development. A total of 400 questionnaires was distributed out of which 190 were returned. Out of those, 72 questionnaires with large missing values were removed, thus 118 questionnaires were used in the preliminary analysis.
3.2.3 Study Sample
[image:7.612.88.531.282.402.2]The study has been distributed to 196 researchers, system analysts, system architects, system engineers, system designers, system developers and consultants. A total of 118 researchers (60.2%) responded. Fifty-two (44.1%) were researchers and 66 (55.9%) were industry professionals. Tables 5 and 6 provide details of the demographic distribution of the respondents by gender and years of experience, respectively. Figure 3 illustrates the distribution of the industry respondents by job role, while Figure 4 illustrates the distribution of the research respondents by research interest.
Table 5. Distribution Of Respondents N (Researchers And Industry) And Gender
Title Respond ents (n)
% Male (n)
% Femal e (n )
%
Industr y
66 55.9 54 81.8 12 18.2
Resear ch er
52 44.1 35 67.3 17 32.7
[image:7.612.318.526.432.712.2]Total 118 100 89 75 29 25
Table 6. Distribution Of Respondents N (Researchers And Industry) And Experience
Year s of Expe rienc e
0-5 6-10 11-20 >20
To tal
N % N % N % N %
Indus try
2 7
40.9 2 2
33.3 1 4
21.2 3 4.5 6 6 Rese
arche r
2 5
48.1 2 1
40.4 6 11.5 0 0 5 2
5153 respect to roles
Fig. 4. Distribution Of Respondents (Research) With Respect To Roles
4. RESULTS AND DISCUSSION
The Statistical Package for the Social Sciences (SPSS), version 25, was used to tabulate and process the data collected from the questionnaires. The following statistical methods were used:
Descriptive statistics for the respondents’ main characteristics (means, frequencies, percentages and standard deviations)
Means and standard deviations of the application modules.
Tests to determine whether statistically significant differences between trends among researchers and industry professionals could be attributed to the dependent variables.
[image:8.612.300.532.141.403.2]The discussion of the results is guided by the three research questions and their respective hypotheses. That discussion will allow us to draw some conclusions regarding the status and usage of AO in research and industry. In addition, it will also assist us in determining whether AO is evolving in both domains or not. Based on this discussion, it should be possible to predict the future of AO in both domains and the associated opportunities and challenges. However, first, an overview of the mean scores of the responses to both questionnaires is provided in Table 7.
Table 7. Respondents' Mean Scores For The All Parts In
Research And Industry
AO Parts Mean Scores
Research Industry
So
ftware Dev
elo
pment
Lif
e
cycl
e
(SDLC)
Part 2: SDLC 2.90 2.33 Part 2.1:
Analysis and Design
1.62 2.06
Part 2: Implementatio n and Development
3.05 3.76
Part 2.3: Software Testing and Maintenance
1.88 2.6
Challenges Part 3: Challenges and Opportunities
2.95 3.46
Supporting Reference s
Part 4: Supporting References
4.5 4.5
As can be seen in Table 7, the highest mean score was for the supporting references part (4.5 for research and 4.5 for industry). This indicates that reference materials on AO usage are available to both domains. The lowest mean score was for analysis and design part (1.62 for research and 2.06 for industry). This indicates that despite the fact that there are good supporting reference materials, AO is not being widely used in either domain. These general findings are assessed in more detail below.
RQ1: To what extent is the concept of AO and its components used in the research and ICT industry software development life cycle (SDLC), including the analysis, design, implementation, and testing stages?
Four hypotheses (H1, H2, H3, and H4) address RQ1.
5154 For a more precise measurement and investigation, the hypothesis was further divided into two sub-hypotheses:
H1.1: ICT industry professionals are not utilizing AO in the SDLC stages.
H1.2: Researchers are not utilizing AO in the SDLC stages.
[image:9.612.98.290.298.432.2]For the purposes of testing H1.1 and H1.2, the industry and research respondents’ answers regarding their use of AO in the SDLC were calculated in the form of means and standard deviations. The results are presented in Tables 8 and 9, respectively.
Table 8. Industry respondents' mean scores for part 2: use in SDLC
Part: Use in SDLC Mean Dev. Std. Do you think it is
interesting to learn and use AO?
3.94 2.417
Do you use AOP in the system development life cycle?
1.65 0.668
Do you use AO in CASE
tools? 1.42 0.498
Weighted average 2.33
From Table 8, the mean score for interest in learning and using AO in the SDLC is relatively high at 3.94, whereas for the use of AO and in CASE tools the mean scores are relatively low at 1.65 and 1.42, respectively. A possible explanation for this result is that while there is an interest in using AO, there are not many tools available that support AO so it is not widely used. The data in Table 8, including the weighted average mean score of 2.33, confirm H1.1.
Table 9. Researcher respondents' means scores for part 2: use in SDLC
Part 1: Use in SDLC Mean Dev. Std. How many research
publications have you done with object orientation?
1.75 0.796
How many AO-related research publications have you done?
1.42 0.499
How many AO-related publications have you done within the last 5 years?
1.38 0.491
When did you start using AO 1.60 0.721
in your research?
How do you use CASE aided tools in your research?
4.21 1.819
Main software engineering
principles are handled in AO 4.08 4.033 Weighted average 2.90
Table 9 shows that the mean score for using AO in software engineering principles research is very high at 4.08, while the use of AO in CASE-aided research tools is also high at 4.21. These high values might be because AO concepts and principles are popular among researchers. However, the mean scores for the items that focus on AO and OO research publications are low, which indicates that researchers have not been focusing as much on AO and OO research in recent years. This might be because the OO research field has become saturated, and there is not a lot of movement occurring in that space. So, considering the data in Table 9 and the weighted average of 2.90, H1.2 is confirmed.
The weighted averages for the use of AO in the SDLC by industry and research are relatively close (2.33 (low) and 2.9 (medium), respectively), which implies that AO is still of interest to both researchers and industry professionals, but the research respondents show a little bit more interest. These low mean values might have occurred because part 2 contained generic questions about the respondents’ overall point of view regarding the use of AO in all the SDLC stages. The subsequent parts of the questionnaire provide more clarity on the preferences among the respondents with regard to their usage of AO in specific stages of the SDLC.
H2: Researchers and ICT industry professionals are not using AO in the analysis and design stages.
This hypothesis was also divided into two sub-hypotheses to achieve greater precision:
H2.1: ICT industry professionals are not using AO in the analysis and design stages.
H2.2: Researchers are not using AO in the analysis and design stages.
5155 analysis and design stages of the SDLC were calculated as means and standard deviations. The results are given in Tables 10 and 11, respectively.
Table 10. Industry respondents' means scores for part 2.1: using AO in the analysis and design
stages Using AO at
analysis and design stages
Mean Std. Dev.
Tools used in AO analysis and design
1.98 .868
Used AO in
analysis 2.23 .873
Mainly used
AO 1.97 .911
Weighted average
2.06
[image:10.612.91.300.517.614.2]It is obvious from Table 10 that the mean scores for all the elements of this part of the industry questionnaire are low. This implies that ICT industry professionals are rarely using AO during the analysis and design stages of real projects, which is probably because a standardized AO approach is lacking. The weighted average of 2.06 and the other data in Table 10thus confirm H2.1.
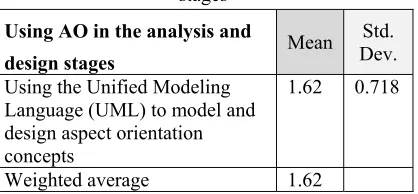
Table. 11 Research respondents' means scores for part 2.1: using AO in the analysis and design
stages Using AO in the analysis and
design stages Mean
Std. Dev. Using the Unified Modeling
Language (UML) to model and design aspect orientation concepts
1.62 0.718
Weighted average 1.62
Only one item (on the use of UML to model AO concepts) was included in the researchers’ questionnaire to assess this type of AO usage. As indicated, the mean value is 1.6, which is low and thus suggests that researchers are not interested in adapting and using AO UML to model systems. This result confirms H2.2.
From the weighted averages in Tables 10 and 11, it is clear that the use of AO in the analysis and design stages of the SDLC is not at an acceptable level in either industry (1.62) or research (2.06). One possible reason is that AO analysis and design approaches are still immature and not standardized across all software markets. This provides room for enhancing AO analysis and design modeling approaches that can on the one hand inspire further research and on the other increase AO adoption in industry.
H3: Researchers and ICT industry professionals are not using AO in the implementation and development stages
This hypothesis was divided into the following two sub-hypotheses:
H3.1: ICT industry professionals are not using AO in the implementation and development stages
H3.2: Researchers are not using AO in the implementation and development stages.
To test H3.1 and H3.2, the means and standard deviations of the industry and research respondents’ answers regarding their utilization of AO in the implementation and development stages were calculated. The results are provided in Tables 12 and 13, respectively.
.
Table 12. Industry respondents' means scores for part 2.2: using AO in the implementation and
development stage Using AO in the
implementation and development stages
Mean Dev. Std.
Projects in which you have
deployed AO concepts 4.53 .561 Software/systems that you
participated in using AO 2.55 .748 Used AO in implementation 2.52 .789 Used object-oriented
programming language
4.79 1.723
Used aspect-oriented
programming language 4.45 1.824 Weighted average 3.76
5156 of 4.53). Aspect orientation has mainly been used for programming (mean of 4.79) followed by object-oriented programming (mean of 4.45). The mean values for the other elements are lower at 2.55 and 2.52. All these values are acceptable, indicating that the majority of ICT industry professionals use AO in the implementation and development stages. The high mean value of 4.79 for using OO programming (which is the most well-reputed and adopted technology for this task), indicates that the reality is that many systems are being developed using OO. To mirror that, the mean value of AO is 4.45, which indicates a good use of AO in the real systems. The researchers concluded that there is an acceptable rate of usage for AO among industry professionals, probably because of the extension nature of AO to OO. The widespread usage of OO bodes well for the increased usage of its extension (AO). Overall, considering the data in Table 12, as well as the weighted average of 3.76, H3.1 is not confirmed.
Table 13. Research Respondents' Means Scores For Part 2.2: Using AO In The Implementation And
Development Stages
Using AO in the implementation and development stages
Mean Dev. Std.
Using AO in implementation 1.63 0.687 Employing AO in organizations 3.23 3.934 How do you stay updated with
the development of AO in industry?
3.71 4.421
In what kind of application
development do you use AO? 4.17 3.914 Which object-oriented
programming language do you use?
2.90 2.329
Which aspect-oriented programming language do you use?
2.69 2.609
Weighted average 3.05
In Table 13 most of the mean values are high (4.17, 3.23, 3.71, and 2.9). This indicates that there is a high level of interest among researchers in continuing to conduct research on the potential of AO programming languages in the implementation stage of the SDLC. However, the actual usage of AO to implement systems has a low mean value (1.63). Nevertheless, the high weighted average (3.05) suggests that there is still enough interest among researchers in enhancing AO programming
languages, possibly because researchers are aware of the present interest of ICT industry professionals in AO programming, as indicated in Table 12. Thus the data in Table 13, including the weighted average of 3.05, do not confirm H3.2.
In sum, the weighted averages in Tables 12 and 13 reveal that the use of AO in the implementation and development stages of the SDLC is still of interest to both researchers and ICT industry professionals.
H4: Researchers and ICT industry professionals are not using AO in the software testing and maintenance stages
This hypothesis was divided into:
H4.1: ICT industry professionals are not using AO in the software testing and maintenance stages
H4.2: Researchers are not using AO in the software testing and maintenance stages.
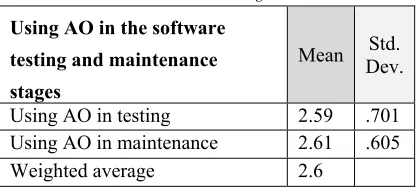
[image:11.612.87.298.384.619.2]The means and standard deviations of the industry and research respondents’ answers regarding their utilization of AO in the software testing and maintenance stages were calculated in order to test H4.1 and H4.2. The results are shown in Tables 14 and 15, respectively.
Table 14. Industry Respondents' Means Scores For Part 2.3: Using AO In The Software Testing And
Maintenance Stages
Using AO in the software testing and maintenance stages
Mean Dev. Std.
Using AO in testing 2.59 .701 Using AO in maintenance 2.61 .605 Weighted average 2.6
[image:11.612.316.525.509.605.2]5157 Table 15. Research Respondents' Means Scores For
Part 2.3: Using AO In The Software Testing And Maintenance Stages
Using AO in the software testing and maintenance stages
Mean Dev. Std.
Do you use or ever have used aspect-oriented programming (AOP)
1.88 1.865
Weighted average 1.88
Table 15 shows that the mean value for researchers using AO in testing and maintenance is 1.88, which is considered low. This result may be because not many studies are being conducted around the use of AO in the testing stage of the SDLC. This means that there is still room for researchers to study this usage of AO. Thus the data in Table 15 and the weighted average of 1.88 confirm H4.2.
The weighted averages in Tables 14 and 15 imply that the use of AO in the testing and maintenance stages of the SDLC is not of interest to researchers or to ICT industry professionals. These low values are due to the fact AO is not being used and applied in the testing stage.
In light of the above results on the current state of play in research and industry, the following question arises:
RQ2: What does the future for AO researchers and the ICT industry look like with respect to AO, taking the challenges, opportunities and supporting references into consideration?
Two hypotheses (H5 and H6) were formulated to attempt to find an answer to RQ2.
H5: AO does not have a good future in the ICT industry and the research field in light of the present challenges and opportunities.
This hypothesis was divided into two sub-hypotheses as follows:
H5.1: AO does not have a good future in the ICT industry in light of the present challenges and opportunities.
H5.2: AO does not have a good future in the research field in light of the present challenges and opportunities.
[image:12.612.88.300.125.228.2]Table 16 presents the ICT industry respondents’ answers regarding their views on AO challenges and opportunities in the form of means and standard deviations, while Table 17 does so for the researcher respondents.
Table 16. Industry respondents' means scores for part 3: challenges and opportunities. Challenges and
opportunities Mean
Std. Dev. Would you consider using AO? 3.18 1.264 From your experience, is it
possible to apply AO?
2.80 2.002
Regardless of what SDLC you were using, what AO
limitations did you experience?
4.45 5.269
The future of AO in project
development 2.94 0.579
The challenges you faced while using AO in real projects' stages
2.61 1.175
What are the main barriers of
not using AO in projects? 4.82 0.975 Do you think that AO concepts
and its application in real projects are required to have special developing
qualifications?
3.00 1.831
Weighted average 3.46
While most ICT industry professionals would consider using AO, the mean score of 4.45 in Table 16 indicates that they have encountered some limitations in trying to do so. Also, the mean value for the barriers to using AO is high at 4.82. Indeed, most of the mean scores for this part are high. Most of the respondents also indicated that a special qualification is required to utilize AO in real projects (mean of 3.0). This element may have a high value because AO has a position in the future of industries, which is because AO has promising principles that can help developers to produce better systems. Based on the data in Table 16 including the weighted average of 3.46, H5.1 is not confirmed.
Table 17. Researcher Respondents' Means Scores For Part 3: Challenges And Opportunities
[image:12.612.316.524.235.496.2]5158 Dev. Obstacles that have been
encountered while using AO
3.04 2.574
Do you see that a number of researchers are working on AO?
1.06 0.308
Recommending AO as a research concepts for students (under/post graduate)
4.71 2.117
The number of AO real life
projects are: * 1.10 0.298 If AO as a field of research is
not evolving, what could be the reason/s?
4.63 2.863
What is your point of view about the future of AO?
3.13 .715
Barriers to using AO in
projects? 3.88 1.308
Weighted average 2.95
Table 17 shows that the number of AO researchers is not increasing (mean of 1.06). Also, existing researchers are facing some challenges in relation to AO, as indicated by the mean score of 3.04. Moreover, the researchers’ opinion about the future of AO has a mean value of 3.13, which indicates that they are optimistic about the future of AO. It is likely that this item has an acceptable value because researchers feel that AO has promising research principles that will help in supporting and progressing their research activities. According to the data in Table 17, which includes the weighted average of 2.95, H5.2 is also not confirmed.
The weighted averages in Tables 16 and 17 indicate that both researchers and ICT industry professionals are interested in AO despite the present challenges they are encountering, which is promising for the future of AO.
H6: The researchers and ICT industry professionals do not find resources for learning AO.
This hypothesis was divided into:
H6.1: ICT industry professionals cannot find resources for learning AO.
H6.2: The researchers cannot find resources for learning AO.
[image:13.612.89.304.71.322.2]Tables 18 and 19 present the results for the ICT industry and researcher respondents, respectively, with regards to their views on AO learning resources. Here too the data are provided in the form of means and standard deviations.
Table 18. Industry Respondents' Means Scores For Part 3: Finding Resources For Learning AO
Find resources for learning
AO Mean
Std. Dev. What do you consider useful and
applicable resources on AO for your current and upcoming projects?
4.94 3.272
Does your company/ institute support AO references and training?
4.06 5.443
Weighted average 4.5
[image:13.612.317.525.179.310.2]Table 18 shows that most of the ICT industry professionals do not have issues in finding useful and applicable learning resources for AO (mean of 4.94). The mean score of 4.06 also suggests that most companies provide basic workshops and training on AO. Thus the data in Table 18, including the weighted average of 4.5, indicate that H6.1 is not confirmed.
Table 19. Researcher Respondents' Means Scores For Part 3: Resources For Learning AO
Find resources for learning
AO Mean
Std. Dev. Are you promoting the
increased awareness of using AO benefits?
4.83 2.238
Type of conferences that are still conducted around AO
4.17 4.008
Weighted average 4.5
Table 19 shows that researchers promote the awareness of the benefits of AO as a supporting reference (mean of 4.83). Also, the mean score of 4.17 reveals that there are conferences and journals that focus on AO and thus provide reference materials. Hence the data in Table 19 as well as the weighted average of 4.5 indicate that H6.2 is not confirmed.
The last question posed in this study sought to determine whether the responses of both groups were affected by demographic variables.
[image:13.612.319.521.447.554.2]5159
by gender, work experience, or by role in software development or research focus?
One hypothesis was formulated to address this question:
H7 The demographic variables have a significant differences between the respondent’s answers' means at the level of (a ≤ 05) related to the dependent variables of gender, work experiences and their role in software development and the research interest.
Tables 20 and 21 provide the results of an ANOVA of the data on this issue for the research and industry domains, respectively.
Table 20 shows that there are some significant differences among researcher respondents’ that are caused by their demographic characteristics, which reached levels lower than the required significance level (a ≤ 0.05).
In relation to the effect of gender, the use of AO in SDLC research (part 2) has a significance level 0.034 for males with a mean score of 18.54, while the use of AO in analysis and design (part 2.1) has a significance level of 0.021 for females with a mean score of 12.94. Finally, the use of AO in implementation and development (part 2.2) has a significance level of 0.043 for males with a mean score of 26.88. However, there are no significant differences by gender in relation to software testing and maintenance (part 2.3), challenges and opportunities (part 3) and supporting references (part 4).
As for the influence of years of experience, for respondents that have 11–20 years’ experience the use of AO in SDLC research (part 2) has a significance level of 0.038 with a mean score of 22.16 and the use of AO in software testing and maintenance (part 2.3) has a significance level of 0.002 with a mean score of 4.33. However, there are no significant differences by years of experience for analysis and design (part 2.1), implementation and development (part 2.2), challenges and opportunities (part 3) and supporting references (part 4).
As regards the impact of research interest, all the parts of the questionnaire have a significance level of 0.000. With regards to the use of AO in SDLC research (part 2), analysis and design (part 2.1),
implementation and development (part 2.2), and challenges and opportunities (part 3) the respondents who have AO analysis, AO design, AO development, AO requirement, and AO testing roles have mean scores of 27.00, 33.00, 41.75, and 32.00, respectively. In addition, for software testing and maintenance (part 2.3) the respondents who have AO development, AO requirement, and AO testing roles have a mean score of 16.00. Finally, with respect to supporting references (part 4) the respondents who have AO development and AO testing roles have a mean score of 19.50.
Table 21 shows that there are some significant differences among the ICT industry respondents based on their demographic characteristics, the values of the demographic characteristics are lower than the required significance level (a ≤ 0.05).
As regards the effect of gender, supporting references (part 4) has a level of significance of 0.027 for females with a mean score of 21.33. However, there are no significant differences in respect to the other parts of the questionnaire. With respect to the impact of years of experience, for respondents that have more than 20 years’ experience the use of AO in SDLC research (part 2) has a significance level of 0.000 (less than 0.001) with a mean score of 9.67 and the use of AO in implementation and development (part 2.2) has a significance level of 0.010 with a mean score of 4.04. There are no significant differences by experience for analysis and design (part 2.1), software testing and maintenance (part 2.3), challenges and opportunities (part 3) and supporting references (part 4).
5160
5161
5162 Table 22 summarizes the results of hypothesis testing:
Table 22. Hypotheses Results Hypothesis Hypothesis Result H1 H1.1 Confirmed
H1.2 Confirmed H2 H2.1 Confirmed H2.2 Confirmed H3 H3.1 Not Confirmed
H3.2 Not Confirmed H4 H4.1 Confirmed
H4.2 Confirmed H5 H5.1 Not Confirmed
H5.2 Not Confirmed H6 H6.1 Not Confirmed H6.2 Not Confirmed H7 H7 Not Confirmed
5. CONCLUSIONS AND
RECOMMENDATIONS
This research investigated AO concepts and the applicability of AO at different levels of the SDLC in both the research and ICT industry setting. The results indicate that both domains applied the concepts of AO but there are differences in the application of AO at different levels of the SDLC. There are also some significant differences in perspectives of employing AO techniques in both research and industry. In the nutshell, AO is most commonly applied in the implementation stages of the SDLC. In light of this study’s findings, our recommendations are as follows:
Researchers and ICT industry professionals need to have a higher level of trust in AO so that they feel confident in employing the concept in all stages of the SDLC. More workshops, seminars and training sessions have to be conducted for both groups to increase their awareness of the potential to professionally utilize AO in their research and in their work.
Both groups should use AO in the analysis and design stages. Researchers have proposed many interesting AO approaches but these are not being put into practice in industry. The ICT industry has invented many CASE tools, but AO analysis and design research approaches are not incorporated into such
tools. In order for that to occur, better trust and synchronization has to occur. To bridge the gap, more conferences that researchers and software industry leaders can attend together must be organized.
Both groups need to learn from how AO has achieved a desirable level of acceptance at the implementation stage.
Both groups should explore the ability to extend and employ AO in the testing and maintenances stages.
While both groups seem to believe that AO has a future in SDLC.
Many references are available to support the learning of AO, but they need to be utilized to a greater extent by everyone, including undergraduate and postgraduate students, in order to bridge the gap between research and industry.
Awareness of AO should be increased among all SDLC stakeholders.
More collaboration between academic research and industry must occur. This can be done by researchers surveying the latest industry trends and needs, and then directing their research toward meeting them. Also, industry should provide more grants to research centers, and there should be exchanges between researchers with professionals so that they can gain experience of each other’s role and challenges. In addition, more technical conferences, talks, and regular meetings should take place between both groups at the local, regional and global level.
There needs to be better engagement between AO researchers worldwide and global AO forums.
There needs to be better engagement between ICT industry professionals worldwide and global AO forums.
6. LIMITATIONS AND FUTURE WORK
5163 of companies around the world. However, in the end, most of the respondents were from the Middle East and Africa. Therefore, it would be interesting for future research to gather respondents’ data from different areas and compare them.
The authors used many search tools to identify suitable respondents who were specialists in AOP. Nevertheless, this did lead to some misidentifications. In addition, some respondents considered the questions from different technological perspectives. For instance, some respondents completed their questionnaire by considering the questions in relation to a public software engineering system, while others did so by considering AOP as the technology under consideration.
Further research is needed to address the limitations of this research, which might improve our understanding of the topic and the accuracy of the results. Nevertheless, this study opens the door for more research into understanding the context in which AO is utilized and improving its usage by both research and industry in the future.
REFERENCES
[1] Kiczales, G., Lamping, J., Mendhekar, A., Maeda, C., Lopes, C., Loingtier, J. M., & Irwin, J. (1997). Aspect-oriented programming. ECOOP'97—Object-oriented programming, 220-242.
[2] Cristina Videira Lopes, Aspect Oriented Programming: An Historical Perspective - Institute of Software Research,University of California, Irvine, December 2002, 9-10 [3] Roger T. Alexander, James M. Bieman -
Challenges of Aspect Oriented Technology – Workshop on SoftwareQuality, Florida, 2002, 1-3
[4] Jianjun Zhao -Change Impact Analysis for Aspect Oriented Software Evolution – Department of ComputerScience and Technology, Fukuoka Institute of Technology – 2002, 3-5
[5] Lieberherr, K., & Lorenz, D. H. (2003). Coupling aspect-oriented and adaptive programming. Aspect-Oriented Software Development, 145-164.
[6] Chitchyan, R., Rashid, A., Sawyer, P., Garcia, A., Alarcon, M. P., Bakker, J., and Jackson, A. (2005). Survey of aspect-oriented analysis and design approaches.
[7] Kumar, A., Kumar, R., & Grover, P. S. (2007). An evaluation of maintainability of aspect-oriented systems: a practical
approach. International Journal of Computer Science and Security, 1(2), 1-9.
[8] Ali, M. S., Babar, M. A., Chen, L., & Stol, K. J. (2010). A systematic review of comparative evidence of aspect-oriented programming. Information and software Technology, 52(9), 871-887.
[9] Parashar, S. Limitations Of Aspect Oriented Programming In Industry. Medicine and Sciences (BEST: IJHAMS), ISSN 2348-0521, Vol. 2, Issue 10, Oct 2014, 43-50, [10] Endrikat, S., &Hanenberg, S. (2011, June). Is
aspect-oriented programming a rewarding investment into future code changes? A socio-technical study on development and maintenance time. In Program Comprehension (ICPC), 2011 IEEE 19th International Conference on (pp. 51-60). IEEE.
[11] Cardoso, J. M., Carvalho, T., Coutinho, J. G., Luk, W., Nobre, R., Diniz, P., &Petrov, Z. (2012, March). LARA: an aspect-oriented programming language for embedded systems. In Proceedings of the 11th annual international conference on Aspect-oriented Software Development (pp. 179-190). ACM. [12] Raza, A., & Clyde, S. (2014). Communication
Aspects with CommJ: Initial Experiment Show Promising Improvements in Reusability and Maintainability. ICSEA 2014.
[13] AlSobeh, A. M., & Clyde, S. W. (2016). Transaction-Aware Aspects with TransJ: An Initial Empirical Study to Demonstrate Improvement in Reusability. ICSEA 2016, 59.
[14] AlSobeh, A. M., & Clyde, S. W. (2016). TransJ: An Abstract Independent-Framework for Weaving Crosscutting Concern into Distributed Transactions. Journal of Computer Science & Technology, 7(004), 173-195.
[15] Alsobeh, A., & Clyde, S. (2015). Weaving Crosscutting Concerns into Distributed Transactions in Aspect.
[16] Alsobeh, A. M., Magableh, A. A. & AlSukhni, E. M. (2018). Runtime Reusable Weaving Model for Cloud Services Using Aspect-Oriented Programming: The Security-Related Aspect. International Journal of Web Services Research (IJWSR), 15(1), 71-88.
5164 [18] Parahoo K. Nursing research: principles,
process and issues. Basingstoke: Macmillan; 1997.
[19] Lopes, C. V. (2002). Aspect-Oriented Programming: An historical perspective. [20] Kiczales, G., Hilsdale, E., Hugunin, J.,
Kersten, M., Palm, J., & Griswold, W. G. (2001, June). An overview of AspectJ. In European Conference on Object-Oriented Programming (pp. 327-354). Springer,
Berlin, Heidelberg.
[21] Baldauf, M., Dustdar, S., & Rosenberg, F. (2007). A survey on context-aware
systems. International Journal of Ad Hoc
and Ubiquitous Computing, 2(4), 263-277.
[22] Sirbi, K., & Kulkarni, P. J. (2010). Impact of Aspect Oriented Programming on Software
Development Quality Metrics. Global
Journal of Computer Science and Technology.
[23] Mei, H., Cao, D. G., & Yang, F. Q. (2006). Development of software engineering: A
research perspective. Journal of Computer
Science and Technology, 21(5), 682-696.
[24] Xu, Dianxiang, Omar El Ariss, Weifeng Xu, and Linzhang Wang. "For Research Only." Postprint Version. Originally Published in: Journal of Computer Science and Technol ogy,
24(5): 949-961, Sept. 2009
[25] Bartsch, M., & Harrison, R. (2008). An exploratory study of the effect of
aspect-oriented programming on
maintainability. Software Quality
Journal, 16(1), 23-44.
[26] Ali, S., Yue, T., & Briand, L. C. (2014). Does aspect-oriented modeling help improve the readability of UML state machines? Software & Systems Modeling, 13(3), 1189-1221.
[27] Wentzel, K. R. (1998). Social relationships and motivation in middle school: The role of
parents, teachers, and peers. Journal of
educational psychology, 90(2), 202.
[28] Cronbach, L. J., & Shavelson, R. J. (2004). My current thoughts on coefficient alpha and
successor procedures. Educational and
psychological measurement, 64(3), 391-418.
[29] Sun, W., Chou, C. P., Stacy, A. W., Ma, H., Unger, J., & Gallaher, P. (2007). SAS and SPSS macros to calculate standardized Cronbach’s alpha using the upper bound of the phi coefficient for dichotomous items. Behavior research methods, 39(1),
71-81.
[30] Poelmans, J., Elzinga, P., Viaene, S., & Dedene, G. (2010, July). Formal concept analysis in knowledge discovery: a survey. In International Conference on Conceptual Structures(pp. 139-153). Springer, Berlin,
Heidelberg.
[31] Endrikat, S., & Hanenberg, S. (2011, June). Is aspect-oriented programming a rewarding investment into future code changes? A socio-technical study on development and
maintenance time. In Program
Comprehension (ICPC), 2011 IEEE 19th International Conference on (pp. 51-60).
IEEE.
[32] Arora, M. T. S., & Gupta, R. (2011). Object Oriented Mutation Applied in Java Application programming Interface and C++
Classes. International Journal of Advanced
Computer Research, 1(1).
[33] Tarta, A. M., & Moldovan, G. S. (2006, May). Automatic usability evaluation using
aop. In Automation, Quality and Testing,
Robotics, 2006 IEEE International Conference on(Vol. 2, pp. 84-89). IEEE.
[34] Ishak, N. (2018, February). The influences of attributes, skills and knowledge of managers on refurbishment project performance. In AIP Conference Proceedings (Vol. 1930,
No. 1, p. 020023). AIP Publishing.
[35] Jalali, A., Maggi, F. M., & Reijers, H. A.
(2017). A hybrid approach for
aspect-oriented business process
modeling. Journal of Software: Evolution
and Process.
[36] Gao, S., Tang, O., Wang, H., & Yin, P. (2018). Identifying competitors through comparative relation mining of online
reviews in the restaurant
industry. International Journal of Hospitality Management, 71, 19-32.
[37] Syriani, E., Luhunu, L., & Sahraoui, H. (2018). Systematic mapping study of
template-based code generation. Computer
Languages, Systems & Structures, 52, 43-62.
[38] Kumar, M. M., & Nandakumar, A. N. (2018). Exploring Multilateral Cloud Computing Security Architectural Design Debt in Terms of Technical Debt. In Smart Computing and Informatics (pp. 567-579). Springer,
Singapore.
[39] Shahmoradpour, A., & Afraz, S. (2018). A
NEW APPROACH IN
ASPECT-ORIENTED REQUIREMENT
5165 [40] Pawar, K., & Attar, V. (2016, December). A
survey on Data Analytic Platforms for Internet of Things. In Computing, Analytics and Security Trends (CAST), International Conference on (pp. 605-610). IEEE.
[41] Model, S. F. P. International Journal of Modern Education and Computer Science (IJMECS).
[42] Wieczorkowski, J., & Polak, P. (2014). Big data: Three-aspect approach. Online Journal of Applied Knowledge Management, 2(2),
182-196.
[43] Hannemann, J., & Kiczales, G. (2002, November). Design pattern implementation
in Java and AspectJ. In ACM Sigplan
Notices (Vol. 37, No. 11, pp. 161-173).
ACM.
[44] Kiselev, I. (2002). Aspect-oriented