Exploratory Data Model for Effective WLAN Anomaly
Detection based on Feature Construction and Reduction
Ajay M. Patel
Assistant Professor, Acharya Motibhai Patel Institute ofComputer Studies, Ganpat University,
Ganpat Vidyanagar-384012, India
A. R. Patel
Director,Department of Computer Application & Information
Technology, H. North Gujarat University,
Patan - 384265, India
Hiral R. Patel
Assistant Professor, Department of Computer Science,Ganpat University, Ganpat Vidyanagar-384012, India
ABSTARCT
The efficient and effective Anomaly detection system essentially requires identifying the behavior analysis for each activity. For this purpose unsupervised techniques are used but the accuracy and reliability of them results depend on the data set which have used for modeling. It is essential to identify important input features, missing values, redundancy, feature exploration etc… So for the data preprocessing different statistical analytical methods are used. In this paper, a statistical feature construction scheme is proposed based on Factor analysis. The proposed Feature construction model provides the way to remove redundancy, identify missing values and co-linearity between the initial data set. Experimental result shows the related good features are factorized using statistical measures. So it will improve the performance of the unsupervised algorithm results for the effective anomaly detection system.
General Terms
Dimension Reduction, Normality, Eigen Value, Linearity
Keywords
Anomaly Detection, Factor Analysis, Feature Construction, Intrusion, Linearity, Reduction
1.
INTRODUCTION
Current trends of growing rate of inter-connections among computer systems with reliable network communication are becoming a major challenge. Network-based systems have increasingly become targets for attackers, and many of these attacks have led to information and financial losses. So, now a day, Intrusion detection Systems (IDS) proposed to combat threats by accomplishing prevention based security measures. Intrusion means exploitation of the any system security policy and intrusion detection is a mechanism developed to detect exploitation of the security policy of the system. This is based on the assumption that intrusive activities are conspicuously different with normal activities of the system so they can easily detectable. Intrusion Detection is planned to accompaniment existing security measures by effectuating actions that bypass the system security policy monitoring and control.1 Generally Intrusion Detection Systems (IDS) are being designed to protect the availability, confidentiality, and integrity of critical networked information systems to achieve a high level of intrusion detection, the framework should be based on a feature
1
(Matrix Factorization Approach for Feature Deduction and Design of Intrusion Detection Systems)
space that provides a good characterization of anomalous activity. 2
The general classification of intrusion detection system is Misuse detection also known as signature-based approach and Anomaly detection also known as Profile-based approach. The signature-based approach detects the intrusions by searching network audit data for the matches of the signatures of known attacks. Profile-based approach detects intrusions by searching the network audit data for deviations from the established profiles of normal behaviors of users and systems. This paper focuses on anomaly detection. In anomaly detection techniques, usually a profile for normal behavior is initially established. The observed behavior of the subject is then compared with its normal profile, and an intrusion is signaled when the observed behavior of a subject deviates significantly from its normal profile. The primary advantage of anomaly-based detection is the ability to detect novel attacks for which signatures have not been defined. Profiles of normal behavior can be built with a variety of techniques including statistical methods and data mining algorithms or by some other methods. These algorithms require a set of purely normal data from which they train their model; if the training data contain traces of intrusions, the algorithm may not detect future instances of these attacks because it will presume that they are normal. In Most of circumstances normalized data can be extremely difficult or impossible to obtain. Intrusion detection system requires the efficient unsupervised algorithms for intrusion behavior analysis and for better efficiency of unsupervised algorithm normalized data required. 3
The main purpose of this paper is to identify important input features to build IDS that are computationally efficient and effective development of classification techniques for unsupervised anomaly detection. To identify important input features, a statistical feature construction scheme has developed in which factor analysis the most popular statistical technique used. Factor analysis is a statistical technique used to identify a relatively small number of factors that can represents relationships among sets of many interrelated variables. It reduces the attribute space from a larger number of variables to a
2
(Feature Construction Scheme for Efficient Intrusion Detection System, 2010)
3
smaller number of factors. Factor analysis generates a table in which the rows are the observed as raw indicator variables and the columns are factors that explain as much of the variance in these variables as possible. The cells in this table are factor loadings, and the meaning of the factors must be induced from observing which variables are most heavily loaded on certain factors. The factor loadings are the correlation among the variables and factors.
2.
FEATURE CONSTRUCTION
In any Knowledge discovery tasks, data preprocessing is required. Data preprocessing steps include the dataset creation, data cleaning, data integration, and feature construction to derive higher level features, feature selection and reduction to choose an optimal set of relevant features and data discretization. So feature construction and the reduction is the main part of data preprocessing. It aims to create a model with additional features with better discriminative ability and decrease the dimensionality of data set by discarding redundant or irrelevant features than the initial feature set. This optimization process known as feature selection used to ease the curse of dimensionality.
Factor analysis is a collection of methods used to examine how basic constructs manipulate the responses on several measured variables. Factor analysis is done by two types: exploratory and confirmatory. Exploratory factor analysis (EFA) attempts to discover the nature of the constructs influencing a set of responses. Confirmatory factor analysis (CFA) tests whether a specified set of constructs is influencing responses in a predicted way. Factor analysis is performed by examining the pattern of correlations (or co-variances) among the observed measures. Measures that are highly correlated (either positively or negatively) are likely influenced by the same factors, while those are relatively uncorrelated are likely influenced by different factors. 4
The primary objectives of the EFA are to determine the number of common factors influencing a set of measures and the strength of the relationship among each factor and each observed measure. Its common uses are as follow: 5
Identify the nature of the construct responses in a specific content area.
Determine what sets of attributes “hang together" in a log.
Demonstrate the dimensionality of a measurement scale. A researcher always wants to develop scales that respond to a single characteristic.
Determine what features are most important when classifying factors.
Generate “factor scores" representing values of the essential constructs for use in other analysis.
4
(Data Preprocessing for anomaly based network intrusion detection: A Review, 2011)
5 (DeCoster, August 1, 1998)
There are significant differences between the EFA and PCA: EFA and PCA will provide somewhat different results when applied to the same data. The purpose of PCA is to derive a relatively small number of features that can account for the variability found in a relatively large number of measures. This procedure, called data reduction, is typically performed when a researcher does not want to include all the original measures in analyses but still wants to work with the information that they contain. The first difference is that the direction of influence is reversed: EFA assumes that the measured responses are based on the underlying factors while in PCA the principal components are based on the measured responses. The second difference is that EFA assumes that the variance in the measured variables can be decomposed into that accounted for by common factors and that accounted for by unique factors. The principal components are defined simply as linear combinations of the measurements, and so will contain both common and unique variance. So you should use EFA when you are interested in making statements about the factors that are responsible for a set of observed responses, and you should use PCA when you are simply interested in performing data reduction.
A factor analysis is a data reduction technique to summarize several original variables into a smaller set of composite dimensions, or factors. It is an important step in scale development and also used to construct validity of scale factors. Then cluster analysis techniques can be applied effectively. The following shows the ability of factor analysis known as Factorability.
2.1
Sample Size
Factor analysis performs better with bigger samples. As a general rule, factor analysis requires a minimum of around 150 participants to get a reliable solution. If the correlations among attributes and the factor loadings are large (e.g., Correlations >. 5), sample size can be less and the opposite if the correlations are low. The more attributes per factor, the less participants required.
2.2
Normality
Significance tests used in factor analysis assume the variables are univariate, bivariate and multivariate normally distributed. Factor analytic solutions may also be improved when normality holds in the data. Normality is not a requirement in order to run a factor analysis. However, severe violations of normality, such as extreme skew, may make untransformed correlations a misleading representation of the association between two variables. In addition, there is a tendency for attributes with similar distributions to group together in factor analysis independently.
Linearity: Factor analysis is based on analysis of correlations and covariances. Correlations and covariances measure the linear relationship between variables. Linear relationships are usually the main form of relationships for the kinds of purposes that factor analysis is typically applied. If the relationships among variables are non-linear, factor analysis probably is not an appropriate method.
regarding the use of polychoric correlations in the context of ordinal variables. 6
3.
ANOMALY DETECTION
In Intrusion detection feature construction is used to classify network traffic as normal or anomalous. Anomaly detection assumes that an intrusion will always reflect some variation from normal patterns of activities. Anomaly detection can be divided into two types as static and dynamic anomaly detection. A static anomaly detector only concern with software of the system. It never checks the hardware and assumes that the portion of the system being monitored that does not change. The static portion of a system is the code for the system and the constant portion of data upon which the correct functioning of the system depends. Dynamic anomaly detection typically operates on audit records or on monitored networked traffic data. Audit records of operating systems do not record all events; they only record events of interest.
Conventional anomaly detection used to learn the model of normal behavior which requires cleaned training data. So the downside of these systems is that the process of data cleaning is a tedious process. So to overcome this problem with anomaly detection researcher has applied the feature construction before the unsupervised learning. [1]
Recent trends in IDS emphasize building a model in which all features are provided. Although some data features may be redundant or contribute little to the detection process, the amount of audit data that an IDS needs to examine is very large even for a small network. Extraneous features and complex relationships that exist between the features can make it harder to detect suspicious behavior patterns and can increase the computation time. Therefore, the IDS must reduce the amount of data to be processed for computationally efficient and effective detection through feature construction. Feature construction can also improve classification by searching for the subset of features that best classifies the training data. Reducing the data space and then classifying intrusions based on the reduced feature space is vital to real-time intrusion detection.
4.
MODEL CONSTRUCTION
EXPERIMENTS USING FACTOR
ANALYSIS
Factor analysis mainly performed to identify essential attributes or factors that enlighten the correlations among a set of initial features. Factor analysis is one of the data reduction statistical methods which discover a number of factors that enlighten the variance experiential in a large number of variables. It also used to generate hypothesis concern with fundamental causally related mechanisms to identify co linearity so it’s prior to performing a linear regression analysis. [5]
For the model construction for the effective anomaly detection system wireless local area network log is used for modelling the behavior analysis. This log has different files for each access point and for each day. File names start with the name of the access point. The suffix of file names shows the type of information it contains. These files contain the attributes like name of the building, access points, in/out packets from IP, TCP, UDP and SMTP etc.… Factor analysis has performed to achieve better accuracy in unsupervised learning algorithm for the
6 (Anglim, 2007)
effective anomaly detection system on the same data. SPSS is used to perform factor analysis by following steps.
4.1
Identify the Measurements
In this step variables are measured on the same or matched experimental units. Identify the nature of the constructs underlying responses in a specific content area. It is used to study the patterns of relationship among many dependent variables, with the goal of discovering something about the nature of the independent variables that affect them, even though those independent variables were not measured directly. So in this step identifies the variables measured which will be used in model construction.
4.2
Extract initial factor loading
In this step each factor accounts for a maximum amount of variance that has not previously been accounted for by the other factors. Assign the number of factors will be extracted from the initial set. Univariate descriptive the mean, standard deviation and number of valid cases for each variable is also included. Initial solution displays initial communalities, Eigen values, and the percentage of variance explained. By setting the options like descriptive statistics, choose the proper method for feature extraction, factor rotation, factor analysis generating co relation matrix, Pattern matrix, scree plot, Eigen values etc… Rotation for factor loading allows you to select the method of factor rotation. The available methods are varimax, direct oblimin, quartimax, equinox, or Promax. The direct oblimin method is used as a rotation method that must be selected to obtain a rotated solution. For orthogonal rotations, the rotated pattern matrix and factor transformation matrix are displayed. For oblique rotations, the pattern, structure, and factor correlation matrices are displayed. The score setting also done. It's used to set the method for getting the score for Co linearity among the factors. Regression method for is used for generating the score matrix. Factor analysis also supports the options to treat with missing values.
4.3
Analyze Correlation Matrix
After the setting the all options, the available options are coefficients, significance levels, determinant, KMO and Bartlett's test of sphericity, inverse, reproduced, and anti-image. You can either retain all factors whose Eigen values exceed a specified value, or you can retain a specific number of factors.
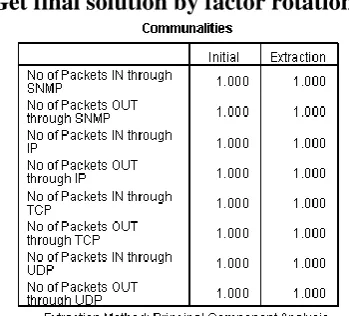
[image:3.595.334.509.549.707.2]4.4
Get final solution by factor rotation
Fig 2: Factor Analysis: Total Variance Results
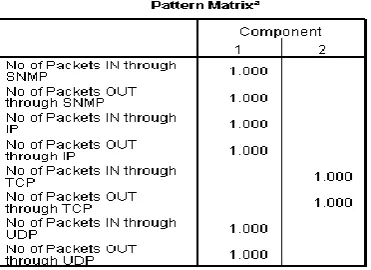
[image:4.595.312.532.290.417.2]Fig 3: Factor Analysis: Pattern Matrix
Fig 4: Factor Analysis: Factor Score Coefficient Matrix
Fig 5: Factor Analysis: Factor Score Covariance Matrix
Fig 6: Scree Plot for Model Construction
4.5
Interpret
the
Result
of
Factor
Structure:
The reliability of the factor analysis always depends on the sample size so according to the field suggesions in 2005 sample size also necessary because the co relation and co-efficient fluctuates from sample to sample so they finally conclude that 300 cases are adequate. So communalities after extraction should be above 0.5. The figure 1 is satisfying the communalities measures among the variables. 7
As with regression, singularity causes problems in factor analysis because it becomes impossible to determine the unique contribution to a factor of the variables that are highly correlated therefore, at this early stage now focus to eliminate any variables that don’t correlate with any other variables or that correlate very highly with other variables (R< .9).Determinant of this matrix and this option is vital for testing for multicollinearity or singularity. The determinant of the R-matrix should be greater than 0.00001 Multicollinearity can be
[image:4.595.91.274.475.589.2]
detected by looking at the determinant of the R-matrix. The figure 3 shows the final pattern matrix for the model construction by performing 2 iterations.
The attribute removal done based on the KMO theory that the KMO value for each attribute should be greater than .5 is adequate for the performed results showing in figure 3 and 4.
The scree plot is a useful way of establishing how many factors should be retained in an analysis. Eigenvalues represent the amount of variance accounted for by each factor. The unrotated factor solution is useful in assessing the improvement of interpretation due to rotation. If the rotated solution is little better than the unrotated solution then it is possible that an inappropriate (or less optimal) rotation method has been used that is shown in figure 6.
As per the primary analysis, the scree plots and the eigenvalues over 1 lead you retain the same number of factors then continue with the analysis with proper direction. So the figure 2 & 6 shows same two factors for proposed model construction.
5.
CONCLUSION AND FUTURE WORK
This paper is focusing on the preprocessing performance, one step of feature construction for optimize the efficiency of the unsupervised algorithm for the effective anomaly detection system. So as per the feature construction for efficient model using factor analysis two factors are generated. The results which are shows in figures getting by performing feature construction methods gives information that the network traffic using TCP is differ than other protocols IP, UDP and SMTP. So the packet transmission using with these three may be co related. So it’s useful for further analysis using unsupervised learning for anomaly detection.
After this, Cluster analysis will groups individuals or objects into clusters so that objects in the same cluster are homogeneous and there is heterogeneity across clusters. This technique is often used to segment the data into similar, natural, groupings. For both analytical techniques, a focus will be on when to use the analytical technique, making reasoned decisions about options within each technique. This will useful for defining the behavioral model for anomaly detection. [6]
6. REFERENCES
[1] Matrix Factorization Approach for Feature Deduction and Design of Intrusion Detection Systems. V´aclav Sn´aˇsel, Jan Platoˇs, Pavel Kr¨omer,Ajith Abraham.
[2] Feature Construction Scheme for Efficient Intrusion Detection System. EUNHYE KIM, SEUNGMIN LEE, KIHOON KWON AND SEHUN KIM. 2010. Korea : JOURNAL OF INFORMATION SCIENCE AND ENGINEERING 26, , 2010. 527-547 .
[3] Factor-analysis based anomaly detection and clustering.
Ningning Wua, *, Jing Zhangb. Elsevier. s.l. : Decision Support Systems 42 (2006), Elsevier, Vol. 42. 375– 389.
[4] Data Preprocessing for anomaly based network intrusion detection: A Review. Jonathan J. Davis, Andrew J. Clark. 2011. s.l. : Computers & Securities, 2011, Vol. 30. 353-375.
[5] DeCoster, Jamie. August 1, 1998. Overview of Factor Analysis. Department of Psychology, Tuscaloosa, AL 35487-0348 : August 1, 1998.
[6] Anglim, Jeromy. 2007. Cluster Analysis & Factor Analysis. http://jeromyanglim.googlepages.com/. [Online] 2007. 325-711 Research Methods.