Study on the Correlation Coefficient of Gene Expression
by using a Hybrid Intelligent System
Zhi Yuan Chen
University of NottinghamFaculty of Science Kuala Lumpur, Selangor, 43500
Semenyih, Malaysia
Dino Isa
University of NottinghamFaculty of Engineering Kuala Lumpur, Selangor, 43500
Semenyih, Malaysia
Timothy Brailsford
University of NottinghamFaculty of Science Kuala Lumpur, Selangor, 43500
Semenyih, Malaysia
ABSTRACT
Normal Lung and carcinoid are high relative classes in our “Detection and Prediction of Lung Cancer using the zNose with the Support Vector Machine Classifier” project. The mRNA expression level of these two classes was analyzed by using oligonucleotide microarrays. The correlation coefficient measurement results referred to the 20 subclasses (mRNA expression) of normal lung and carcinoid, which were collected from a total of 203 specimens (186 snap-frozen lung tumors and 17 normal lungs). The distinct subclasses (mRNA expressions) are 31687_f_at hemoglobin (β), 31525_s_at hemoglobin (α2), and 31481_s_at thymosin (β10). The Correlation Coefficient reflected the results at 0.8702, 0.8935 and 0.9105 respectively (SMOreg PolyKernel -E 1.0). This study also showed the best prediction class was the first level class which was reflected from the correlation coefficient, recorded at 0.9409. This result was further verified by the prediction capacity of our proposed system.
General Terms
Hybrid Intelligent System, Lung Cancer Detection System, Data Mining and Artificial Intelligence Classifiers.
Keywords
Correlation Coefficient, Gene Expression, Prediction Accuracy, Case-Based Reasoning and Support Vector Machine (SVM).
1.
INTRODUCTION
Cancer burden in Malaysia is increasing. Although there have been improvements in cancer diagnosis, new detection methods may potentially cause an exponential increase in the cost of cancer treatment [1]. Therefore, we propose a Lung Cancer Detection system which is a hybrid breath test [2] and case-based reasoning [3] platform structure. This system incorporates patient models to help multivariate analysis [4] information in order to make diagnosis decisions fast inexpensive and accurate. The objective of this project is to combine data mining technology and artificial intelligence classifiers as a means to construct lung cancer patient models and to link this to the case-based reasoning cycle in order to provide precise diagnosis of lung cancer in a timely manner.
From the technological point of view, our proposed hybrid system is combined with four specific processes which are Data Collection, Data Mining & AI Techniques, Patient
modeling and Case-Based Reasoning in order to achieve a fast, safe, reliable, high accuracy of lung cancer prediction. In our case, the support vector machine (SVM) [5] will be used to classify information which fuses attributes into an organized lung cancer knowledge base [6] and the Case-Based Reasoning cycle will be applied in the system to help with the prediction process. The current lung cancer classification is based on clinicopathological features [7]. Normal Lung and carcinoid are high relative classes for this lung cancer prediction project. The microarray methods [8] have made it possible to interpret the gene expression for various tumor types. In this study, we choose the mRNA expression [9] level of these two classes which was analyzed by using oligonucleotide microarrays [10].
Here we report a correlation coefficient study on gene expression within normal lung and carcinoid class, in which we provide evidence for the high level class to serve as first level indicator and distinct subclasses to be second level determinants for the system prediction capacity.
2.
METHOD
2.1
Specimens and Datasets
A total of 203 specimens (186 snap-frozen lung tumors and 17 normal lungs) were used to create two high level classes (C1&C2). The test dataset includes histologically defined lung adenocarcinomas (C1=COID, n=10) and normal lung (C2=NL, n=10) specimens. The C1 and C2 classes have been assigned value of 1 and 0 respectively. And this can be seen as the first dataset.
The subclasses of test dataset include 20 typical gene expressions (see Table 1) which was the second dataset.
The experimental dataset was the combination of the first dataset and the second dataset.
2.2
Microarray Experiments
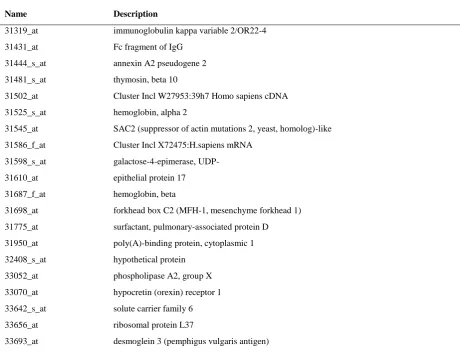
Table 1. Gene Description
Name Description
31319_at
31431_at
31444_s_at
31481_s_at
31502_at
31525_s_at
31545_at
31586_f_at
31598_s_at
31610_at
31687_f_at
31698_at
31775_at
31950_at
32408_s_at
33052_at
33070_at
33642_s_at
33656_at
33693_at
immunoglobulin kappa variable 2/OR22-4
Fc fragment of IgG
annexin A2 pseudogene 2
thymosin, beta 10
Cluster Incl W27953:39h7 Homo sapiens cDNA
hemoglobin, alpha 2
SAC2 (suppressor of actin mutations 2, yeast, homolog)-like
Cluster Incl X72475:H.sapiens mRNA
galactose-4-epimerase, UDP-
epithelial protein 17
hemoglobin, beta
forkhead box C2 (MFH-1, mesenchyme forkhead 1)
surfactant, pulmonary-associated protein D
poly(A)-binding protein, cytoplasmic 1
hypothetical protein
phospholipase A2, group X
hypocretin (orexin) receptor 1
solute carrier family 6
ribosomal protein L37
desmoglein 3 (pemphigus vulgaris antigen)
2.3
Experimental Design
In our previous study [11] [12], we have testified in our proposed system that using SVM as a data mining engine and case-based reasoning retrieval engine can produce better classification and prediction performance. Within those experiments we clarified that high level class was the best indicator for the prediction task. In order to validate this argument and at the same time locate the distinct gene expression which would be determinants to the lung cancer prediction task, two different series of experiments were considered:
(1) Do the weighting of poly inner-product kernels of the support vector machine (SVM) [13] at E=0.5, 1, 1.5, 2 with test sample dataset. (Experiment Ⅰ)
(2) Do the weighting of normalized poly inner-product kernels of the support vector machine at E=0.5, 1, 1.5, 2.0 with test sample dataset. (Experiment Ⅱ)
The tool used in these experiments is Weka [14], which is a machine learning algorithms workbench. The overall performance measures [15] used in our study is correlation coefficient. According to the oligonucleotide microarrays experimental results (Table 1), 20 typical gene expressions have been selected in our experiments. These subclasses have attached attribute ranging from immunoglobulin, Fc fragment of IgG, annexin, thymosin, hemoglobin (alpha 2 and beta),
epithelial protein 17, pulmonary-associated protein D, ribosomal protein L37, hypothetical protein to Cluster Incl (mRNA and cDNA), SAC2, UDP, MFH-1, cytoplasmic 1, phospholipase A2, hypocretin (orexin) receptor 1 and solute carrier family 6.
The aim of these experiments is to measure the correlation coefficient of the high level class (C1=COID=1, C2=NL=0) and 20 typical subclasses (gene expressions) as indicators for the system’s prediction task. Due to the better performance shown in previous study [11] [12], two types of inner-product kernel have been implemented to aid in this correlation coefficient study. Experiment Ⅰ, the poly inner-product kernels of SVM was chosen to serve as the learning engine, while the normalized poly inner-product kernels of the SVM has been implemented in Experiment Ⅱ( testing on different classes with the same experimental dataset).
0
0.1
0.2
0.3
0.4
0.5
0.6
0.7
0.8
0.9
1
31319314313144431481315023152531545315863159831610 31687316983177531950324083305233070336423365633693class
[image:3.595.70.529.75.299.2]E=0.5
E=1
E=1.5
E=2
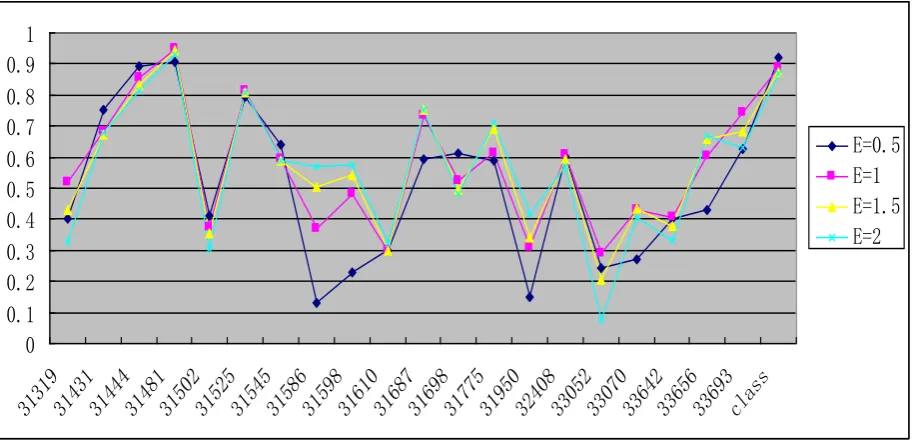
Fig 1: Correlation Coefficient Experimental Results with Poly Kernel
WEKA provides several options for testing the results. In our study we tested them on the training data by using cross-validation [16] method and indicated folds to 10, which means the inner-product kernels model will be tested ten times by:
(1) Holding out 1/10 of the training data set
(2) Developing a model for the remaining 9/10 of the training data set
(3) Testing the result model on the 1/10 withheld.
The data withheld is selected at random from the data not yet tested. At the conclusion all data will have been used as test
data, so that the testing accuracy in the experiment will be assured.
As far as other parameters, all followed recommendations from WEKA too. The cache size was set to 250007, the number of kernel evaluations was 210, and support vectors were 20. The parameter C of the support vector machine was set to 1.0. The exponent E was denoted a range from 0.5 to 2.0 for the poly inner-product kernel and the normalized poly inner-product kernel.
0
0.1
0.2
0.3
0.4
0.5
0.6
0.7
0.8
0.9
1
3131931431314443148131502315253154531586315983161031687316983177531950324083305233070336423365633693class
E=0.5
E=1
E=1.5
E=2
[image:3.595.61.519.490.711.2]3.
RESULTS AND CONCLUSIONS
In Table 2, we showed the overall better performance for the first four distinct classes, as measured by correlation coefficient, of two kernels at 4 exponential points in two groups of same test sample. We tuned each method (support vector machines with two different kernels) to the basic set recommended by WEKA.The results over all 20 gene expressions and 1 high level class in Figure 1 and Figure 2 show two major findings:
(1) In the Poly inner-product prediction task, high level class is the best correlation function for all four exponential points. Three subclasses (gene expressions): 31687_f_at hemoglobin (β), 31525_s_at hemoglobin (α2), and 31481_s_at thymosin (β10) outperform all other expressions, and the average correlation coefficient has achieved more than 80%.
(2) In the Npoly inner-product prediction task, subclass (gene expression) 31481_s_at thymosin (β10) is the best correlation function for all four exponential points. High level class also provide better result for the same task, average correlation coefficient has achieved 88.94%. 31687_f_at hemoglobin (β) and 31525_s_at hemoglobin (α2) together with these two classes almost outperform all other expressions.
This study attempts to understand the competence of high level class and gene expression subclasses with the inner-product kernel of the support vector machine in determining the system’s prediction performance. These empirical results provided evidence for high level class as indicator and gene expression distinct subclasses as second level indicator in the system predictive process.
First, let us consider the overall performance of these classes with the poly inner-product kernel. In Figure 1, we grouped all these methods by correlation coefficient in order to find out whether there was relativity between prediction performance and classes (high level class and gene expression subclasses) with different exponents of poly inner-product kernel. A good indicator, we would expect, has about equally better performance for different exponential values. Comparing correlation coefficient performance for all these exponential value in experimentⅠ, shown in Fig. 1, we found that only high level class and three subclasses (gene expressions): 31687_f_at hemoglobin (β), 31525_s_at
hemoglobin (α2), and 31481_s_at thymosin (β10) with different exponential value satisfied this requirement. High level class achieved the best performance with 95.21% correlation coefficient at E=1.5 exponential point and 94.09% at E=2 exponential point; followed by gene expression subclass 31481_s_at thymosin (β10) with 93.17% at E=1.5 exponential point and 91.05% at E=1 exponential point. Even the 31687_f_at hemoglobin (β) gene expression subclass which got the worst performance in the distinct class group reached 84.93% at E=1.5 exponential point and 87.02% at E=1 exponential point. While for other gene expression subclasses, the best correlation coefficient achieved by 31586_f_at Cluster Incl X72475, although obtained 87% and 87.34% at E=1.5 and E=2 exponential point, when the exponential value decrease to 1 and 0.5, its correlation coefficient dropped dramatically to 34.8% and 20.45%. It is a typical unstable state phenomenon which shows up in many other gene expression subclasses, such as 31775_at surfactant and 33052_at phospholipase. Some gene expression subclasses show stable relativity, but this stability is the degression of the phospholipase. The representative species for this phenomenon were 31502_at Cluster Incl W27953, 31610_at epithelial protein 17, 31950_at poly (A)-binding protein and 33693_at desmoglein 3. For example, 31502_at Cluster Incl W27953 gene expression subclass achieved 45.77% correlation coefficient at E=0.5 exponential point, but when the exponential value increased to 1, 1.5 and 2, its correlation coefficient dropped dramatically to 11.58%, 7.61% and 9.92%. Some gene expression subclasses show stable relativity also, but this stability is at quite lower level. For example 31698_at forkhead box C2, 32408_s_at hypothetical protein and 33642_s_at solute carrier family 6, the average correlation coefficient they achieved was at about 30%-40%.
[image:4.595.69.526.604.751.2]Secondly, in order to see if the correlation coefficient of those classes (high level class and gene expression subclasses) for different inner-product kernels was still reliable, detailed experiments were performed. Using WEKA with Npoly inner-product kernel, as expected, high level class together with three distinct gene expression subclasses were observed to produce superior performance whether at 0.5, 1 or 1.5, 2 exponential point.
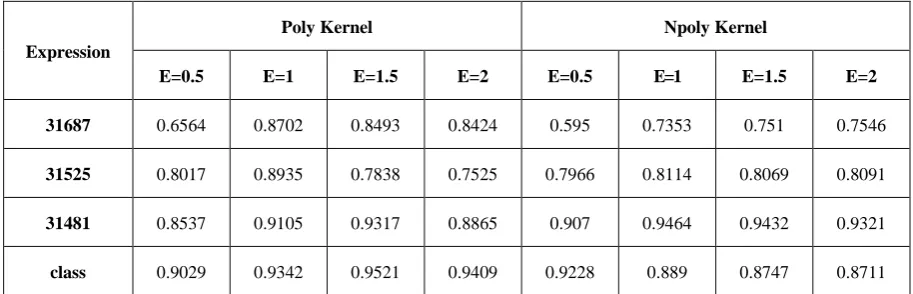
Table 2. Distinct Classes of Correlation Coefficient
Expression
Poly Kernel Npoly Kernel
E=0.5 E=1 E=1.5 E=2 E=0.5 E=1 E=1.5 E=2
31687 0.6564 0.8702 0.8493 0.8424 0.595 0.7353 0.751 0.7546
31525 0.8017 0.8935 0.7838 0.7525 0.7966 0.8114 0.8069 0.8091
31481 0.8537 0.9105 0.9317 0.8865 0.907 0.9464 0.9432 0.9321
Experimental results in Figure 2 and Table 2; showed that for the Npoly inner-product kernel prediction task, gene expression subclass 31481_s_at thymosin (β10) outperformed the high level class. But the high level class also provided better result for the same task; average correlation coefficient has achieved 88.94%. An interesting phenomenon was that most gene expression subclasses had achieved the greatest correlation coefficient for this predicting task. In particular 31444_s_at annexin A2 pseudogene 2 at all exponential points correlation coefficient reached an average of 84.85%. This result was interpreted as additional evidence for the gene expression subclass to serve as second level indicator. Furthermore, as expected, 31687_f_at hemoglobin (β) and 31525_s_at hemoglobin (α2) achieved better performance; 75.46% at E=2 exponential point and 81.14 % at E=1 exponential point.
From all these results, it is clear that all of these classes (high level class and distinct gene expression subclasses) achieved better correlation coefficient consistency in determining the system’s prediction performance. More surprisingly was that most gene expression subclasses in the Npoly inner-product kernel of all exponential points achieved better performances, which suggests gene expressions are reliable for system prediction task. High level class achieved 95.21% with Poly product kernel at E=1.5 and 92.28% with Npoly inner-product kernel at E=0.5. This verified the argument in the previous study for high level class to serve as the indicator for the system prediction task.
Overall, the experimental results were encouraging in that they support the argument of the previous study and the new hypothesis. The high level class and three distinct gene expression subclass 31687_f_at hemoglobin (β), 31525_s_at hemoglobin (α2), and 31481_s_at thymosin (β10 ) were found to assist in system prediction task effectively and reliably.
4.
ACKNOWLEDGMENTS
This work was supported by the Ministry of Science, Technology & Innovation, Malaysia. (Grant reference 01-02-12-SF0089).
5.
REFERENCES
[1] I. Vergote, J. S. Gordon, A. Elisabeth, G. B. Kristensen, E. Pujade-Lauraine, M. K. B. Parmar and J. B. Vermorken, 2000. New Guidelines to Evaluate the Response to Treatment in Solid Tumors [Ovarian Cancer], Cancer Inst 92: 1534-1535.
[2] CM. Kneepkens, C. Ferreira, G. Lepage, et al, 1992. The hydrocarbon breath test in the study of lipid peroxidation: principles and practice, Clin Invest Med 15:163–186.
[3] A. Aamodt and E. Plaza, 1994. Case-based reasoning: foundational issues, Methodological variations, and system approaches. AI communications, 7(1), pp. 39-59.
[4] W. R. Dillon and M. Goldstein, 1984. Multivariate analysis: methods and applications, Wiley, pp587.
[5] N. Cristianini and J. Shawe-Taylor, 2000. An introduction to Support Vector Machines and other kernel-based learning method, Cambridge University press.
[6] I. Watson and F. Marir, 1994. Case-Based Reasoning: A Review, The Knowledge Engineering Review, vol.9, No.4.
[7] H. Ohguro, H. Odagiri, M. Nakazawa et., 2004. Clinicopathological Features of Gastric Cancer Cases and Aberrantly Expressed Recoverin, The tohoku Journal of experimental medicine,Vol 202, pp213-219.
[8] B. Yao, S. N. Rakhade, J. A. Loeb, et al, 2004. Accuracy of cDNA microarray methods to detect small gene expression changes induced by neuregulin on breast epithelial cells, BMC Bioinformatics, Vol 5, pp99.
[9] Illumina, 2010. mRNA Expression Analysis, Data Sheet: DNA Analysis, Feb.
[10]A. A. Antipova, P. Tamayo and T. R. Golub, 2002. Strategy for oligonucleotide microarray probe reduction, Genome Biology, Volume 3, Issue 12.
[11]Z. Y. Chen, D. Isa and P. Blanchfield, 2010. Vectorization Algorithm for an Intelligentized System, International Journal of Computer and Network Security, February issue, Vol.2 No2.
[12]Z. Y. Chen, D. Isa, P. Blanchfield and R. Arelhi, 2010. Improve the Classification and Prediction Performance for the IP Management System in a Super-capacitor Pilot Plant, International Journal of Latest Trends in Computing, Volume 1, Issue 2, December.
[13]C. Cortes and V. Vapnik, 1995. Support-vector network. Machine Learning, pp.273-297.
[14]I. H. Witten and E. Frank, 2005. Data Mining: Practical machine learning tools and techniques, 2nd Edition, Kaufmann, Morgan, San Francisco.
[15]E. R. House, 1996. Assumptions underlying evaluation models. Assessment & Evaluation in Higher Education, 1469-297X, Vol. 21(4), pp. 347-356.