F. W. L. Kho, et al.
INTRODUCTION
Transportation activities have been identified as a single major source of air pollution in urban areas (Mukherjee and Viswanathan, 2001) with subsequent adverse human health effects (Chan, et al., 2002; Colvile, et al., 2001). Similarly with other developing cities, commercial areas in Kota Kinabalu city attract and generate relatively large volumes of traffic, particularly during rush hours that typically circulates at low speeds with frequent stops and starts. This traffic pattern produces relatively high CO emissions. Since commercial areas also attract large numbers of people, the potential for human exposure is relatively high. Sensitive stationary receptors within the city’s commercial area such as schools, residential flats and apartments and other public places also become a concern on the effect of traffic related emissions on populations’ health and the local environment. Motor vehicles as a combined emission source make a significant contribution to the atmospheric pollution inventory; that contributed over 90% of CO emission in the urban area (Hasnah, et al., 2000). The CO levels IInt. J. Environ. Sci. Tech., 4 (1): 27-34, 2007
ISSN: 1735-1472
© Winter 2007, IRSEN, CEERS, IAU
Received 30 October 2006; revised 28 November 2006; accepted 7 December 2006; available online 1 January 2007
*Corresponding author, Email: [email protected]
Tel: +6082 456877/ 583282; Fax: +6082 456577
Carbon monoxide levels along roadway
1*F. W. L. Kho, 1P. L. Law, 1S. H. Ibrahim, 2J. Sentian
1
Department of Civil Engineering, University Malaysia Sarawak (UNIMAS), 94300 Kota Samarahan, Sarawak, Malaysia
2
School of Science and Technology, University Malaysia Sabah (UMS), Locked Bag No. 2073, 88999 Kota Kinabalu, Sabah, Malaysia
AB STRACT: This paper predicts and compares the carbon monoxide (CO) concentration levels along Sembulan Road for years 2004 and 2014 using CAL3QHC air dispersion model at two major locations, i.e., at Sembulan Roundabout and Sutera Harbour Intersection, Kota Kinabalu, Sabah, Malaysia. The CO concentration “hot-spots” were also identified at Sutera Harbour Intersection, and the highest maximum 1-hr average ground level concentrations of CO modeled for Kpg. Air Sembulan located in the northeast of idling road was 9.33 ppm for year 2004. This study showed that there would be no extreme changes in CO concentration trends for year 2014 although a substantial increase in the number of vehicles is assumed to affect the level of CO concentrations. It was also found that the CO levels would be well below the Malaysian Ambient Air Quality Guidelines of 30 ppm for 1-hour Time-Weighted Average (TWA). Comparisons between the modeled and observed outputs using quantitative data analysis technique and statistical methods indicated that the CAL3QHC predicted results correlated well with measured data. It was predicted that receptors located near to the major intersection, in the long-term would be potentially exposed to relatively higher CO levels.
Key words:Carbon monoxide, air dispersion model, maximum 1 h average, intersections
peak hours, to assess the levels of receptors exposure, and to evaluate the compliance of the predicted CO levels by comparing with the Recommended Malaysian Air Quality Guidelines.
MATERIALS AND METHODS
Description of experimental sites
Kota Kinabalu (06o05’30"N; 116o07’30"E) with an
estimated population of 400,000, is a developing city in the State of Sabah, Malaysia (Fig. 1). Major commercial and business activities are concentrated in the city center (Mukherjee and Viswanathan, 2001). This study was carried out at a traffic light intersection and a roundabout in the city center of Kota Kinabalu. Air dispersion modelings were carried out along Sembulan Road; a roadway connecting Sutera Habour Intersection and Sembulan Roundabout (Fig. 1). Measurements of CO were carried out at twelve monitoring sites along Sembulan Road, Kota Kinabalu at St. Joh Ambulance Centre, Sikh Temple, Masjid Negeri, Jabatan Kerja Raya, Jabatan Bomba, S.M.K.
Sanzas, Kpg. Sempelang, Kpg. Sembulan, Kpg. Air Sembulan, Sembulan Shoplets, Grace Villa and Sutera Harbour Resort (Figs. 4 and 5).
Field measurements
[image:2.595.77.525.379.700.2]The computer simulated results were compared to the measured CO levels at twelve monitoring sites. The CO levels were measured using carbon monoxide Analyzer Model 416 NDIR, a portable continuous on-line CO monitor with detection range between 0-100 part per million (ppm). The sample gas flow rate was 0.5 ± 0.25 L/min. The zero gas was flowed through and warmed-up the instrument. The war m-up was completed when the zero point stabilized (about 4 h). A standard CO span gas and zero air were used to calibrate the instrument before and after each field measurement. The monitoring instruments were positioned at 1.5 m from the ground and at least 3 meters from the road shoulder. The measurements were conducted continuously for a period of 12 h (0600-1800 h) during the month of January 2004.
Fig. 1: Locality of Sembulan Road, Kota Kinabalu, Sabah, Malaysia
F. W. L. Kho, et al.
Roadside enumeration/ spot count
The roadside enumerations were carried out simultaneously with the roadside interviews to provide a check on the total number of vehicles passing by the survey stations. Sembulan Road is a double carriageway with two lanes at each roadway with exception at some intersections where the numbers of lanes for the roadway are between 3 to 6 lanes. Traffic counting included mainly “Tally Sheet” model to ensure every surveyor recorded 3 types of vehicles at the same time. Field motor vehicle counts were continuously monitored for different categories of vehicles (i.e. heavy duty, light duty petrol and diesel) for each direction. Every surveyor was provided with a manual counter. The average number of motor vehicles passing through each of the monitoring sites measured between 2,074- 2,321 vehicles/hour. The average vehicle speed was in the range of 20-50 km/h. MOBILE 5A was used to generate Traffic source emission factors for input into the CAL3QHC model.
Meteorological data
A portable meteorological weather station (ESM Model 900) was installed at the monitoring sites to monitor continuously the wind speed, wind direction, temperature and humidity. Meteorological data were also obtained from the nearest meteorological station managed by Malaysian Meteorological Service Department to determine the atmospheric stability class.
Defining Receptors
Receptors are defined as locations close to the roadway where pollutant concentrations caused by mobile sources are to be measured. Receptors can exist as part of a grid or as discrete receptors. A receptor should be located outside the “mixing zone” of a roadway, which is the total width of the travel lanes of a roadway plus 3 meters (10 feet) on either side. A total of 12 discrete receptors (monitoring site) were assessed in terms of potential exposure of CO by comparing with the Malaysian Ambient Air Quality Guideline of 30 ppm (1h-TWA). Potential exposures that exceed the ambient standard may be of greater concern to public health because they increase the total body burden for CO (USEPA, 1999).
CO emission modeling
This modeling study utilized CAL3QHC (Version 2) dispersion model to predict CO concentrations, C(x) emitted from motor vehicles at roadway intersections.
The model is a line source air quality model developed by the California Department of Transportation (Caltrans). It is based upon Gaussian diffusion equation and employs a mixing zone concept and a traffic algorithm to characterize pollutant dispersion over the roadway. CAL3QHC could be enhanced for estimating queue lengths and the contribution of emissions from both moving and idling vehicles near signalized intersections. CAL3QHC automatically sums the contributions from each link and queue to a certain receptor. Surface roughness and meteorological variables (such as atmospheric stability, wind speed, and wind direction) are assumed to be constant in the area under study (Trinity Consultants Incorporated, 1993). A free-flow link is defined as a straight segment of roadway having a constant traffic volume, width, travel speed, height, and vehicle emission factor. The link speed for a free-flow link speed represents the speed of a vehicles traveling along the link in the absence of the delay caused by traffic signals. CAL3QHC assumes that vehicles will be in an idling mode of operation only during the red phase of the signal cycle. It calculates the emission source strength based on the idling emission rate, the number of lanes of vehicles idling at the stopping line, and the percentage of red time. The output of the dispersion model is one-hour average CO concentration at the receptors. The non-vehicle originated (background) concentration of CO in trafficked site was 0.2 ppm, which had been estimated using the equation simplified by Larson et al. (1996). Table 1 lists typical input variables to CAL3QHC.
RESULTS
CO modeling for year 2004 and 2014
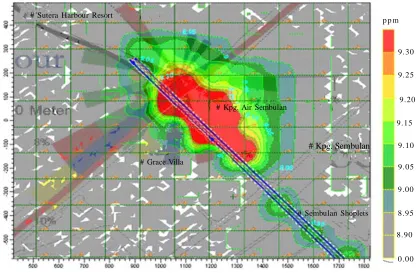
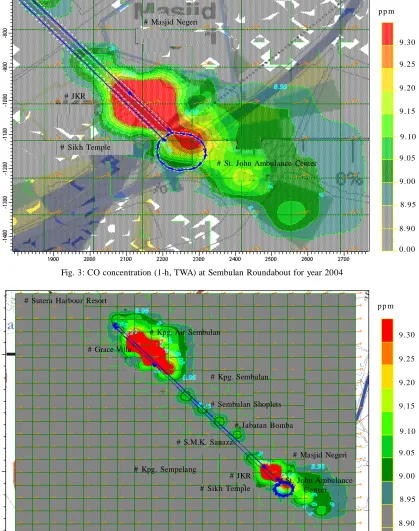
A micro-scale CO dipersion modeling using CAL3QHC had been carried out along Sembulan Road within Kota Kinabalu city center. In 2004, CO “hot-spots” along the link were mainly found at Sutera Harbour Intersection and Sembulan Roundabout. One of the hot-spot was at Kampung Air Sembulan, which was the residential area located just beside the tr affic intersection; with average number of motor vehicles of 2,074 veh/h, which corresponded to a maximum CO concentration (1 h-TWA) of 9.33 ppm (Fig. 2). At the Sembulan Roundabout, which was one of the busiest roundabout in the city with average number of motor vehicles of 2,321 veh/h was predicted as another CO hot-spot with the highest level recorded 9.20 ppm (1 h TWA) (Fig. 3).
Table 1: Required data for program CAL3QHC
Meteorological variable Averaging time (min)
Surface Roughness coefficient (cm) Settling velocity (cm/s)
Wind speed (m/s)
Stability class (1 to 6 = A to F) Mixing Height (m)
Site variables
Roadway coordinates (x,y,z) (m or ft) Roadway width (m or ft)
Receptor coordinates (x,y,z) (m or ft) Traffic variables
Traffic volume (each link) (veh/h) Traffic speed (each link) (mi/h)
Average signal cycle length (each intersection) (s) Average red time length (each approach) (s) Clearance lost time (s)
Saturation flow rate (veh/h) Emission variables
Composite running emission factor (each free flow link)- (g/veh-mi)
Idle emission factor (each queue link) (g/veh-h) Signal type variables
1 = pretimed; 2 = actuated; 3 = Semiactuated Arrival type
1 = Worst progression; 2 = Below average progression; 3 = Average progression;
4 = Above average progression; 5 = Best progression
Fig. 2: CO concentration (1 h, TWA) at Sutera harbour Intersection for year 2004
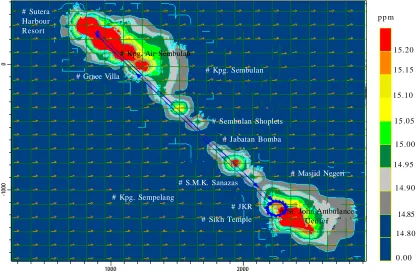
The section of r oad con n ectin g Sembulan Roundabout and Sutera Harbour Intersection showed a general free flow vehicles network. Fig. 4 shows the CO concentration levels simulated by air dispersion model along the Sembulan Road whereby discrete receptors were quite consistent CO level of 8.90 ppm (1 h TWA). The predicted CO level for Kampung Air Sembulan in year 2014 would be identifying higher as compared to the other receptors/CO hot-spots located at Sutera Harbour interception. The maximum CO concentration (1 h-TWA) at Kampung Air Sembulan would be around 15.1 ppm, while the readings for other receptors would be around 14.8 ppm. The level for ST. John Ambulance Centre would be 15.2 ppm and 14.8 ppm for other receptors and CO hot-spots near the Sembulan roundabout (Fig. 5), respectively. A comparison of CO concentration 1 h-TWA from year 2004 to 2014, showed an increase of 64.13% (from 9.2 ppm to 15.1 ppm) for St. John Ambulance Centre; 63.43% (9.3 ppm to 15.2 ppm) for Kampung Air Sembulan and 66.29% (8.9 ppm to 14.8 ppm) for the rest of CO hot-spots. However, CO levels in all are still below the threshold value for 30 ppm ambient air quality standard of the Department of Environmental (DOE), Malaysia.
9.25
9.20
9.15
9.10
9.05 9.30
9.00
8.95
8.90
0.00 p p m # Sutera Harbour Resort
# Grace Villa
# Kpg. Air Sembulan
# Kpg. Sembulan
[image:4.595.98.515.427.700.2]F. W. L. Kho, et al.
Fig. 3: CO concentration (1-h, TWA) at Sembulan Roundabout for year 2004
Fig. 4: CO concentration (1-h, TWA) along Sembulan Road for year 2004
Int. J. Environ. Sci. Tech., 4 (1): 27-34, 2007
9.25
9.20
9.15
9.10
9.05 9.30
9.00
8.95
8.90
0.00 p p m # Masjid Negeri
# JKR
# Sikh Temple
# St. John Ambulance Center
9.25
9.20
9.15
9.10
9.05 9.30
9.00
8.95
8.90
0.00 p p m # Sutera Harbour Resort
# Grace Villa
# Kpg. Air Sembulan
# Kpg. Sembulan
# Sembulan Shoplets
# Jabatan Bomba
# S.M.K. Sanazas
# Kpg. Sempelang
# Masjid Negeri
# JKR # Sikh Temple
[image:5.595.99.518.126.657.2]Fig. 5: CO concentration (1-h, TWA) along Sembulan Road for 2014 Relatively high CO levels mostly were found at the
intersections that mainly emitted from motor vehicles. Strong positive relationships (regression coefficient, r2 between 0.758-0.983) between the CO concentrations
with the number of vehicles at all monitoring sites were found in this study indicating that motor vehicles had attributed most to nearby CO levels. Similar patterns were also observed in other intersection concerning the attribution of CO emission from motor vehicles (Borrego, et al., 2003). Traffic flow conditions were also attributed high CO concentration particularly at the intersection such as at the Sutera Harbour Intersection during the morning and evening peak hours. This condition could have contributed significantly to the CO concentrations (Sivacoumar and Thanasekaran, 1999). It also observed that the averaged signal cycles in the intersection (120 sec.) was comparatively longer than other intersections in the city. This situation resulted vehicles from various directions to be idled for a longer time, and thus releasing more CO. Motor vehicles with running engine in an idle position have shown to emit more CO than in free flow condition (Fen ger, 1999). Highest CO levels at busiest intersections could have been due to the effect of was
elevated exhaust plumes from slow moving vehicles as observed in some other studies (Hasnah, et al., 2000). The traffic occupancy effect that has been related to the effect of vehicle induced air turbulence in the “mixing zone” could also be responsible to CO variations at observed monitoring sites. Among other factors that could play important roles in the variation of CO levels that had not been investigated in this study included the type of fuel used, age of the motor vehicles (Chan and Liu, 2001), local meteorological condition (Luria, et al., 1990), and urban high-rise building effects (Zhou and Sperling, 2001).
Comparison with field monitoring data
Evaluation of the performance of an air quality model generally focuses on the assessment of the accuracy of model predicted values as compared to observed data (Onursal and Gautam, 1997). In this study, evaluation performed quantitatively and statistically using the data obtained from the field measurements and the results showed that the predicted CO levels from the micro-scale dispersion model compared well with the measured CO levels. The predicted CO concentrations were found to be within a factor of 1 (Table 2).
# Sutera Harbour Resort
# Grace Villa
# Kpg. Air Sembulan
# Kpg. Sembulan
# Sembulan Shoplets
# Jabatan Bomba
# S.M.K. Sanazas
# Kpg. Sempelang
# Masjid Negeri
# JKR
# Sikh Temple
# St. John Ambulance Center
15.15
15.10
15.05
15.00
14.95 15.20
14.90
14.85
14.80
F. W. L. Kho, et al.
[image:7.595.79.285.226.423.2]Pearson correlation analysis was also performed to compare the observed and predicted CO concentration values (1 h TWA) (Table 3). It was shown that a significant positive relationship between observed and predicted CO levels for 1 h TWA with (r = 0.911, p < 0.05). The results of the scatter plot with 95% of the accumulative frequency distribution showed a significant positive relationship betweenobserved and predicted values of
Table 2: Comparison between observed and predicted values of CO (1 h TWA) at various monitoring sites
Sampling Site Observed (ppm) Predicted (ppm) Different (%) Factor **
St. John Ambulance Centre 8.49 9.23 8.02 0.92
Sikh Temple 8.13 8.90 8.65 0.91
Masjid Negeri 8.17 8.93 8.51 0.92
Jabatan Kerja Raya (JKR) 8.19 8.92 8.18 0.92
Jabatan Bomba 8.08 8.91 12.38 0.91
S.M.K. Sanzas 7.96 8.90 10.56 0.89
Kpg. Sempelang 7.95 8.90 10.67 0.89
Kpg. Sembulan 8.10 8.91 9.09 0.91
Kpg. Air Sembulan 8.55 9.33 8.36 0.92
Sembulan Shoplets 8.21 8.91 7.86 0.92
Grace Villa 8.05 8.90 9.55 0.90
Sutera Harbour Resort 7.98 8.89 10.24 0.90
**. Factor = Observed/predicted Mean 0.91
Table 3: Pearson correlations for observed and predicted COconcentration (1 h TWA)
Observed (ppm) Predicted (ppm)
Pearson Correlation 1 .911(**)
Sig. (1-tailed) . .000
Observed (ppm)
N 12 12
Pearson Correlation .911(**) 1
Sig. (1-tailed) .000 .
Predicted (ppm)
N 12 12
DISCUSSION AND CONCLUSION
The maximum 1 h (TWA) concentrations of CO during peak hours modeled along Sembulan Road were in the ranges of 8.89-9.93 ppm on year 2004; 14.80-15.20 ppm for year 2014, which are well below the Malaysian Ambient Air Quality Guideline of 30 ppm. Motor vehicles and the traffic flows conditions were among the main factors that have been identified to contribute to the increase levels of CO at the Sutera Harbour Intersection and Sembulan Roundabout along Sembulan Road. CO concentration “hot-spots” were also iden tified mainly at th e in ter section and roundabout such as Kampung Air Sembulan and St. John Ambulance Centre. Even though in the present study, has shown no alarming situation on CO levels, however, receptors located close to the intersection and roundabout have the potential risk of being exposed to high levels of CO in a long-term and therefore, deserves further attention in the future urban transportation planning.
[image:7.595.80.521.476.608.2]** Correlation is significant at the 0.01 level (1-tailed)
Fig. 6: Observed (ppm) Vs predicted (ppm) values for CO(1-h TWA)
CO for 1-h TWA with ( r2 = 0.898, p < 0.05). Thus, Pearson
[image:7.595.77.526.638.704.2]correlation betweenobserved and predicted CO values has supported the model application is comparable with what been observed or done by on-site measuring (Fig. 6).
REFERENCES
Bogo, H., Negri, R.M., San Roman, E., (1999). Continuous measurement of gaseous pollutants in Buenos Aires city. Atmos. Environ., 33, 2587-2598.
Borrego, C., Tchepel, O. Costa, A.M., Amorium, J.H., Miranda, A.I., (2003). Emission and dispersion modeling of Lisbon air quality at local scale. Atmos. Environ., 37, 5197-5205. Chan, L.Y., Liu, Y.M., (2001 ). Carbon monoxide levels in popular passenger commu ting modes tr aversing major commu ting routes in Hong Kong. Atmos. Environ., 35, 26 37-264 6.
Chan, L.Y., Lau, W.L., Zou, S.C., Cao, Z.X., Lai, S.C., (2002). Exposure level of carbon monoxide and respirable suspended particulate in public transportation modes while commuting in urban area of Guangzhou, China. Atmos. Environ., 36, 58 31-584 0.
Colvile, R.N., Hutchinson, E.J., Mindel, J.S., Warren, R.F., (2001). The transport sector as a source of air pollution. Atmos. Environ., 35,1537-1565.
Comrie, A.C., Diem, J.E., (1999). Climatology and forecast modeling of ambient carbon monoxide in Phoenix Arizona. Atmos. Environ., 33, 5023-5036.
Faiz, A., (1993). Automotive emissions in developing countries-relative implications for global warming, acidification and urban air quality. Transpor. Res., A27, 167-186.
Fenger, J., (1999). Urban air quality. Atmos. Environ., 33, 48 77-490 0.
Hasnah, H., Singh, P., Gribben, R.J., Srivastava, L.M., Radojevic, M., Latif, A., (2000). Application of a line source air quality model to the study of traffic carbon monoxide in Brunei Darussalam. ASEAN J. Sci. Tech. Develop., 17,59-76. Ja mes, H .B., ( 200 2). Introdu ction To Tra nsportation
Engineering. McGraw-Hill Companies, Inc.: 385-405. Larson, T., Moseholm, L., Slater, D., Cain, C., (1996). Local
Background levels of carbon monoxide in an urea. Transport. Res., A30 (6), 399-413.
Luria, M., Weisinger, R., Peleg, M., (1990). CO and NOx levels at the center of city roads in Jerusalem. Atmos. Environ., 24B (1), 93-99.
Mukherjee, P., Viswanathan, S., (2001). C arbon monoxide modeling from transportation sources. Chemos., 45, 1071-1083.
AUTHOR (S) BIOSKETCHES
Kho, F.W.L., B.Sc., is a postgraduate student in environmental engineering, Department of Civil Engineering,
University of Malaysia Sarawak (UNIMAS), Kota Samarahan, Sarawak, Malaysia. Email: [email protected]
Law, P.L., B.SCE., M.SCE., M.Sc., Sc.D., is an associate professor in environmental engineering, Department
of Civil Engineering, University of Malaysia Sarawak (UNIMAS), Kota Samarahan, Sarawak, Malaysia. Email: [email protected]
Ibrahim,S.H., M.S.c, Ph.D., is a lecturer in environmental engineering and the Head of the Department of
Civil Engineering, University Malaysia Sarawak (UNIMAS), Kota Samarahan, Sarawak, Malaysia. Email: [email protected]
Sentian, J., B.Sc.,M.Sc., is a lecturer in the Environmental Science Program, School of Science and Technology,
University Malaysia Sabah (UMS). Email: [email protected]
This article should be referenced as follows: