Journal of Chemical and Pharmaceutical Research, 2016, 8(1):491-502
Research Article
ISSN : 0975-7384
CODEN(USA) : JCPRC5
Ionic liquid loaded hollow fiber membrane as a solid-phase
microextraction fiber; application in determination of aromatic
hydrocarbons in water samples
Naser Samadi
1, Nasim Mohammadnezhad
1*, Amir Abbas Matin
2and Hassan Valizadeh
21Department of Chemistry, Faculty of Science, Urmia University, Urmia, Iran
2Department of Chemistry, Faculty of Sciences, Azarbaijan Shahid Madani University, Tabriz, Iran
_____________________________________________________________________________________________
ABSTRACT
Environmental monitoring of benzene, toluene, ethyl benzene and xylenes (BTEX) in river and well water samples were performed by solid-phase microextraction (SPME) coupled with capillary gas chromatography. For this purpose a novel SPME fiber was prepared based on imidazolium ionic liquids loaded on hollow fiber membrane pores using sol-gel formulation. Copper wire was used as mechanically durable support. Analytical merits of the method, including high correlation coefficients (0.9922-0.9943) and low detection limits (0.04-0.15 µg L-1), made the proposed method suitable for the trace determination of BTEX.
Keywords: Hollow fiber membrane, Ionic liquid, Sol-gel, Solid-phase microextraction, Gas chromatography
_____________________________________________________________________________________________
INTRODUCTION
Solid-phase microextraction (SPME) as a popular sample preparation method was introduced in the last decade of
20th century [1]. During this period of time from invention of SPME, it is still a challenging field for analytical
chemists. Introduction of novel SPME fibers provide us analytical methods with improved characteristics. For this purpose various coating materials are used as extracting phase[2-10] .
hydrocarbons (PAHs)[23]. In this study we tried to make a new SPME fiber using ILs loaded hollow fiber membranes and for this aim, we used sol-gel formulation. In order to evaluate performance of the proposed fiber, BTEX were selected as model analytes.
BTEX as a representative group of important aromatic hydrocarbons with wide range of applications in chemical industries are listed as hazardous materials by the U. S. Environmental Protection Agency (EPA) and the World
Health Organization (WHO). Petroleum and natural gas sources, volcanic emissions, forest fires and chemical
industries like paint, adhesive, rubber, cosmetic and pharmaceuticals are the main sources of the BTEX in the environment. Smoking also is another source of human exposure to the BTEX [24,25]. Exposure to BTEX has short and long-term effects on human health. Some common symptoms of exposure to BTEX are minor nervous system
disorders like fatigue, nausea, weakness and confusion.BTEX may also cause long-term, chronic problems, such as
more pronounced nervous disorders, bone marrow, kidney and liver damage, leukemia, aplastic anemia and chromosomal aberration[26]. Because of the high levels of toxicity and hazards of BTEX to human health, their
levels are regulated by the EPA and the WHO.So, there is a vital need for highly precise, accurate, and sensitive
analytical methods for determining the levels of BTEX in various samples. Generally, BTEX have not been studied
individually; therefore, chromatographic methods are preferred for analyzing them [27-30].
The present work deals with introduction of new SPME fiber based on ILs and hollow fiber membranes and its application in the solid-phase microextraction followed by capillary gas chromatographic determination of BTEX in environmental water samples including river and well water.
EXPERIMENTAL SECTION
Chemicals and reagents
Benzene, toluene, ethylbenzene, Xylene isomers, acetone, hydrogen chloride, 2-propanol, ethyl acetate, sodium chloride and acetonitrile were all obtained from Merck (Darmstadt, Germany). 1-vinyl imidazole, hexyl chloride, sodium hexafluorophosphate, methyltrimethoxysilane (MTMOS) and tetramethoxysilane (TMOS) were purchased from Sigma-Aldrich (St. Louis, USA). The 50/280 Accurel polypropylene hollow fiber membranes (280 µm I.D.) from Membrana GmbH (Wuppertal, Germany) were used. Nitrogen and hydrogen (99.999 % purity) were obtained from the Sabalan Oxygen Co. (Tehran, Iran). Copper wire was purchased from a local electronic shop and used after removing insulation.
To prepare mixture of standards, 2 mL of each compound added to a vial, well mixed and stored at -18 ºC in a refrigerator as stock solution. Aqueous solution of BTEX compounds were made by dilution of appropriate volumes of stock solution with water in calibration flasks.
Instrumentation
An Agilent 7890A, GC apparatus (Agilent technologies, Wilmington, DE, USA) equipped with an FID detector and split/splitless injector was utilized for sample analysis. Separations were performed using an HP-5 (5 % diphenyl-95
% dimethyl polysiloxane) capillary column (30 m × 0.32 mm I.D., film thickness 0.25 µm) (Agilent technologies,
Wilmington, DE, USA). ChemStation software was used to acquire and process data.
A laboratory-made SPME device was used in all experiments. Coating surface morphology was studied using a 1430VP Zeiss-Leo scanning electron microscope at university of mohaghegh ardabili (Ardabil, Iran). Thermal stability of the fiber was studied using thermogravimetric analyzer (Mettler Toledo, Columbus, OH, USA). RCT basic model heater-stirrer (IKA, Staufen, Germany) was used to make temperature adjustments and for sample agitation.
Synthesis of 1-vinyl-3-hexyl-imidazolium hexafluorophosphate [VMIM][PF6]
The mixture of 1-vinyl imidazole (0.06 mol) and hexyl chloride (0.06 mol) in 20 mL of 2-propanol was refluxed at 60 ºC for 16 h under vigorous agitation. After cooling to room temperature, 2-propanol was evaporated under vacuum. The prepared IL was then dissolved in 20 mL of water and extracted five times with 10 mL portions of
Preparation of SPME Fiber
The proposed fiber was prepared in four steps. First, the sol solution was prepared as follows: 100 µL TMOS, 10 µL
MTMOS and 100 µL H2O were mixed in a clean tube and then 100 µL IL was added and a clear and homogeneous
liquid mixture was prepared (Sol solution). Second, a piece of copper wire (1cm length, 280 µm O.D.) was mounted on a SPME device.
Next, it was entered into the narrow bore hollow fiber membranes (280 µm, I.D.), and any excess hollow fiber was cut. Third, the hollow fiber-coated copper wire was immersed in the sol solution for 5 min. After loading sol solution in hollow fiber pores, the fiber was immersed in 1mM HCl solution. Gelling process was taken place in hollow fiber porous structure.
Fourth, the IL incorporated sol-gel loaded in hollow fiber pores was left for aging for 12 hours. The prepared fiber was heated at 150 ºC for removing fiber contaminations in the GC injection port.
Solid-phase microextraction of BTEX from water samples
The proposed fiber was exposed to the headspace of the water sample. During the extraction, the sample solution was stirred with a magnetic stir bar and the vial temperature was thermostated at 20 ± 1 ºC. After exposing the fiber to the headspace of the sample for 40 min, the fiber containing retained analytes was withdrawn from the vial and immediately inserted in the hot injection port of the GC, where the analytes were thermally desorbed at 150 ºC for 6 min. During the introduction of analytes, the split valve was kept closed.
GC Operating Conditions
The column temperature was initially set at 55˚C for 1 min, then increased to 75˚C at the rate of 5˚C.min-1 and held
for 7 min. Nitrogen was used as the carrier and make-up gas, and flow rates were 1.0 mL.min-1 and 45 mL.min-1,
respectively. Temperatures of the injection port and detector were set at 150 ˚C and 250 ˚C, respectively. Injections were carried out in splitless mode.
RESULTS AND DISCUSSION
Fiber Structure and Composition
The components of the proposed fiber were:
1. Copper wire was used as a mechanically durable support to hold the hollow fiber membranes. 2. Hollow fiber membranes with a porous structure for loading IL.
3. Sol-gel network to fix IL in hollow fiber pores. 4. IL as liquid separation media.
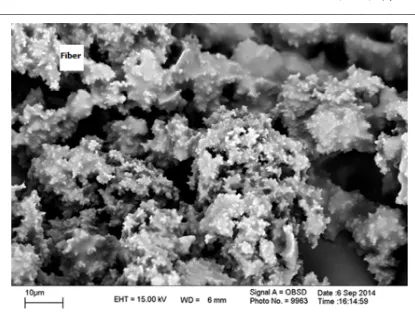
Use of hollow fiber membranes as fiber coating was reported previously[22]. Results showed good extraction ability of hollow fiber membrane due to its porous structure but weak ability of it in retaining BTEX is a major disadvantage. It isn’t able to retain the analytes more than 2 minutes. In order to solve this problem, incorporating IL as a green separation medium in porous structure of hollow fiber using sol-gel formulation was considered. Comparative results between these two fibers (hollow fiber and IL-loaded hollow fiber) shows that extraction time was increased from 2 min to 40 min and the analytes weren’t leave the fiber at room temperature. Morphological studies on fiber surface were performed using scanning electron microscopy (SEM) and were presented in Figure. 2. SPME fibers are exposed to the hot injection port of the GC. So, thermal stability of them must be studied. The backbone of the proposed fiber is polypropylene (melting point 160-170 ºC). According to the results of thermogravimetric studies (Figure 3-a, b and c) at 150 ºC amount of converted hollow fiber was 7.80%. In the case of IL loaded hollow fiber and sol-gel based IL loaded hollow fiber amount of conversion were 1.99% and 1.28%, respectively. Results indicate significant increase in thermal stability of the proposed fiber.
Optimization of the SPME process for water samples
Because of the sufficient volatilities of the studied compounds, the headspace extraction method was selected for this study.
Selection of microextraction temperature and time
analytes between the sample and the headspace and partitioning of them between the headspace and the fiber are two equilibriums involve in headspace microextraction process. Microextraction was performed at 10, 20, 30, 40, 50, 60 and 70˚C. (Figure. 4-a) shows that 20 ± 1 ˚C is the best extraction temperature, so it was selected for further studies.
Distribution equilibrium of the analytes seriously depends on exposure time of the fiber to the samples, it is a key parameter for better extraction. For this investigation, extractions were performed at different times ranging from 10 to 50 min. Results (Figure 4-b) showed that extraction equilibrium was achieved in 40 min.
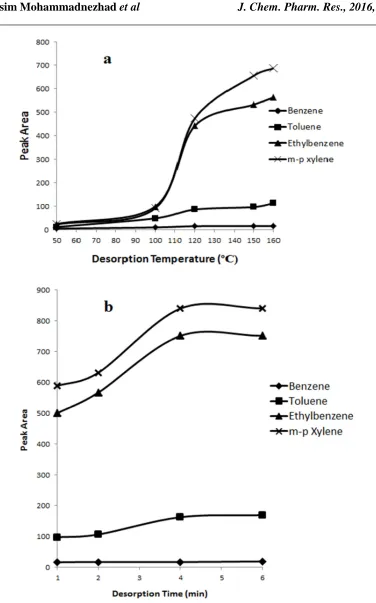
Selection of desorption temperature and time
Analytes were introduced to GC via SPME by thermal desorption in the injection port. Complete transfer of the analytes needs selection of the optimum desorption temperature and time for fiber duration in the injection port. Desorption temperature was varied within a range of 50-160˚C. Higher temperatures were not examined due to melting point of polypropylene (170˚C). Desorption times varied from 1 to 6 min. 150˚C and 6 minutes were selected as the best desorption temperature and time, respectively (Figure. 5-a, 5-b).
Effect of ionic strength on microextraction efficiency
Decreasing aqueous solubility of organic compounds due to increasing ionic strength in solution by dissolving inorganic salts is known as salting out. Salting out, is generally used for increasing extraction yield in sample preparation methods. But this phenomenon doesn’t affect extraction efficiency positively, all the time. Figure 6 shows that salt addition has negative effect on amount of extracted BTEX.
This result could be related to thehigh vapor pressure of BTEX at the headspace of the sample at salt-less condition
and equilibrium establishment between headspace and the fiber. So, according to the Le Chatelier's principle enhanced amount of BTEX in the headspace phase due to salting out, affects distribution equilibrium and decreases extraction yield.
Effect of sample agitation on amount of extracted analytes
Another parameter which affects extraction efficiency is sample agitation, the degree of which majorly affected the transfer of studied compounds into the extracting phase. To examine this, we set our stirrer on different speeds (400 – 1000 rpm), and results indicated that the best extraction occurred at 1000 rpm.
Analytical merits of the proposed method
Analytical merits of the proposed method for water samples were studied. The results are summarized in Table 1.
High correlation coefficients (0.9922-0.9943) and low detection limits (0.04-0.15 µg L-1) in comparison with EPA
regulations (benzene, 5.0; toluene, 1000; ethylbenzene, 700; xylene isomers, 10000 µg L-1) made the proposed
method suitable for the ultra-trace determination of BTEX.
In order to evaluate the precision of the method, five replicate determinations were carried out using a single fiber, and the relative standard deviations were calculated (Table 1). The results showed that the RSD% values of the method range from (1.22-4.88%), which indicates that the proposed method is repeatable. Five fibers prepared using identical processes were examined to evaluate fiber reproducibility. The RSD% values (1.58-5.36%) presented in Table 1 indicate the reproducibility of the fiber.
Monitoring of BTEX in the environmental water samples
Figure 4 (a) Effect of extraction temperature on amount of extracted analytes. Experimental conditions: concentration, 50 µgL-1;
extraction time, 50 min; saltless. (b) Effect of extraction time on amount of extracted analytes from water samples. Experimental
[image:8.595.105.463.72.665.2]Figure 5 (a) Effect of desorption temperature on amount of desorbed analytes. Experimental conditions: concentration, 50 µgL-1;
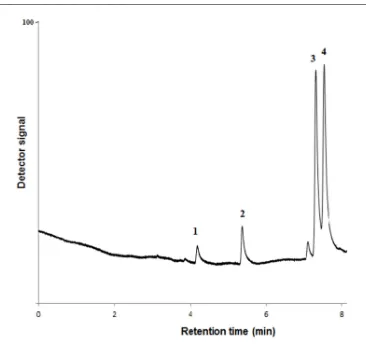
[image:9.595.85.461.71.674.2]Figure 8 : SPME-GC chromatogram of well water (1, benzene; 2, toluene; 3, ethylbenzene; 4, m,p-xylene)
Table 1. Analytical merits of the proposed method
Compound r LDRa LODa Repeatabilityb Reproducibilityc
Benzene 0.9943 0.30-100 0.15 4.88 5.36
Toluene 0.9936 0.30-100 0.15 1.22 1.58
Ethyl benzene 0.9922 0.10-100 0.04 3.40 5.20
m,p-xylene 0.9922 0.10-100 0.04 4.26 3.40
a
LDR (Linear dynamic range) and LOD (Limit of detection), µg L-1
b RSD%, relative standard deviations for 5 determinations, n=5
c RSD%, relative standard deviations for 5 identical fiber, n=5
Table 2. Results of real samples analysis
Compound Well Water
̅± SDa (µgL-1)
River water
̅± SD(µgL-1)
Benzene 0.50±0.02 NDb
Toluene 0.82±0.01 0.59±0.01
Ethyl benzene 4.71±0.16 ND
m,p-xylene 5.11±0.21 8.11±0.32
a Standard deviation, n=4 b Not detected
CONCLUSION
characteristics of ILs in sol-gel matrix alongside with high mechanical and thermal durability provide a novel SPME fiber for the extraction of organic compounds. The proposed fiber was successfully used in environmental analysis of aromatic hydrocarbons as hazardous pollutants.
Acknowledgements
Author is tank full from ashkan shomali for his helps in this work. .
REFERENCES
[1] CL Arthur; JPawliszyn; Anal.Chem,1990,62 , 2145-2148.
[2] AA Matin; P Biparva; H Amanzadeh; K Farhadi.. Talanta , 2013,103 , 207-213.
[3] AAMatin; P Biparva; M Gheshlaghi; K Farhadi; A Gheshlaghi. Chemosphere,2013, 93 , 1920 -1926. [4] J Feng; M Sun; Y Bu; C Luo.. J. Chromatogr. A,2015,1393 , 8-17.
[5] MMAbolghasemi; S Hassani; E Rafiee;V Yousefi.. J. Chromatogr. A ,2015,1381 , 48 -53. [6] YLi; H Xu. J. Chromatogr. A.1395 , 23 -31.
[7] YYang; Y Li; H Liu; X Wang;X Du.. J. Chromatogr. A. 2014, 1372 , 25-33 . [8] VKPonnusamy; JF Jen. J. Chromatogr. A..2011,1218 , 6861-6868.
[9] WL Liu; S Lirio;Y Yang; LT Wu; SY Hsiao; HY Huan. J. Chromatogr. A .2015,1395 , 32-40. [10] WSong; M Guo; Y Zhang; M Zhang; X Wang, X Du. J. Chromatogr. A .2015,1384 ,28-36. [11] M.J.Earle; K.R. Seddon.Pure Appl. Chem.,2000,72, 1391-1398.
[12] A. Kumar; S.S. Pawar.. J. Mol. Catal. A: Chem.,2004,208 ,33.
[13] AVidis; CA Ohlin;G Laurenczy;E Kusters; G Sedelmeier; P Dyson. J. Adv. Synth. Catal.,2005 347,266 . [14] D Han; KH Row. Molecules,2010,15 , 2405-2406.
[15] E.Stanisz; J. Werner; A Zgola-Grzeskowiak. TRAC-Trend. Anal. Chem,2014,61, 54-66. [16] EM Martinis; P Berton; RG Wuilloud.TRAC-Trend. Anal. Chem.,2014,60 , 54-70.
[17] EAguilera-Herrador, RLucena, S Cardenas, MValcarcel. TRAC-Trend Anal. Chem.,2010 ,29 ,602-616. [18] TD Ho, AJ Canestraro, JL Anderson. Anal. Chim. Acta.2011, 695 , 18-43.
[19] HYu; TD Ho; JL Anderson.TRAC-Trend Anal. Chem.,2013,45 , 219-233.
[20] J.Lee; HKLee; KERasmussen; S. Pedersen-Bjergaard. Anal. Chim. Acta,2008,624 , 253-268. [21] D Ge; H.K.Lee. J. Chromatogr. A, 2012,1229 ,1-5.
[22] MA Farajzadeh, AAMatin.. Chromatographia,2008, 68 , 443-446
[23] AAMatin; P Biparva; M Gheshlaghi. J. Chromatogr. A ,2014, 1374 , 50-57.
[24] Health effect information, BTEX; Oregon department of human services, February 1994. [25] BTEX; Bureau of environmental health, Health assessment section, December, 2014.
[26] J. Irwin, M. Van Mouweric, L. Stevens, M. Dubler seese, W. Basham, Environmental contaminants encyclopedia, entry for BTEX and BTEX compounds, July, 1997.
[27] A Sarafraz-Yazdi; HVatani. J. Chromatogr. A .2013, 1300 , 104-111. [28] ASarafraz-Yazdi;A,HAmiri;ZEshaghi. Chemosphere,2008,71 ,671-676.
[29] JCFlorez Menendez; ML Fernandez Sanchez;JE Sanchez Uria; E Fernandez Martinez; A Sanz-Medel.Anal.
Chim. Acta,2000, 415 , 9-20.
![Figure 1 Spectroscopic Characterization of synthesized IL, [VMIM][PF6];(a) FT-IR spectra (b) 1H-NMR spectra](https://thumb-us.123doks.com/thumbv2/123dok_us/8746348.890852/5.595.91.493.102.668/figure-spectroscopic-characterization-synthesized-vmim-spectra-nmr-spectra.webp)