i
DEVELOPMENT OF BRAIN COMPUTER INTERFACE (BCI) SYSTEM FOR INTEGRATION WITH FUNCTIONAL ELECTRICAL STIMULATION (FES)
APPLICATION
ROSNEE BINTI AHAD
A project report submitted in partial
fulfillment of the requirement for the award of the Degree of Master of Electrical Engineering
Faculty of Electrical and Electronic Engineering Universiti Tun Hussein Onn Malaysia
ABSTRACT
ABSTRAK
CONTENTS
CHAPTER 1
TITLE
DECLARATION
DEDICATION
ACKNOWLEDGEMENT
ABSTRACT
CONTENTS
LIST OF TABLES
LIST OF FIGURES
LIST OF SYMBOLS AND ABBREVIATIONS
LIST OF APPENDICES
INTRODUCTION
i
ii
iii
iv
v
vii
xii
xiii
xvi
xvii
1
1.1 Background Of The Study 1
1.2 Problem Statement 3
1.3 Aim and Objective of Study 3
1.4 Scope of Study 4
1.5 Term Definition 4
1.5.1 BCI 4
1.5.3 FES 5
1.5.4 Paraplegic 5
1.6 Conclusion 5
CHAPTER 2 LITERATURE REVIEW 6
2.1 Introduction 6
2.2 Paralysis 6
2.3 Nervous System 8
2.3.1 Neural Activities 9
2.4 Brain 10
2.4.1 Brain Rhythm 11
2.4.2 Electrode Placement System 12
2.5 BCI System 14
2.5.1 Signal Acquisition 2.5.2 Signal Processing
14 15 2.5.2.1 Feature Extraction 15 2.5.2.2 Translation Algorithm 17
2.5.3 The Output Device 17
2.6 Classification 17
2.6.1 ANN
2.6.2 Back Propagation 2.7 Brain Imaging Techniques
18 19 20
2.7.1 EEG 20
2.7.1.2 EEG Artifacts 21
2.7.2 MRI 22
2.7.3 CT 23
2.7.4 Compare of EEG, MRI and CT 24 2.8 Arduino
2.8.1 Arduino Mega2560 2.9 Hardware Circuit
2.9.1 Amplifier
2.9.2 Full Wave Bridge Rectifier 2.10 Previous Study
25 26 27 27 28 29
CHAPTER 3 METHODOLOGY 31
3.1 Introduction 31
3.2 Subject
3.3 Operation Framework
31 32
3.4 Data Gathering 33
3.5 Design And Develop for the Offline System
3.5.1 Data Acquisition 35
3.5.1.1 Electrode Placement 35 3.5.1.2 EEG Raw Signal
3.5.1.3 Dual Bio Amp 3.5.1.4 PowerLab
36 37 38
3.5.2 Pre-processing 38
3.5.4 Classification 3.5.5 Data Analysis 3.5.6 Display
3.6 Design And Develop for the Real time System 3.6.1 Hardware Connection
3.6.2 Amplifier
3.6.3 Full Wave Bridge Rectifier 3.6.4 Arduino board to LED
43 45 45 47 50 51 52 53 CHAPTER 4 CHAPTER 5
PROJECT ANALYSIS (OFFLNE) 4.1 Introduction
4.2 Data Analysis 4.3 Software Analysis
4.3.1 Neural Network (NN) 4.3.2 LabChart Analysis 4.4 Hardware and Coding Analysis 4.4.1 LED OFF
4.4.2 LED ON
PROJECT ANALYSIS (REAL TIME)
5.1 Introduction 5.2 Real Time Design 5.3 Result And Analysis 5.3.1 Amplifier 5.3.2 Rectifier
CHAPTER 6
5.3.3 Matlab Simulink 5.3.4 LED Display
DISCUSSION, CONCLUSION AND
RECOMMENDATION
6.1 Introduction 6.2 Discussion
6.2.1 The brain signal for quadriceps muscle activity such as swinging motion
6.2.2 The features that are most suitable to disti nguish the swinging and static
6.2.3 Design and develop an amplifier circuit to amplify the EEG signals
6.2.4 Develop a mapping mechanism between BCI for Functional Electrical
Stimulation (FES) application 6.3 Conclusion
6.4 Recommendation REFERENCES
APPENDICES
VITA
68 69
70
70 70
70
71
71
72
73 73 75
LIST OF TABLES
2.1 Types of Paralysis and Part of Limb 7
2.2 Frequency bands and their relations, of the human brain wave activity
12
2.3 Identified the letter of 10-20 EEG electrodes 13
2.4 Comparison between EEG, MRI and CT scan 24
2.5 3.1 3.2 3.3 3.4 3.5 3.6 3.7 4.1 4.2 4.3 4.4 5.1 5.2
Comparison the previous Study Part of PowerLab and the function Table Frequency Range
Statistics Features
Extraction of nine features in Data Pad Samples of feature extraction in Excel LED display
Arduino pin function
The relationship value between leg movement and features extraction
Relationship between leg motion and features Input data
Input and output Matlab coding Amplifier Gain for Swing Movement The output LED display
LIST OF FIGURES
1.1 2.1
The overall system and the area of study Area of Paralysis due to Spinal Cord Injury
2 7
2.2 Nervous System 8
2.3 2.4
Structure of a neuron
Sensory neuron and motor neuron system
9 10
2.5 Basic functional brain map 11
2.6 Labels for points according to 10-20 electrode placement system
12
2.7 Basic design and operation of any BCI system 14
2.8 Bandpass filter 16
2.9 Multilayered perceptron 19
2.10 Electrode cap with electrodes placed after 10-20 electrode placement system
20
2.11 The EEG signal contaminated with noise and eye blink artifacts
22
2.12 MRI Scanner Cutaway 23
2.13 2.14 2.15 2.16
CT Scanner
Arduino Mega2560 board
Pin configuration LT1028 op-amp
Full-wave Rectifier with Smoothing Capacitor
23 26 28 28
3.1 Flow Chart Of The Overall Project 32
3.2 Flow Chart Offline System Design 34
3.5 Electrode position at the scalp 36
3.6 EEG signal before amplified 37
3.7 An EEG signal is a combination of brain
activity, reference signal and noise 39
3.8 PowerLab Connection 39
3.9 3.10 3.11 3.12 3.13 3.14 3.15 3.16 3.17 3.18 3.19 3.20 3.21 3.22 3.23 3.24 3.25 3.26 4.1 4.2 4.3 4.4 4.5 4.6
Digital Filter Toolbox The Entire Signal
Pre-processing for Raw signal to Beta signal Data pad column setup for statistics
Artificial neural network architecture Artificial neural network block diagram Training, validation and testing percentage Number of hidden neurons
Arduino Board Hardware System
Flow Chart Real time System Design Hardware circuit connection
Amplifier circuit Amplifier connection Amplified Gain
Full wave Bridge Rectifier Circuit Full wave Bridge Rectifier Connection Arduino board to LED connection Pattern recognition NN
Performance validation result Confusion Matrix
Receiver Operating Characteristic
Beta wave, FFT and Spectrogram for Static Leg
4.7 4.8 4.9 4.10 4.11 4.12 5.1 5.2 5.3 5.4
5.5 5.6
Signal leg and hand motion Coding for input data Static coding process LED Display for Static Swing coding process LED Display for Swing
Block Diagram Real Time Design Output signal Amplifier 2
Input and Output rectifier Signal
Voltage ripple for the dc voltage output from the rectifier
Software Simulink Block Hardware Simulink Block
61 62 63 63 64 64 65 66 67
LIST OF SYMBOLS AND ABBREVIATIONS
BCI - Brain Computer Interface SCI - Spinal Cord Injuries EEG - Electroencephalography CT - Computer Tomography MRI - Magnetic Resonance Imaging
fMRI - Functional Magnetic Resonance Imaging PET - Positron Emission Tomography
SPECT - And Single Photon Emission Computed Tomography
FES - Functional Electrical Stimulation AR - Artifact Removal
PSD - Power Spectral Density MMI - Mind-Machine Interface BMI - Brain–Machine Interface CNS - Central Nervous System PNS - Peripheral Nervous System AP - Action Potential
ANN - Artificial Neural Network ERP - Event Related Potential
LIST OF APPENDICES
APPENDIX TITLE
A B C
D
Gantt Chart for PS Matlab Coding
Equipments And Connections of Power Lab and Dual Bio Amp
Brain Beta Data Pad
81 83
CHAPTER 1
INTRODUCTION
1.1 Background Of The Study
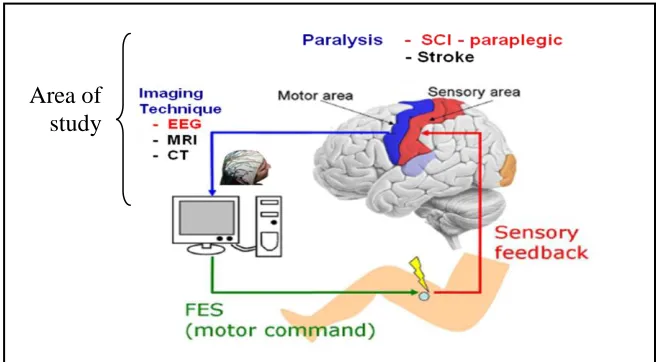
Brain Computer Interface (BCI) is a kind of communication tool that translate human’s intention to other devices. New developments in BCI have made it possible to use human thoughts in virtual environments (Wolpaw JR et al, 2002). BCI researches have many kind of aspects, and selection of the signal source is one of the most important issues (Saeid Sanei, 2007). BCIs create a novel communication channel from the brain to an output device bypassing conventional motor output pathways of nerves and muscles (Nizan Friedman, 2010). The goal of a BCI system is to detect and relate patterns in brain signals to the subject’s thoughts and intentions. BCI has been proved to be a potential method to link the brain and the outward environment directly (Ehsan Tarkesh Esfahani et al, 2011). BCI system is mainly applied for a severely motor disorder patients or call paralysis like spinal cord injuries (SCI), strokes and epilepsy (NHS Choices news, 2013). When a person suffers a SCI, information travelling along the spinal nerves below the level of injury will be either completely or partially cut off from the brain, resulting in Quadriplegia (Tetraplegia) or Paraplegia. The spinal cord is part of the central nervous system. Its main function is to transmit signals to and from the brain and body (Apparelyzed NSI Organisation, 2013). To get the probable signal source must be to use the imaging technique.
researches use electroencephalography (EEG) as a probable signal source, because of the noninvasiveness and simplicity (Nizan Friedman, 2010). Currently, noninvasive BCIs are mostly based on recording EEG signals by placing electrodes on the scalp (Wolpaw JR et al, 2006). EEG is a medical imaging technique that reads scalp electrical activity generated by brain structures. The EEG is defined as electrical activity of an alternating type recorded from the scalp surface after being picked up by metal electrodes and conductive media (M. Teplan, 2002). Several recent prototypes already enable users to navigate in virtual scenes, manipulate virtual objects or play games just by means of their cerebral activity (Wolpaw JR et al, 2006).
EEG signal will be process by functional electrical stimulation (FES) system before applied to the leg muscles. FES and motor imagery have been extensively applied in the rehabilitation training of stroke patients (J.E.Sillivan, 2007). The idea that FES therapy triggered by the active intention possibly help the stroke patients to recovery by combining the agitation from the central nervous system (CNS), the corresponding muscle stimulation and the afferet sensory feedback (Fei Meng, 2008). Figure 1.1 below shows the system that from the brain signal using EEG technique and applied to FES system and the patient muscles. In the study is an analysis for the system before to applied the FES system. In this study provide two situation are in offline and realtime.
[image:16.612.165.494.501.682.2]
Figure 1.1 : The overall system and the area of study Area of
1.2 Problem Statement
Spinal cord injury (SCI) or stroke is the main cause of disability of human especially paralyze (Mitsuru Takahashi et. al, 2008). The number of paralyze patients increasing every year, but no solid statistics for this category of people in Malaysia and internationally, except US where they have many Non-Profit Societies for this category
of people (Anita Ahmad, 2006). This SCI has created function deficits in motor control that will disturb the people daily activities. Regarding the SCI/paralyze patients, it appear that paralyze patient cannot be static and need to do the simple activity or exercise to avoid the more serious health problem as diabetes, loss in function in mobility and other major problems due to passive activities (Carmen Moreno, 1995). On the other hand, functional electrical stimulation (FES) and motor imagery have been extensively applied in the rehabilitation training of the patients (Fei Meng et. al, 2008). However there is still lack of recovery method by the combination of BCI and FES system.
Therefore the in this study the recovery method that combines BCI and FES systems will be investigated. In this method EEG signals will be used to detect a patient’s motor intention to activate a paralyzed limb. FES stimulates the corresponding muscles, which return sensory feedback to the brain creating a pseudo motor-loop. This system is expected to accelerate motor recovery by enhancing motor learning and help develop an effective rehabilitation system for severely affected the patients (Mitsuru Takahashi et. al, 2008).
1.3 Aim and Objectives of Study
Development of brain computer interface (BCI) system for integration with functional electrical stimulation (FES) application is the aim of this study. In order to achive this aim, the objectives of this study are formulated as follows :
(i) To obtain the brain signal for quadriceps muscle activity such as swinging motion.
(ii) To select the features that are most suitable to distinguish the swinging leg and static.
(iv) To develop a mapping mechanism between BCI for Functional Electrical Stimulation (FES) application.
1.4 Scope of study
The scopes of this study are includes: (i) Sampels
At least three normal sampels involve in this study. (ii) Electroencephalogram (EEG) method
This study will use electroencephalography (EEG) recordings as one of the BCI method to get the brain signal.
(iii) Simulate the signal using MATLAB Simulink and coding
Some part in the feature extraction stage as classified using MATLAB to approve the signal.
1.5 Term Definition
Definition of the term is made to define or explain the terms used in this project. These terms need to be clarified to facilitate understanding of the project. Some of these terms are:
1.5.1 BCI
1.5.2 EEG
Electroencephalography (EEG) is the recording of electrical activity along the scalp. EEG measures voltage fluctuations resulting from ionic current flows within the neurons of the brain.
1.5.3 FES
Functional electrical stimulation (FES) is a technique that uses electrical currents to activate nerves innervating extremities affected by paralysis resulting from spinal cord injury (SCI), head injury, stroke and other neurological disorders.
1.5.4 Paraplegic
A person who has paraplegia suffering complete paralysis of the lower half of the body usually resulting from damage to the spinal cord.
1.6 Conclusion
CHAPTER 2
LITERATURE REVIEW
2.1 Introduction
This chapter explains the background for this project, and identifies the main research questions and methods to bring clarity and define the projects focus, based on lessons learned from earlier efforts and new anticipations. To facilitate the process of building this project, case studies have been done on many aspects of the study related to body system, paralysis, brain imaging technique as EEG, MRI or CT that was used before, to choose the most appropriate and reasonable. The BCI system was also studied to understand the techniques and find features that can be used for the project. This will give more information about the technology used or to further increased use and to overcome the problems they have faced before. It is hope that this study will make the planned project will be successful and higher accuracy.
2.2 Paralysis
Paralysis is loss of the ability to move one or more muscles. It may be associated with loss of feeling and other bodily functions. Paralysis is not usually caused by problems with the muscles themselves, but by problems with the nerves or spinal cord that the brain uses to control muscles. Therefore, a person with paralysis will usually have some form of nerve damage (NHS Choices news, 2013).
spine and helps control the body's muscles) and multiple sclerosis (NHS Choices news, 2013).
Table 2.1 : Types of Paralysis and Part of Limb (NHS Choices news, 2013)
Paralysis Type Part of Limb
monoplegia one limb is paralysed
hemiplegia the arm and leg on one side of the body are paralysed
paraplegia both legs and sometimes the pelvis and some of the lower
body are paralysed
tetraplegia both the arms and legs are paralysed (also known as quadriplegia)
When a person suffers a spinal cord injury (SCI), information travelling along the spinal nerves below the level of injury will be either completely or partially cut off from the brain, resulting in Quadriplegia (Tetraplegia) or Paraplegia (Apparelyzed NSI Organisation, 2013). The spinal cord is part of the central nervous system. Its main function is to transmit signals to and from the brain and body (NHS Choices news, 2013). Figure 2.1,shows the area and type of paralysis due to SCI.
The body will still be trying to send messages from below the level of injury to the brain known as sensory messages, and the brain will still be trying to send messages downwards to the muscles in the body, known as motor messages. These messages however, will be blocked by the damage in the spinal cord at the level of injury. Nerves joining the spinal cord above the level of injury will be unaffected and continue to work as normal (Apparelyzed NSI Organisation, 2013).
[image:21.612.207.449.520.672.2]2.3 Nervous System
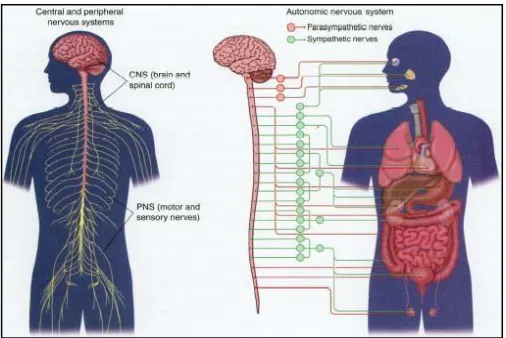
The nervous system composed of nerve cells or neurons that communicate with each other and with other cells in the body (Mark Rhothery biology web, PATTS, 2001). It includes the central nervous system (CNS), which is made up of the brain and spinal cord, and the peripheral nervous system (PNS), which includes all of the nerves and other nervous structures in the rest of the body (Eric Chudler, 2013). Figure 2.2, shows the nervous system in human body. PNS is subdivided into autonomic nervous system (control smooth and visceral muscles) and somatic nervous system (control skeletal muscle) (PATTS, 2001).
[image:22.612.198.451.416.585.2]The nervous system is a network of fibers that starts in the brain and spinal cord and branches out to the rest of the body, with each branch getting progressively smaller. The CNS includes the brain, which is encased in the skull, and the spinal cord, which is a long tube that extends. These nerves receive information from body tissues and the outside world and pass it along to the brain and spinal cord. These nerves also carry the signals from the CNS to make body parts move or function (Saeid Sanei et al, 2007).
Figure 2. 2 : Nervous System (Eric Chudler, 2013)
2.3.1 Neural Activities
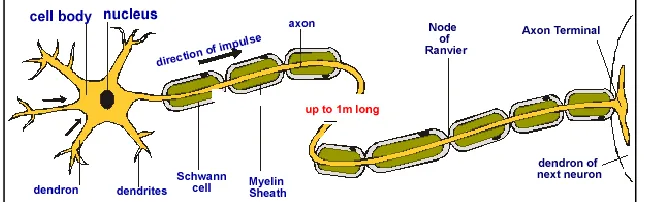
The CNS generally consists of nerve cells and glia cells, which are located between neurons. Each nerve cell has three parts consists of axons, dendrites and cell bodies (Saeid Sanei et al, 2007, PATTS, 2001). In the human brain each nerve is connected to approximately 10,000 other nerves, mostly through dendritic connections (Saeid Sanei et al, 2007).
[image:23.612.164.488.406.507.2]A neuron has a cell body containing the nukleus with extensions leading off it (PATTS, 2001). Numerous dendrons and dendrites provide a large surface area for connecting with other neurons, and carry nerve impulses towards the cell body. A single long axon carries the nerve impulse away from the cell body. The axon is only 10µm in diameter but can be up to 4m in length in a large animal. Nerve impulse can be passed from the axon of one neuron to the dendron of another at a synapse (Mark Rothery biology web). Figure 2.3, shows the structure of a neuron. Humans have three types of neuron as sensory neurons, motor neurons and inter neurons (Saeid Sanei et al, 2007)
Figure 2.3 : Structure of a neuron (Mark Rothery biology web)
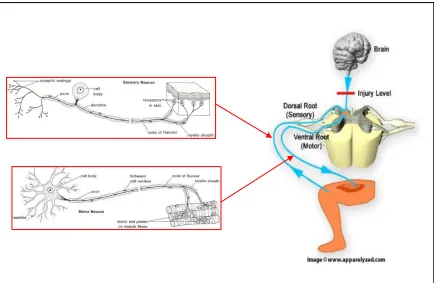
from the brain or spinal cord to the muscles and organs. Figure 2.4 shows the situation.
Figure 2.4 : Sensory neuron and motor neuron system
2.4 Brain
The human head consists of different layers including the scalp, skull, brain and many other thin layers between (Saeid Sanei et al, 2007). The human brain is the site of the major coordination in the nervous system. It contains around 1010 (10 billion) neurons, each making thousands of connections to others, so the number of pathways through the brain is vast. Different regions of the brain can be identified by their appearance, and it turns out that each region has a different role (Saeid Sanei et al, 2007, Mark Rothery biology web).
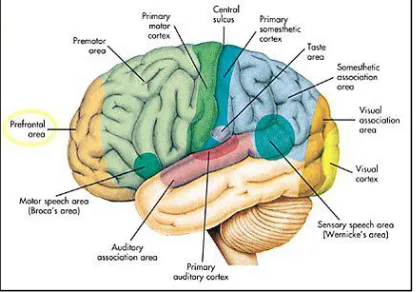
sense organ (visual, auditory, smell, skin, etc.). Motor areas, which organize and send motor output to skeletal muscles. The motor neurons originate in these areas but are usually processed by the cerebellum before going to the muscles. So the cortex may decide to walk up stairs, but the cerebellum will organize exactly which muscle cells to contract and which to relax. Association areas, which are involved in higher processing (Mark Rothery biology web). Figure 2.5, shows the basic functional brain map.
Figure 2.5 : Basic functional brain map (Universe-review.ca, n.d.)
2.4.1 Brain Rhythm
Table 2.2 : Frequency bands and their relations, of the human brain wave activity (Newbrainnewworld.com, 2013, Saeid Sanei et al, 2007, Andreas Larsen, 2011)
Rhytm Unconscious Conscious
Delta () Theta () Alpha () Beta ()
Signal Pattern Frequency
Component 0.5 to 3.5 Hz 3.5 to 7.5 Hz
1 (7.5 to 9.25 Hz)
2 (10 to 11.75 Hz)
1 (13 to 16.75 Hz)
2 (17 to 29.75 Hz)
Amplitude 100 μV Child: 20 μV Adult: 10 μV
Baby: 20 μV Child: 75 μV Adult: 50 μV
10 to 20 μV
Main Scalp Area
Front
Temporal
back of the head and in the frontal
lobe
1 (central and frontal)
2 (Both sides of central) Human Condition Deep Sleep Dreaming Coma Feeling Trace states Sleepy Thinking Relaxed Closed Eyes Alert Concentration Opened Eyes Motion
2.4.2 Electrode Placement System
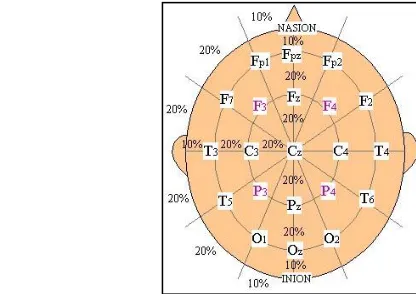
[image:26.612.168.376.510.657.2]The International Federation of Societies for Electroencephalography and Clinical Neurophysiology has recommended the conventional electrode setting for 21 electrodes (including the earlobe electrodes) as in Figure 2.6 (Saeid Sanei et al, 2007, M. Teplan, 2002).
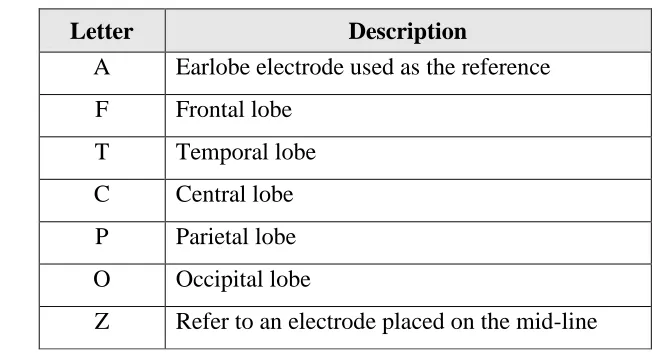
Even numbered electrodes are placed on the right side of the head, and odd are placed on the left. The electrodes in this arrangement are placed along a bisecting line drawn from the nose (nasion) to the back of the head (inion), first at the position 10% of the distance along the line, then at 20% intervals (Saeid Sanei et al, 2007). Electrode placements are labeled according adjacent brain areas as in Table 2.3 (M. Teplan, 2002). The earlobe electrodes called A1 and A2, connected respectively to the left or right earlobes are used as the reference electrodes (Saeid Sanei et al, 2007, M. Teplan, 2002).
Table 2.3 : Identified the letter of 10-20 EEG electrodes (M. Teplan, 2002)
Letter Description
A Earlobe electrode used as the reference F Frontal lobe
T Temporal lobe C Central lobe P Parietal lobe O Occipital lobe
Z Refer to an electrode placed on the mid-line
coherences between the sources, etc. (M. Teplan, 2002). The general configuration is called montage (Saeid Sanei et al, 2007, M. Teplan, 2002).
2.5 BCI System
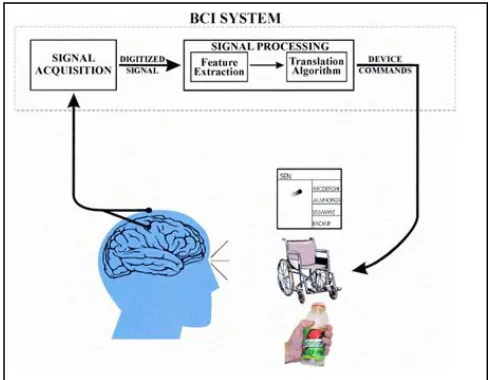
[image:28.612.191.435.244.434.2]Like any communication or control system, a BCI has input, output, components that translate input into output, and a protocol that determines the onset, offset, and timing of operation. Figure 2.7, shows these elements and their principal interactions.
Figure 2.7 : Basic design and operation of any BCI system (Walpow JR et al, 2002)
2.5.1 Signal Acquisition
In the BCIs the input is EEG recorded from the brain are acquired by electrodes on the scalp or the surface of the brain or neuronal activity recorded within the brain (Walpow JR et al, 2002). In the signal acquisition part of BCI operation are the recording electrodes, amplified and the signal is the digitized for analysis (Saeid Sanei et al, 2007). Recording sites for electrophysiological signals used by brain– computer interface (BCI) systems. Electroencephalographic activity (EEG) is recorded by electrodes on the scalp (Walpow JR et al, 2006). .
BCI, partially invasive BCI and non-invasive BCI. The familiar is non-invasive BCI because non-invasive technique, relatively inexpensive and can be tested on a large human population. The Electrode is placed on surface of scalp and measures
electroencephalogram (EEG) signals (Nizan Friedman, 2010).
2.5.2 Signal Processing
In this stage is to conversion of the raw signal EEG data into a useful device command. This data is usually not clean so some preprocessing steps are needed.
2.5.2.1 Feature Extraction
Feature extraction is the process of extracting useful information from the EEG signals. Features are characteristics of signal that are able to distinguish between motion method.
Due to the non-linearity and non-stationary nature of the EEG signal, the classical methods based on Fourier transform (FT) are, in general, not efficient for feature extraction because they obtained features do not provide any time domain information, these features do not analyze the time-varying spectral content of the signals. Typically, EEG is analyzed using Fast Fourier Transform (FFT) because EEG signals are often quantified based on frequency domain characteristics.
However, Anderson and Sijercic (1996) claimed that EEG signals cannot be considered as stationary even under short time duration, since it can exhibit considerable short-term non-stationary signals. Because of this reason, instead of using Fast Fourier Transform (FFT), Wavelet Transform (WT) method more suitable to use to extract the EEG signals. It is because Wavelet Transform (WT) method is using to analyze non-stationary signal and it can capture both frequency and location information. But, FFT based spectral analysis required the signals is to be stationary (Muruggapan, M., 2010).
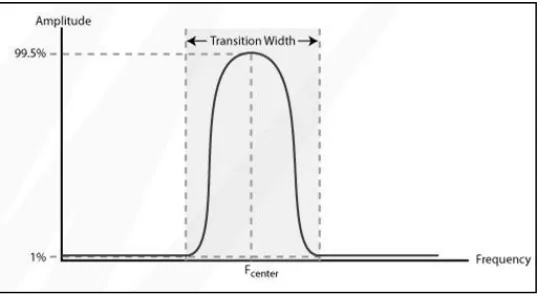
frequency components. In EEG currently rarely study frequencies above 90 Hz which correspond to the Gamma range (Nizan Friedman, 2010). Band pass filter removes all frequencies outside f 1 - f 2 (Used often in EEG measurements) (JA Putman, 2007). This analysis extracts the signal features that encode the user's messages or commands.
[image:30.612.206.475.309.457.2]Figure 2.8,,shown the narrow band-pass filters remove all except a narrow range of frequencies. The centre frequency (Hz) is the mid-point of the range of frequencies which are passed by the filter. Transition width - the width between the two frequencies where the output amplitude rises above 1% of the input amplitude. The default value is automatically adjusted depending on sampling rate and centre frequency (ADinstruments, 2012).
Figure 2.8 : Bandpass filter (Wan Afif, 2013)
2.5.2.2 Translation Algorithm
The first part of signal processing simply extracts specific signal features. The next stage, the translation algorithm, translates these signal features into device commands-orders that carry out the user's intent. This algorithm might use linear methods (e.g. classical statistical analyses) or nonlinear methods (e.g. neural networks). Whatever its nature, each algorithm changes independent variables (i.e. signal features) into dependent variables (i.e. device control commands).
Like activity in the brain’s conventional neuromuscular communication and control channels, BCI signal features will be affected by the device commands they are translated into: the results of BCI operation will affect future BCI input. In the most desirable case, the brain will modify signal features so as to improve BCI operation (Walpow JR et al, 2002).
2.5.3 The Output Device
The overt command or control functions that are administered by the BCI system. These outputs can range from word processing and communication to higher levels of control such as driving a wheel chair or controlling a prosthetic limb. All of these elements work in concert to give the user control over his or her environment (Saeid Sanei et al, 2007).
2.6 Classification
After extracting the desired features, a classifier is needed to find the movement signal. A classifier is a system that divides some data into different classes and is able to learn the relationship between the features and the movement that belongs to that part of the EEG signal.
et al., 2007). The most popular in BCI research are neural networks and is the chosen method to classify in this study.
2.6.1 Artificial neural network
Artificial Neural Networks (ANN) are nonlinear information (signal) processing devices. ANN is an information-processing paradigm that is inspired by the way biological nervous systems, such as the brain, process information (S.N. Sivanandam. et al., 2003).
Neural Network (NN) gained its knowledge from past experiences to deal with a problem and situation. NN take a solution before to build up the system in decision making neurons. NN which consist of three layers of neurons will learn through the adjustment between the weights and the associated layer. The answer to this network was compared with that required answer over and over during the training phase (Ariffuddin Joret et al., 2012).
In contrast, if the network has too many hidden nodes it will follow the noise in the data due to over-parameterization, leading to poor generalization for untrained data. With increasing number of hidden layers, training becomes excessively time-consuming. The most popular approach to finding the optimal number of hidden 16 layers is by trial and error (Basheer and Hajmeer, 2000; Fausett, 1994; Haykin, 1994). The basic building blocks of the ANN are:
i) Network architecture – the arrangement of neurons into layers and the pattern of connection within and in between layer. The number of layers in the net can be defined to be the number of layers of weighted interconnected links between the particular slabs of neurons.
ii) Setting the weights – The method of setting the value the weights enable the process of learning or training. The process of modifying the weights in the connections between network layers with the objective of achieving the expected output is called training a network.
response. The nonlinear activation functions are used in a multilayer net (S.N. Sivanandam. et al., 2003).
[image:33.612.190.443.258.410.2]The multilayer feed forward neural network is the workhorse of the Neural Network Toolbox software. It can be used for both function fitting and pattern recognition problems. The work flow for the general neural network design process has seven primary steps data collection, network creation, network configuration, weights and biases initialize, network training, network validation (post-training analysis) and network usage (Wan Afif bin Wan Anwar 2013). The multilayer perceptron for the three layer ANN shown in figure 2.9.
Figure 2.9: Multilayered perceptron (www.gopixpic.com)
2.6.2 Back Propagation
The back propagation (BP) training algorithm involves three stages the feed forward of the input training pattern, the calculation and back propagation of the associated weight error and the weight adjustments (C. R. Hema et al., 2007).
signals to propagate through the network, and read the output values (B. Sumathi, Dr. A. Santhakumaran, 2007).
2.7 Brain Imaging Techniques
Brain imaging techniques allow doctors and researchers to view activity or problems within the human brain, without invasive neurosurgery. There are a number of accepted, safe imaging techniques in use today in research facilities.
2.7.1 EEG
Electroencephalography (EEG) is an amplified recording of the waves of electrical activity that sweep across the brain’s surface. When brain cells (neurons) are activated, the synaptic currents are produced within dendrites (Saeid Sanei et al, 2007). These wave are measured by electrodes placed on the scalp (Mayoclinic.com, 2012). The resulting traces are known as an EEG and represent an electrical signal from a large number of neurons.
[image:34.612.244.417.526.657.2]EEGs are frequently used in experimentation because the process is non-invasive to the research subject. The EEG is capable of detecting changes in electrical activity in the brain on a millisecond-level. It is one of the few techniques available that has such high temporal resolution (M. Demitri, 2007). Figure 2.10, shows electrode cap with electrodes placed after 10-20 electrode placement system.
2.7.1.1 EEG Recording Technique
To define the good signal from the EEG system must be have the technique. EEG measurements employ recording system consisting of electrodes with conductive media, amplifiers with filters, A/D converter and recording device.
Electrodes read the signal from the head surface, amplifiers bring the microvolt signals into the range where they can be digitalized accurately, converter changes signals from analog to digital form, and personel computer (or other relevant device) stores and displays obtained data.
Scalp recordings of neuronal activity in the brain, identified as the EEG, allow measurement of potential changes over time in basic electric circuit conducting between signal (active) electrode and reference electrode (M. Teplan, 2002). Extra third electrode, called ground electrode, is needed for getting differential voltage by subtracting the same voltages showing at active and reference points. Minimal configuration for mono-channel EEG measurement consists of one active electrode, one (or two specially linked together) reference and one ground electrode. The multi-channel configurations can comprise up to 128 or 256 active electrodes.
2.7.1.2 EEG Artifacts
Since EEG signals are very weak (ranging from 1 to 100 V), they can easily be contaminated by other sources. An EEG signal that does not originate from the brain (Arthur C. Clarke, 2009) or the basic evaluation of the EEG traces belongs scanning for signal distortions is called an artifacts (M. Teplan, 2002). The complete removal of artifacts will also remove some useful information of EEG signals (Murugappan, M., Nagarajan, R. & Yaacob, S., 2010). Therefore, that is impossible to remove all the artifacts in EEG signals.
produce an artifact (Saeid Sanei, 2007, Arthur C. Clarke, 2009). Non-physiologic artifacts include 60 Hz interference from electric equipment, kinesiologic artifacts caused by body or electrode movements, and mechanical artifacts caused by body movement (Arthur C. Clarke, 2009). Figure 2.11, shows the EEG signal contaminated with noise and eye blink artifacts.
Figure 2.11 : The EEG signal contaminated with noise and eye blink artifacts (Arthur C. Clarke, 2009)
2.7.2 MRI
Magnetic Resonance Imaging (MRI) is a technique with high resolution that uses magnetic field and radio waves to produce computer-generated images that distinguish among different types of soft tissues, allows us to se structures in the brain (Mayoclinic.com, 2012).
Figure 2.12 : MRI Scanner Cutaway (Albert Wong, 2009)
2.7.3 CT
Computed tomography (CT) scanning builds up a picture of the brain based on the differential absorption of X-rays. During a CT scan the subject lies on a table that slides in and out of a hollow, cylindrical apparatus. An x-ray source rides on a ring around the inside of the tube, with its beam aimed at the subjects head. After passing through the head, the beam is sampled by one of the many detectors that line the machine’s circumference. Images made using x-rays depend on the absorption of the beam by the tissue it passes through. Bone and hard tissue absorb x-rays well, air and water absorb very little and soft tissue is somewhere in between. Thus, CT scans reveal the gross features of the brain but do not resolve its structure well (M. Demitri, 2007). Figure 2.13 shows example of CT scanner operate.
[image:37.612.181.443.524.674.2]
2.7.4 Compare of EEG, MRI and CT
[image:38.612.114.549.206.712.2]Table 2.4 shows comparison the characteristics for EEG, MRI and CT system to choose the better system in this study.
Table 2.4 : Comparison between EEG, MRI and CT scan (M. Teplan, 2002, Albert Wong, 2009)
Item EEG MRI CT scan
Definition - Electroencephalo graphy
- Magnetic
Resonance Imaging
- Computerized Tomography How to work - EEG analyzes
brain wave
functioning using electrical impulses generated by the neurons.
- Basically the MRI
scanner uses
magnetic fields and radio waves to create an image of the brain
- Combined a series of X-ray views taken from many different angles and computer processing to create cross-sectional
images of the bones and soft tissues inside the body.
What material to use
- Uses electrical impulses
- Uses magnetic fields and radio waves
- Use X-rays
(invisible radiation)
How strong - Amplitude of 0.5-100 microvolts and
a frequency
spectrum from 0.1 to 60 Hz.
- The Earth’s magnetic field is about 0.5 gauss (1 Tesla = 10,000 gauss). So MRI is about 60,000 times more powerful than the earth’s magnetic field.
REFERENCES
ADinstruments (2012). ADinstruments search. Retrieved on November 5, 2013, from
http://www.adinstruments.com
Albert Wong (2009), Epilepsy Awareness Program – MRI. Retrieved on December 04,
2013, from http://www.biomedresearches.com/root/pages/researches/epilepsy.
Anderson, C. W. & Sijercic, Z. (1996). Classification of EEG Signals From Four Subjects during Five Mental Tasks. Proceedings of the Conference on Engineering Applications in NeuralNetworks (EANN’96), (pp. 407-414).
Finland.
Andreas Larsen E. (2011). Classification of EEG Signals in a Brain-Computer Interface System. Norweigan University: Master Thesis.
Anita Ahmad (2006). Application of Tilt Sensor in Headset Operated Surveillance Camera Control System for People With Disabilities. Universiti Teknologi Malaysia. Penyelidikan.
Arduino (2014). Arduino Mega 2560. Retrieved December 01, 2014, from
http://arduino.cc/en/Main/arduinoBoardMega2560
Arduino (2014). Introduction. Retrieved December 01, 2014, from
http://arduino.cc/en/guide/introduction
Ariffuddin Joret, Siti Zuraidah Zainudin, Nor Ashidi Mat Isa, Jiwa Abdullah, Kamal Zuhairi Zamli, Muhammad Faiz Liew Abdullah, Asmarashid Ponniran (2012). Classification of Data Using Multilayered Perceptron Neural Network. Universiti Tun Hussein Onn Malaysia: Master Thesis. Arthur C. Clarke (2009). Brain Wave Signal (EEG) of NeuroSky. NeuroSky Brain
Computer Interface Technology.
B. Sumathi,Dr. A. Santhakumaran (2011). Pre-Diagnosis of Hypertension Using Artificial Neural Network. Double Blind Peer Reviewed International Research Journal, 11(2), 42-48.
C Brunner, B Z Allison, C Altstatter and C Neuper (2011). A comparison of three brain-computer interfaces based on event-related desynchronization, steady state visual evoked potentials, or a hybrid approach using both signals. Journal of Neural Engineering 8, pp 1-7.
Demitri, M. (2007). Types of Brain Imaging Techniques. Psych Central. Retrieved on December 6, 2013.
Ehsan Tarkesh Esfahani , V. Sundararajan (2011). Classification of primitive shapes using brain–computer interfaces. Computer-Aided Design, Doi : 10.1016/j.cad. Department of Mechanical Engineering, University of California Riverside, 900 University Ave, Riverside, CA, United States. Fausett L. Fundamentals of neural networks architectures, algorithms, and
applications. Englewood Cliffs, NJ: Prentice Hall; 1994.
Ferry Agusta Putra, Andi Dharmawan, Triyogatama Wahyu Widodo (2012). Implementasi DuinOS pada Purwarupa Sistem Penyortiran Barang Berbasis Arduino Uno. ISSN: 2088-3714, pp. 175~186.
G. Pfurtscheller and C. Neuper, “Motor Imagery and Direct Brain-Computer Communication,” IEEE Transactions Vol. 89, No.7, July 2001, pp 1123-1134.
Haykin S. (1994). Neural networks: a comprehensive foundation. New York: Macmillan.
Hema C.R, Paulraj M.P, Harkirenjit Kaur (2008). Brain Signatures: A Modality for Biometric Authentication. International Conference on Electronic Design. Hema C.R., Paulraj M.P., S. Yaacob, A. H. Adom, R Nagarajan (2005). Motor
Imagery Signal Classification for a Four State Brain Machine Interface. International Scholarly and Scientific Research & Innovation 1(5) 2007, pp 1360 ~ 1365.
Hugh Nolan, Robert Whelan, Richard B. Reilly, Heinrich H. Bulthoff and John S. Butler (2009). Acquisiyion of Human EEG Data during Linear Self-Motion on a Stewart Platform. Proceedings of the 4th International IEEE EMBS Conference on Neural Engineering Antalya, Turkey. Pp. 585-588.
J. E. Sullivan and L. D. Hedman (2007). “Effects of home-based sensory and motor amplitude electrical stimulation on arm dysfunction in chronic stroke”, Clin. Neurophysiol., vol. 21, pp. 142-150, 2007.
Justin Dauwels_ and Franc¸ois Vialatte (2010). Topics In Brain Signal Processing. ESPCI ParisTech, Laboratoire SIGMA, Japan.
Jonathan R. Wolpaw, Niels Birbaumer, Dennis J. McFarland,
Gert Pfurtscheller, Theresa M. Vaughan (2002). Brain–computer interfaces for communication and control. Clinical Neurophysiology (113), pp. 767– 791.
Jamal M. Nazzal, Ibrahim M. El-Emary and Salam A. Najim (2008). Multilayer Perceptron Neural Network (MLPs) For Analyzing the Properties of Jordan Oil Shale. World Applied Sciences Journal, 5 (5). pp. 546-552.
Kevin Woods and Kevin W. Bowyer (1997), Generating ROC Curves for Artificial Neural Networks. IEEE Transactions on medical imaging, vol. 16, no 3. Komate, T. (2008). Penerimaan Pelajar Terhadap Penggunaan Modul
Pembelajaran Kendiri Berasaskan Reka bentuk Teori Beban Kognitif . Universiti Teknologi Malaysia : Master Thesis.
Lotte, F., Congedo, M., L´ecuyer, a., Lamarche, F., & Arnaldi, B. (2007, June). A review of classification algorithms for EEG-based brain-computer interfaces. Journal of neural engineering, 4(2), R1–R13.
Lee Ri Quan (2012). EEG Based Emotion Recognition. Universiti Tun Hussein Onn Malaysia : Degree Thesis.
M. Teplan (2002). Fundamentals Of EEG Measurement. Measurement Science Review, 2(2), pp. 1 – 11.
Mitsuru Takahashi, Manabu Gouko, Koji Ito (2008). Electroencephalogram (EEG) and Functional Electrical Stimulation (FES) System for Rehabilitation of Stroke Patients. 21st IEEE International Symposium on Computer-Based Medical Systems, Japan, pp. 53-58.
M. Kemal Kiymik, Mehmet Akin, Abdulhamit Subasi (2004). Automatic recognition of alertness level by using wavelet transform and artificial neural network. Journal of Neuroscience Methods 139, 231–240.
Murugappan, M., Nagarajan, R. & Yaacob, S. (2010). Discrete Wavelet Transform Based Selection of Salient EEG Frequency Band for Assessing Human Emotions. Seriab, Kangar, Perlis: InTech.
Patronis, Gene (1987). "Amplifiers". In Glen Ballou. Handbook for Sound Engineers: The New Audio Cyclopedia. Howard W. Sams & Co. p. 493.
ISBN0-672-21983-2
Rangaswamy M, Porjesz B, Chorlian DB, Wang K, Jones KA, Bauer LO, Rohrbaugh J, O'Connor SJ, Kuperman S, Reich T, Begleiter (2002). "Beta power in the EEG of alcoholics". BIOLOGICAL PSYCHOLOGY 52 (8): 831–842. PMID12372655
Robert Boylestad and Louis Nashelsky (1996). Electronic Devices and Circuit Theory, 7th Edition. Prentice Hall College Division. ISBN 978-0-13-375734-7
S. N. Sivanandam, M. Paulraj (2003), Introduction to Artificial Neural Networks. Vikas Publishing House, India.
Sasikumar Gurumurthy, Vudi Sai Mahit and Rittwika Ghosh (2013). Analysis and simulation of brain signal data by EEG signal processing technique using MATLAB. ISSN: 0975-4024. pp. 2771-2776.
Saeid Sanei & J.A. Chambers (2007). EEG Signal Processing. 1st ed. Cardiff University, UK: John Wiley & Sons, Ltd.
Wan Afif bin Wan Anwar (2013). A Comparison OF EEG Signals Response Between Positive And Negative Thinking. Universiti Tun Hussein Onn Malaysia: Degree Thesis.
Wolpaw JR and Birbaumer N (2006) in Selzer ME, Clarke S, Cohen LG, Duncan P, and Gage FH (eds.) Textbook of Neural Repair and Rehabilitation; Neural Repair and Plasticity, pp. 602–614. Cambridge, UK: Cambridge University Press, with permission from Cambridge University Press.
CT scan. Retrieved February 11, 2013, from http://www.mayoclinic.com/health/ct-scan/MY00309
EEG signal processing. Retrieved November 11, 2013, from http://www.eeginfo.com/research/researchpapers/Signal_Processing.pdf
MRI. Retrieved November 11, 2013, from
http://www.epilepsysociety.org.uk/closer-look-mri
Nerves System. Retrieved November 11, 2013, from
http://www.mrothery.co.uk/nerves/NervesNotes.htm
Nerves System. Retrieved November 15, 2013, from
http://webschoolsolutions.com/patts/systems/nervous.htm#cord
Mu Waves. Retrieved December 30, 2014, from
http://eeghacker.blogspot.com/2013/10/finding-my-mu-waves.html
The Brain and Nervous System. Retrieved Januari 10, 2015, from
http://www.humanillnesses.com/Behavioral-Health-A-Br/The-Brain-and-Nervous-System.html
Paralysis. Retrieved November 10, 2013, from
http://www.nhs.uk/conditions/Paralysis
Brain Signal. Retrieved December 10, 2013, from http://braincomputer.webs.com/
Paralysis. Retrieved November 10, 2013, from
http://www.apparelyzed.com/paralysis.html
Brain waves and brain mapping. Retrieved November 10, 2013, from
http://www.newbrainnewworld.com/?Brainwaves and Brain Mapping#TOP