Journal of Chemical and Pharmaceutical Research, 2014, 6(3):90-101
Research Article
CODEN(USA) : JCPRC5
ISSN : 0975-7384
Blind digital watermarking analysis and evaluation based on GRA
Lianjie Dong*
1and Ruihong Wang
21
College of Science, Agriculture University of Hebei, Baoding, China
2
College of Information Science & Technology, Agriculture University of Hebei, Baoding, China
_____________________________________________________________________________________________
ABSTRACT
With the rapid development of computer and network technology, the information of digital multimedia becoming more easily to acquire, at the same time, it also more easily suffer the illegally copying, fabricating, tampering, infringement etc. Digital watermarking is a technology which embedded the invisible secret information in digital products to protect copyright, on condition that it doesn’t affect the digital products quality in use. At present there is not a scientific and reasonable criterion of digital watermarking evaluation. This paper presents an efficient performance evaluation method with imperceptibility, grey relational analysis, which always consists with human visual perception. Experiments show compared to peak signal to noise ratio and some existing methods, the proposed method not only is efficient and universal, but also has a better ability to distinguish tiny details.
Key words:Digital Watermarking, HVS, Grey Relational Analysis, Copyright protection, Analysis and Evaluation. _____________________________________________________________________________________________
INTRODUCTION
DIGITAL WATERMARKING
As an important branch of information hiding technology, Digital watermarking is an effective combination of digital copyright protection and data security maintenance technology. It is able to conceal the secret information in the digital works, such as image, audio, documents and video, in order to protect the digital works copyright, prove the product authenticity, track piracy or provide product additional information [1,2]. The secret information, including serial number、user’s ID or copyright mark, is used to prove the author’s ownership of their work and provide the evidence of illegal infringement prosecution and identification. It usually is said digital watermarking, which was embedded in the digital products after proper transformation [3,4,5].
Generally, digital watermarking system includes three parts: Watermarking Creating, Watermarking Embedding and Watermarking Extracting. In fact, through reasonably optimizing several related technology steps, for example, the analysis of the original image, the pretreatment of the embedded information, the selection of the information embedded point, designing the embedded mode, controlling the embedded modulation, Digital Watermarking should be seen as an optimization problem, which has some constrains, suck as seeking to meet the imperceptions, safe reliability, robustness [6,7,8,9] . As an important part of watermark information, key is a significant feature of each design scheme, and could be optionally embedded in any steps, e.g., the pretreatment of the embedded information, the selection of the information embedded point, controlling the embedded modulation.
From the perspective signal processing, watermarking embedding can be regards as superimposing a weak signal (watermark) on a strong background (original image). Because of the limitation of Human Visual System distinguishability, HVS can’t perceive the existence of the signal, when the superimposed signal below the Contrast Sensitivity Threshold of HVS. Hence, the original image, through making some adjustment, can be embedded some information without changing visual effects.
digital watermarking can be divided into two categories: visible watermark and invisible watermark. Visible watermark can be seen, such as insert or cover logo in the picture, it is similar to visible watermark in the paper. Visible watermark is mainly used in image, such as used to get the preview of the visually identifying the image on the internet to prevent these images using for commercial purposes, can also be used for video and audio, such as translucent logo of the cable TV channel. The main function of visible watermark is to indicate the copyright, to prevent illegal use. It doesn’t affect the normal use although it reduces the commercial value of data. Invisible watermark, embedded in image, audio or video, is not easily detected, but when the copyright disputes occurs, owners can extract watermark, so as to prove the ownership of the works. Embedding watermarking does not affect the quality of the work, and has the very high practical value [10,11,12,13].
According to the characteristics, watermarking can be divided into two categories: the robust watermarking and fragile watermarking. Robust watermarking is mainly used for identifying copyright information in the digital works, such as author, product serial number. It requires that the embedded watermarking can withstands all kinds of commonly editing process. In contrast to robust watermarking requirement, fragile watermarking is mainly used for integrality protection. It is sensitive to signal changes. According to the state of fragile watermarking, people can determine whether the data has been tempered with.
Fairly comparing different algorithm, using performance evaluation of digital watermarking is significant in the standardization and practical application of digital watermarking. The key of the watermarking performance evaluation is to establish evaluation criteria. Watermarking system evaluation criteria should include not only the robust evaluation, but also subjective or quantitative evaluation about image distortion in watermarking. In other word, it needs to have a balance between the watermarking robustness and imperceptibility. In this paper, the author mainly discusses the transparency evaluation technology of imperceptibility watermarking used for copyright protection.
Watermarking transparency evaluation techniques and methods which use to evaluate and compare the watermarking information influence of the carried signal. So far, there is not a scientific and reasonable received standard or quantitative formula. There are three kinds of existing transparency evaluation: subjective evaluation, objective evaluation, combination of subjective evaluation and objective evaluation.
According to the evaluation scale specified in advance and their own experience, Observers regard image without watermarking as reference image and then evaluate the quality of the image which has been embedded watermarking. This method is called subjective evaluation. The advantage of this method is intuitive and convenient. Its drawback is that the evaluation results vary from person to person, is easily affected by environment and unable to detect the nuance of different images [14] . Objective evaluation method is a pixel measurement evaluation index, including peak signal to noise radio, mean square error, grey relational degree, maximum difference, mean absolute difference, Laplacian mean squared error. This method can’t distinguish the situation when local pixel has a big difference and a large number of pixels have small grey degree difference, and without considering human visual masking property [15,16]. However, digital watermarking is embedded by using the human visual masking property, so these models sometimes make a faulty judgment, even lead to wrong conclusion.
In order to achieve complementary advantage of subjective evaluation and objective evaluation, some scholars propose a watermarking transparency evaluation method, combined with Human Visual System. These methods can be divided into two categories: spatial domain and frequency domain. The typical representative of spatial domain was listed as following:
1. SIQE: quality evaluation index including watermarking image, based on HVS matrix. 2. Perception function, measuring the human visual distortion.
3. Watermarking transparency evaluation method, based on human visual redundancy and error distribution. Etc. The typical representative of frequency domain was listed as following:
1. Image watermarking visible evaluation of DCT domain, based on Laplacian distribution model. 2. The Imperceptibility evaluation of color image watermarking, based on HVS.
3. CHPSNR: transparency index of color image watermarking, based on HVS. Etc.
The process of these evaluation methods mostly relate to the watermarking embedding algorithm, and limited in performance evaluation of watermarking embedding algorithm in DCT domain or DWT domain. Its versatility is poor.
With the people’s constant pursuit of digital watermarking system performance, the researchers deepening and improving the study of algorithm but ignores the evaluation method of watermarking algorithm, that seriously affects the development of algorithm design [17] .
As one of the main factors of digital watermarking, imperceptibility is always an important evaluation content of watermarking. Imperceptibility evaluation is divided into subjective evaluation and objective evaluation. Subjective evaluation standard, mainly through the scene perception of testers and according to certain standard, scores for the digital product. By looking for an objective mathematical model, Objective evaluation standard uses quantitative calculation results to evaluate digital products imperceptible quality.
A lot of the experimental results show that different experienced tester differ in the conclusion of watermarking products objective evaluation. Which means that influenced by tester itself and outside factor, subjective evaluation criteria has uncertainty [18,19]. But it don’t need user to have a deep understand about imperceptibility, has a strong applicability and the result has a certain value. So, considering the digital publishing user’s different requirements of imperceptibility, subjective evaluation criteria was regarded as the low demand standard of evaluation.
In the most cases, imperceptibility as one important factors of digital watermarking need a fair and objective evaluation, so subjective evaluation can’t meet the needs of the industry; therefore testers usually adopt the quantitative measures method in the process of research and development.
The objective standard, which is used to measure the embedded watermarking digital products (mainly refers to image and video) perception, mostly follow many kinds of the distortion measure used in image and video processing. These methods including: AD, MSE, SNR, PSNR, NC, CQ and other visual distortion measure method based on pixel, such as GSSNR, histogram similarity, etc.
Peak signal-to-noise Ratio (PSNR) to estimate the image distortions containing the watermark after the watermark is embedded into the original image, and reflects a digital watermarking algorithm‘s imperceptibility indicator. While the index is not very accurate, it can be used as a good empirical rule to measure watermark‘s imperceptibility. The formula of PSNR is:
2 2
2
,
max ( , ) 101
( ( , ) ( , )) u v
M Y u v PSNR g
X u v Y u v
(1)Among them, X u v( , ) and ( , )Y u v respectively represents the original image X and image Y with embedded
watermark in the value of the position ( , )u v , M is the size of X pixel, the unit of PSNR is decibels (dB).
In order to quantitatively describe the known watermarking system’s robustness for specific attacks, attacks can be continuously increased until the watermarking can no longer be reliably extracted. The similarity between the initial watermark and extracted watermark reflects the robustness of watermarking system [20] .
Ⅲ. GREY RELETIOANL ANALYSIS
Science professor Deng julong proposed in 1982, grey system has a rapid development and growth. Its application scope has expended to all aspects of the production, life and scientific research. It is a system which includes some known information and some unknown information. Grey relational analysis not only is an important part of grey system, also is the cornerstone of the grey system analysis, forecast and decision-making.
Grey relational analysis is used to determine the primary and secondary factors and calculate its relational degree aimed at grey system, and that it can quantitatively compare the situation of the development system. It overcomes the shortcomings of traditional relational analysis which is not suitable for nonlinear model, and is the complement and development to the relational analysis. It provides a new method for comprehensive and reasonable evaluation about the species merits.
So far, many sci-tech workers, come from China, American, Japan, Germany, Australia, Canada, England, etc, have the great enthusiasm to carry out the exploration of grey system theory and application research in different fields. That promotes the development of the grey system theory and has solved many practical problems.
difficult to compare. Many main characters could be regarded as grey system, integrate into a unified comparison.
Grey relational analysis is an important part of grey theory, mainly is used to analysis the associations between various factors in grey system. Its main idea is that: different date array is established by various factors in grey system, then we measure relational degree between various factors based on geometrical similarity of each date array. At present, there are dozens of models using for calculate grey relational degree between data array.
In this paper, based on grey relational theory for small sample data analysis, author supposes a transparency evaluation method of imperceptible watermarking, which uses the wavelet transform and HVS to design a algorithm, having nothing to do with watermark embedding algorithm but consistent with the HVS subjective feeling.
The calculation method of Deng relational degree was introduced as follow.
According to grey system theory, all the variety, taking part in test, was regarded as a grey system. Each variety is seen as a factor in the system. When we research the performing eudismic order of testing varieties, we set a ideal variety at first, the every characters of ideal variety refer to the maximum value of testing variety characters. Set ideal species as standard data arrayX0, other species as comparing data arrayXi, calculation formulas as follows:
0( ) 0(1), 0(2), 0(3) 0( )
X k X X X X n , X ki( ) [ Xi(1),Xi(2),Xi(3)X ni( )] , n is the number of evaluation factors. Using the formula (2), (3), (4) to calculate relational coefficient, relational degree and weighted relational degree of each species.
Relational coefficient:
0 0
0 0
min min ( ) ( ) max max ( ) ( ) ( ) ( ) max max ( ) ( )
i i
i k i k
i
i i k i
X K X K X K X K
X K X K X K X K
(2) Relational degree: 1
1 n ( )
i i
K
r K
n
(3)Weighted relational degree:
1
( ) n
i i i
K
r K W
(4)In the formula (2), X K0( )X Ki( ) i( )k is the absolute difference between the data array X0 and Xi at the pointK ; min min 0( ) i( )
i k X K X k is the level 2 minimum differences; max maxi k X K0( )X ki( ) is the level 2
maximum differences; is the resolution ratio, value range 0-1, usually set 0.5. The deeper the relational degree, more excellent the varieties comprehensive evaluation. Otherwise, the evaluation is poor.
Ⅳ. IMPERCEPTIBLE WATERMARKING TRANSPARENCY EVALUATION METHOD
In the process of imperceptible watermarking transparency evaluation, the original host image information and embedded watermarking image information is known, but location, content and strength of the watermarking are unknown. It is a typical grey system, so we can use the grey relational analysis theory to analysis the uncertain watermarking information impact degree of the carrier image.
4.1 AUTHOR’S DESIGN IDEA 4.1.1 WAVELET TRANSFORM
Wavelet transform has many good characteristics, not only can analysis the whole situation of signal, also can analysis the signal details. On the premise of not losing the original signal, wavelet transform can decompose the signal in space and frequency, provide the space and frequency information at the same time. It well handles the contradiction between space and frequency resolution, and meet the energy conservation equations. Meanwhile multiresolution decomposition characteristics of wavelet transform has the consistency with Human Visual System characteristics. For the HVS different sensitivity of spatial domain and frequency domain, we can use wavelet transform to achieve the better effect.
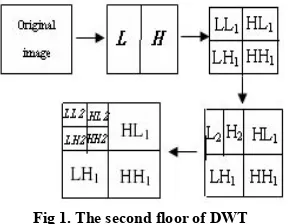
first, Image is decomposed into different space and frequency sub graph, and then uses coefficient coding for sub graph. After DWT decomposition, the amount of image date does not change. According to different frequency information, the data was grouped and arranged again in order to signal processing becomes more convenient. When we use DWT in 2D image, we transform the image at first, and then transform the column. Figure 1 shows the pyramid multiresolution decomposition diagram of DWT static image. L means low-frequency, H means high-frequency, and subscript means layers of transform. Comparing original, the image has different features after decomposed, which is showed that the low-frequency approximated sub graph LL mostly focuses the information of original image, mid-frequency and high-frequency detailed sub graph LH, HL and HH keep the vertical edge information, horizontal edge information and diagonal edge information. They characterize the texture and edge information of the original image.
Fig 1. The second floor of DWT
In order to better select the layers of wavelet decomposition, this paper adopts level 3 discrete wavelet decomposition for watermarking image, and makes a statistical analysis of each layer wavelet coefficients when the image was decomposed. Results are showed in table 1.
Table 1 Statistics of the wavelet decomposition coefficient
Through the analysis of data we can conclude that: with the decomposition layer increasing, the scope of wavelet decomposition coefficient also increasing. It shows that advanced wavelet coefficients are more important. The value of wavelet coefficients at the 3 level LL3 sub-band is bigger than other sub graph. Its energy is 97.179, shows that LL3 sub-band is most important. At the same resolution, the decomposition coefficient and energy of LH and HL sub-band is bigger than HH sub-band.
4.1.2 HUMAN VISUAL SYSTEM
HVS is an advanced complex system. As the directly observed channel of image, eyes send the received image information to the brain, and then the brain makes an analysis and judgment of image quality. As direct receiver of image, HVS plays an important role in the improvement of watermark performance. Especially, digital watermarking imperceptibility and robustness is a pair of contradict features. By fully using the HVS features and combining the image characteristics, we not only can guarantee the robustness, also can improve the imperceptibility.
[image:5.595.212.403.375.576.2]equal ranges according to different size. It counts the pixel distributional situation of each range from the local point of view, generates comparative sequence, then uses the grey relational degree size of perfect distributional sequence and each comparative sequence to evaluate the watermarking transparency, gets a more reasonable evaluation results than traditional PSNR. But this algorithm evaluates watermarking transparency based on the change of pixel grey degree in spatial domain, does not consider the eye’s perception characteristic. Based on this, we plan to design an efficient and reasonable evaluation method from 3 aspects: 1. using the image cognitive similarity of HVS and DWT, we adopt level 3DWT for original image and watermarking embedded image, classify the sub graph and form different reference sequence and comparative sequence. 2. Considering the visual effects of watermark embedding area ratio and watermark embedding strength, we adjust the relational degree between the two kinds of sequence. 3. According to the watermark embedding strategy and eye’s sensitive features, we weight all kinds of relational degree and regard the result as eventually evaluation index of watermark transparency.
4.2 THE STEPS OF THE METHOD
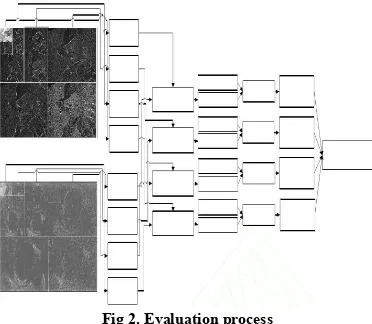
[image:6.595.214.400.258.420.2]Set the size of original image andI images isW H , the watermark transparency evaluation process shown in figure 2.
Fig 2. Evaluation process
The main process as following:
Steps 1: adopts level 3 DWT for original image and I watermarking embedding images, get the approximated sub graph and level 3 detailed sub graph of original image, group I approximated sub graphs contained watermarking and level 3 detailed sub graphs.
Steps 2: according to the perceptible characteristic of HVS, classify each sub graph into 4 categories: 1st category is compose of level 1 detailed sub graph, 2nd category is compose of level 2 detailed sub graph, 3rd category is compose of level 3 detailed sub graph, 4th category is compose of approximated sub graph. Similarly, classify each sub graph contained watermarking into 4 categories. According to the HVS characteristics of smooth area more sensitive than texture area, eye’s sensitivity from 1st to 4th sub graph information is gradual increase.
Steps 3: through the above 4 kinds of sub graph, respectively reconstruct the original image and watermarking image, get 4 categories reconstructed sub graphs of original image Mi i1, 2,3, 4and 4 categories reconstructed
sub graphs of watermarking image i j
M (i1, 2,3, 4; j1, 2,I).
Steps 4: calculate the different image between 4 categories reconstructed sub graphs of original image and 4 categories reconstructed sub graphs of watermarking image, that is i
j
M -Mi (i1, 2,3, 4; j1, 2,I).
Steps 5: determine the comparative sequence by 4 kinds of categories sub graph of different image. Divide range from absolute minimum value to absolute maximum value of different image’s ith sub graph pixel into equal Ni
sub-ranges; the numbers, that ith sub graph pixel of
I
different images distribute in the Ni sub-ranges, form 4 data sequence i( )( 1, 2,3, 4)j
x k i , as the corresponding comparative sequence of 4 categories sub graphs,
1, 2, , i
k N ; j1, 2,I
Perfect watermarking image should be same with original image. It means that each sub graph pixel distributes in
I
th range of corresponding Ni (i1, 2,3, 4) range. So the corresponding comparative sequence of 4 categoriessub graph is:
1 1
1 0
3
( ) ,0, ,0 4
N
x k W H
2 1 2 0 3
( ) ,0, ,0 16
N
x k W H
3 1 3 0 3
( ) ,0, ,0 64
N
x k W H
4 1 4 0 3
( ) ,0, ,0 64
N
x k W H
Steps 7: calculate the grey relational degree between the reference sequence and comparative sequence. At first, use the formula (2) to respectively calculate the Deng relational degree 0 ( 1, 2,3, 4; 1, 2, , )
i j
R i j I between the
reference sequences x k i0i( )( 1, 2,3, 4) and corresponding
I
groups comparative sequence. Then, by using theHVS features, adjust 0i j
R , specific adjustment method shown in section 4.3. Finally, according to HVS perceptive multi-channel feature and wavelet multi-scale transform matching characteristic, get the whole grey relational degree between the ideal host image and each containing watermarking images waiting for the evaluation:
1 2 3 4
0j 1 0j 2 0j 3 0j 4 0j
R a R a R a R a R ,
4
1
1, ( 1, 2,3, 4)
i i
i
a a i
respectively represent the importance of 4 sub graph relational degrees, set its value referring to the watermark embedding algorithm and HVS characteristic.Steps 8: sort the whole grey relational degree between ideal host images and containing watermark image waiting for the evaluation, then get the watermark transparency sequence of each containing watermark image. Obviously,0R0j 1, and the bigger R0j, the higher watermark transparency.
To sum up, GRA is a kind of relative sequence analysis. It reflects the merits of watermark transparency based on correlation sequence relative value of each containing watermark images. At group of containing watermarking images, waiting for the evaluation, the bigger the relational degree, the higher the transparency. Otherwise, it is poor.
4.3 RELATIONAL DEGREE ADJESTMENT BASED ON HVS
According the HVS perception feature, we define the watermark embedding area ratio i j
q as a ratio of i j c and i j d , i j i j i j c q d (5) i j
c is the pixel number of jth different image’s ith category sub graph, which absolute value is not 0. i j
d is the all pixel numbers of j th different image’s i th category sub graph. i1, 2,3, 4;j1, 2, , I . Obviously,0 i 1
j
q
, and the bigger i j
q , the poor the visual effect. When the containing watermarking image is same as the original image, qij 0.
On the other hand, when the ith category sub graph’s pixel of each different image was mapped to corresponding
i
strength coefficient i j
r of watermark embedding as:
1
(1 ( 1)) N
i jk i k
j
b k n
r W H
(6)1, 2,3, 4; 1, 2, ,
i j I. b is the corresponding increased weight when we add the interval number., its value is 0.01.
i jk
n is the pixel number of j th different image’s i th category sub graph at the interval k. i 1 j
r . When the containing watermarking image is same as the original image, i 1
j
r .
Then, according to the above definition of i j
q and i j
r , the principle of adjusting R0ij is that: the bigger the ratio
of embedding watermarking area or the greater the strength of embedding watermark, the worse the watermarking transparency. The specific adjusting method is:
0 0 ( )
i j
i q
i i
j j j
R R r (7)
1 i j
r ;0 i 1 j
q
, i1, 2,3, 4;j1, 2, , I . Thus, i qij
j
r and R0ij value range is
0,1
.4.4 EXPERIMENT AND RESULTS ANALYSIS
To test the effectiveness of method in this pare, we get many group of containing watermarking image by adopting different embedding watermarking algorithms and parameters. Using method in this paper, PSNR and some existing transparency evaluation method compare the results. Here are 2 sets of international general experimental results of watermark testing image.
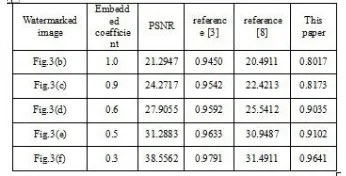
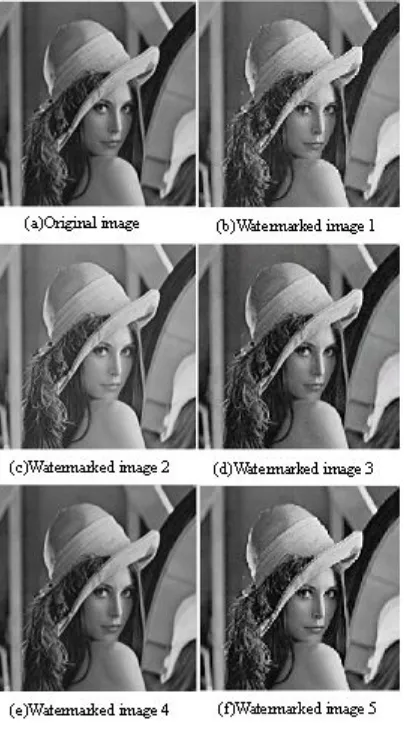
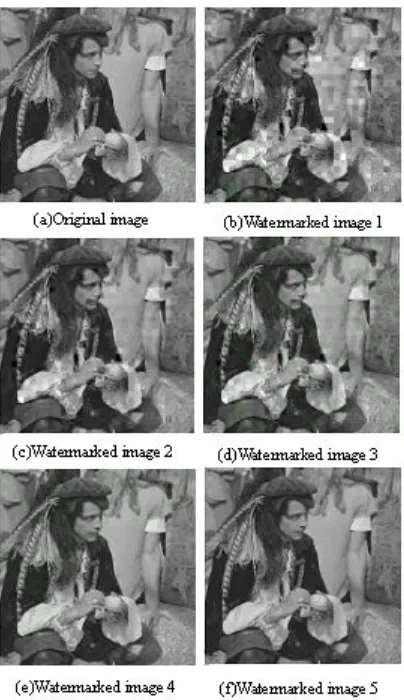
In experiments 1, grey image lena at the size 256×256 is the original image. Watermarking information is binary pseudorandom sequence of the watermarking image after scrambled. Embedding watermarking algorithm is the image watermarking embedding algorithm of DCT domain proposed by reference [3], [8]. When we adopt the watermark embedding coefficient shown in table 2, the watermark image is shown in figure 3.
[image:8.595.219.392.494.582.2]The results of evaluation image from figure 3(b)~(f) , adopting different algorithm, are shown in table 2.
Table 2 Watermark transparency evaluation results of fig.3(b)~(f)
From the table 2, we can conclude that the results of 4 different methods are consistent: figure 3(b)﹤(c)﹤(d)﹤(e)
﹤(f). PSNR value is similar to the result of reference [8], but the value range is no clear. This paper’s method result is similar to the result of reference [3], and the value range is all belong to the interval (0, 1].
From the theory point of view, the watermark transparency should increase gradually with the watermark embedding coefficient decreasing. Therefore, evaluation results of 4 methods are consistent with theoretical analysis results. Note that in this experiment, watermark is the first 9 coefficient of AC component embedded in the DCT domain. So the weight of 4 categories sub graph is:
1 0,
a a2 0.15,a3 0.75a40.1.
Fig 3. Transparency of binary pseudo random sequence
[image:9.595.204.406.89.455.2]Because the transparency evaluation algorithm, proposed by inference [8], is only applicable to one watermarking embedding coefficient, but there are two watermarking embedding coefficients in this experiment, so this experiment can not use the method of inference [8] to evaluate watermarking transparency. The evaluation results of different algorithm are shown in table 3.
Table 3 Watermark transparency evaluation results of fig.4(b)~(f)
From the table 3 and figure 4, we can conclude that the results of 3 different methods are consistent: figure 4(b)﹤(c)
Fig4. Transparency of pseudo random sequence
Fig 5.Transparency curve of paper 3 and this paper Fig 6.Transparency curve of PSNR
From the HVS perception view, this method can better reflect the tiny difference of watermarking transparency, such as image quality of figure 4(e) has obviously improved than front three figure, image quality of figure 4(f) has slightly improved than 4(e). This is consistent with the changes of relational degree in this pare. The method of inference [3] can reflect the changes of HVS perception to some extend, but its detailed distinguishability is worse than this paper. PSNR can’t correctly reflect detailed distinguishability of HVS perception in watermarking image. Such as there is big difference between 4(d) and 4(e), small difference between 4(e) and 4(f). The value of PSNR is not consistent with that.
[image:10.595.205.407.73.423.2]1 0.05
a ,a2 0.1,a3 0.15,a4 0.7.
CONCLUSION
In this paper, author put forward a combining subjective and objective evaluation method of imperceptible watermarking transparency by using the features of DWT, grey system theory and HVS. This method is versatile without the limitation of watermark embedding algorithm and coefficient. The evaluation experiment results of containing watermarking image, which use different embedding algorithm and different embedding coefficient to obtain, show that: comparing with the PNSR and other exiting objective evaluation methods, this method can correctly and efficiently evaluate the watermarking transparency and gets the result which is consistent with subjective visual perception of people. Because that this method considers the perceptual characteristic of HVS. Its potential applications include: performance test of watermarking embedding algorithm, comparison with the watermarking capacity algorithm test and performance comparison of different watermarking algorithm, blind evaluation of carrier quality etc. the further work is that: conform the numbers of optimal sub-interval in the evaluation algorithm, conform the number of optimal categories in wavelet transform, conform the optimal value of constant coefficients in weight calculation, analysis the affection of GRD calculation model to evaluation results etc.
Acknowledgment
This work was supported in part by a grant from project: the applied research of grey relational analysis in agricultural statistics. Project number is 11ZN031.
REFERENCES
[1]Tian Hongpeng, MaMiao, “An automatic method to evaluate the imperceptibility of digital watermark,” [C]Proc.of the 2007 IEEE International Conference on control and automation, Guanzhou:2007:3226-3229
[2]Kong Xiangwei, Chu Rufeng, Ba Xiaohui, etc. [J]Intelligent Data Engineering and Automated Learning,
2003,2690:426-430
[3]Xu Jian, Ma Bin, “Digital watermark for document electronic seal system based on DCT technology , ” Proceedings of the International Conference on Uncertainty Reasoning and Knowledge Engineering, URKE 2011,
2011, v 2, p 5-8,
[4]Ma Xiuying, Lin Jiajun, “HVS-based imperceptibility evaluation for steganography,” [J].Lecture Notes of the Institute for Computer Sciences,Social Informatics and Telecommunications Engineering,2009,18:152-161
[5]Xie Jianquan, “Research on imperceptibility index of image information hiding,” [c].Proc. Of 2010 Second International Conference on Networks Security Wireless Communications and trusted Computing, Washington,DC:IEEE Computer Society,2010,2:49-53
[6]Zhu Changqing, Ren Na, “An algorithm for digital watermark based on pseudo-random sequence and DCT for remote sensing image,” Wuhan Daxue Xuebao (Xinxi Kexue Ban)/Geomatics and Information Science of Wuhan University, December2011,v 36, n 12, p 1427-1429+1499.
[7]Ma Bin, “Experimental research of image digital watermark based on DWT technology,” Proceedings of the International Conference on Uncertainty Reasoning and Knowledge Engineering, URKE2011, 2011,v 2, p 9-12.
[8]Bo xiaochen, Shen lincheng, Chang wensen, ACTA Electronic Sinica,2003,,3(1):33-36
[9]Han Wei-Yuan, Yang Yan, Zhi Hui-Lai, “Digital watermark encryption algorithm based on Arnold and DCT transform,”Lecture Notes in Electrical Engineering,2012, v 138 LNEE, p 613-621.
[10]Song Jianhua, Wang Guoqiang, Ma Hongbin, Wang Yingli, International Journal of Advancements in Computing Technology,October2012, v 4, n 18, p 11-21.
[11]Song Jianhua, Song Jianwei, Bao Yuhua, “A blind digital watermark method based on SVD and Chaos,” Procedia Engineering, 2012 International Workshop on Information and Electronics Engineering, 2012, v 29, p 285-289.
[12]Gao Guangda, Ren Na, Wang Yongzhi, Zhu Changqing, “Digital watermark algorithm using image relocation and traversal detection for remote sensing image,” Wuhan Daxue Xuebao (Xinxi Kexue Ban)/Geomatics and Information Science of Wuhan University, October2012, v 37, n 10, p 1229-1231.
[13]Li Bin, Zhang Yuanyuan, “Design of digital watermark detection system based on handheld devices,” Proceedings - 2012 International Conference on Computer Science and Electronics Engineering, ICCSEE 2012,
2012, v 2, p 52-55.
[14]Huang Futong, Sun Tingting, “The research of electronic seal system based on digital watermark technology,” Proceedings - 2012International Conference on Computing, Measurement, Control and Sensor Network, CMCSN
2012,2012, p 321-323.
DCT-DWT,” 2011 IEEE International Conference on Computer Science and Automation Engineering(CSAE 2011),2011.06.10
[16]Ying Lu, “Research on the Motivation of the Customer Participation Based on Gray Relational Analysis,”2011
International Conference on Business Management and Electronic Information(BMEI2011),2012.05.13
[17]Li Gang, Han Huijuan, Huang Xiangmin, “Gray Relational Evaluation Model with Weights Based on DEA Cross-Efficiency,” 2010 The 2nd International Conference on Industrial Mechatronics and Automation (ICIMA
2010)2010.05.30(Volume 1)
[18]Jinana Zhao, Xin Wang, “The Grey Relational Analysis of CO2 Emissions and Its Influencing Factors,” 2012
IEEE International Conference on Engineering Technology and Economic Management(ICETEM2012),2012.5.20
[19]Aixiang Tao, HuaiYin, “An Analysis on the Energy Consumption and Economy Increase Based on Grey Relation Theory,” Proceedings of International Conference on Engineering and Business Management (EBM2011),2011.03.22