Development of Model for Estimation of Radio
Refractivity from Meteorological Parameters
Enyenihi Henry Johnson1,*
, Simeon Ozuomba2, Kalu Constance2
1
Department of Electrical/Electronic Engineering, Akwa Ibom State University Mkpat Enin, Nigeria
2
Department of Electrical/Electronic and Computer Engineering University of Uyo, Nigeria
Copyright©2019 by authors, all rights reserved. Authors agree that this article remains permanently open access under the terms of the Creative Commons Attribution License 4.0 International License
Abstract
In this paper development and validation of a simple linear model for estimating radio refractivity from meteorological parameters are presented. Twelve months radiosonde meteorological data for Cross River state which was obtained from Nigerian Meteorological Agency (NIMET) was used to determine the radio refractivity (N). The correlation between the refractivity and the atmospheric temperature (T), atmospheric pressure (P) and relative humidity (U) were examined for twelve months dataset. The correlation values showed that temperature (T) and the product of P, H and T had the highest correlation with respect to N in all the twelve months. Based on the correlation values among the parameters examined, a simple linear model was developed to estimate the radio refractivity. In all the twelve months dataset, the mathematical model gave worst case absolute percentage error of about 3.3%. Two sample meteorological dataset from published articles were also used to validate the model. The model gave a maximum absolute percentage error of 2.46 % for the first test meteorological dataset while it gave a maximum absolute percentage error of 1.25 % for the second test meteorological dataset. In all, the linear model presented in this paper will make it easier to compute the radio refractivity from available meteorological data. The results from the validation dataset showed that the model can also be applied to every other region other than the case study area where the data for the model development were obtained.Keywords
Refractivity, Radioclimatic Parameter, Refractivity Gradient, Radiosonde, Regression Model1. Introduction
Most wireless communication systems rely heavily on the atmosphere as a medium for the signal transmission [1, 2, 3, 4] As such, wireless network designers are concerned about the nature of the atmosphere through which the
signal propagates from the source (the transmitter) to the destination (the receiver) [5, 6, 7, 8]. Radio waves are significantly affected by the atmospheric conditions; particularly, the radio waves can be reflected, refracted, absorbed or scattered in the atmosphere [3,9, 10]. Among these effects, atmospheric refraction or bending of the radio signal path occurs due to variations of primary radioclimatic parameter, namely temperature, pressure and relative humidity [11, 12, 13, 14]. Therefore, the extent to which the radio wave path will be bent in the atmosphere is called refractivity [11, 14, 15,16].
requirement in automated implementation of analysis requiring radio refractivity. The linear model also makes it easier to incorporate the radio refractivity into other mathematical models for parametric analysis.
2. Methodology
The radiosonde meteorological data for Cross River state, Nigeria was obtained from Nigerian Meteorological Agency (NIMET) for the twelve months in 2013. The dataset of atmospheric temperature (T), atmospheric pressure (P) and relative humidity (U) was extracted from the radiosonde meteorological data. Radio refractivity (N) was computed for each set of T, U and P for the twelve months. The correlation among the parameters N, T, U, P and TUP which is the product of T,U and P were computed. The correlation values show that T and TUP had the highest correlation values with respect to N for all the twelve months. Therefore, a multiple linear regression was developed for estimating the radio refractivity (N) for the values of T and TUP. The prediction performance of the model was determined in terms of model estimation percentage error (e%). Afterwards, two meteorological datasets from published research articles [18, 20] were used to validate the model. The atmospheric refractivity (N) is determined as follows [14, 21, 22];
N = 77.6
T ( p ) + 4810 e
T ) (1) Where
T is the absolute temperature in Kelvin p is the atmospheric pressure in hPa
e is the water vapour pressure
Furthermore, the atmospheric water vapour pressure can be determined using the relation:
e = 6.112� U
100� exp � 17.5(t)
t+240.97� (2) Where U is the relative humidity in % and t is the atmospheric temperature (Celsius). The statistical correlation between two parameters x and y is computed as follows;
𝐶𝑜𝑟𝑟𝑒𝑙𝑎𝑡𝑖𝑜𝑛 (𝑥,𝑦) = ∑𝑛𝑖=1(𝑥𝑖−𝑥̅)(𝑦𝑖−𝑦�)
�∑𝑛𝑖=1(𝑥𝑖−𝑥̅)2∑𝑛𝑖=1(𝑦𝑖−𝑦�)2
(3) Absolute Percentage error between the actual value X𝑎 and the estimated value X𝑒 is computed as ;
Absolute Percentage error (%) = ��X𝑎−X𝑒
X𝑎 �100� (4)
3. Results and Discussion
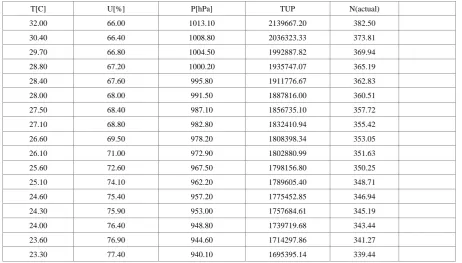
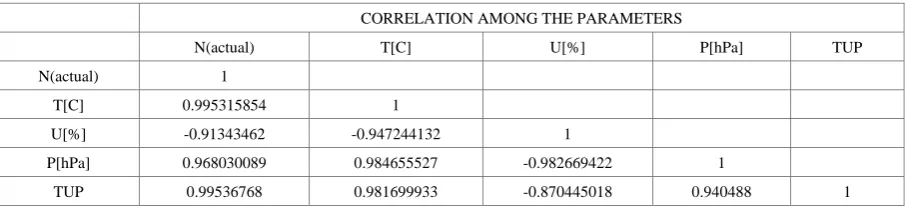
Two months (January and June) radiosonde meteorological data for Cross River for the year 2013 are given in Table 1 and Table 2 along with the computed radio refractivity and correlation values among the parameters, N, T, P, U and TUP where TUP is the product of T, U and P. The The graph of relative humidity, U(%) and atmospheric pressure, P[hPa] versus refractivity gradient, N for the month of January 2013 is given in Figure 1 while Figure 2 shows the graph of temperature, T(C) and atmospheric pressure, P[hPa] versus refractivity gradient, N for the month of January 2013.
Table 1. January Radiosonde meteorological data for Cross River for the year 2013 along with the computed radio refractivity and correlation values among the parameters, N, T, P, H and TUP
T[C] U[%] P[hPa] TUP N(actual)
[image:2.595.68.531.496.759.2]CORRELATION AMONG THE PARAMETERS
N(actual) T[C] U[%] P[hPa] TUP N(actual) 1
T[C] 0.995315854 1
U[%] -0.91343462 -0.947244132 1
P[hPa] 0.968030089 0.984655527 -0.982669422 1
TUP 0.99536768 0.981699933 -0.870445018 0.940488 1
Table 2. June Radiosonde meteorological data for Cross River for the year 2013 along with the computed radio refractivity and correlation values among the parameters, N, T, P, H and TUP
T[C] U[%] P[hPa] TUP N(actual)
29.00 77.00 1014.30 2264931.90 385.67 28.00 76.40 1008.70 2157811.04 377.90 27.60 71.00 1003.10 1965674.76 366.23 27.10 72.20 997.60 1951924.11 364.25 26.60 73.40 992.00 1936820.48 362.22 26.20 74.50 986.50 1925549.35 360.51 25.70 75.60 981.10 1906198.81 358.33 25.30 76.60 975.60 1890693.29 356.42 24.80 77.70 969.70 1868573.11 354.07 24.40 78.80 963.90 1853309.81 352.17 23.90 80.00 958.30 1832269.60 349.98 23.50 81.20 952.50 1817560.50 348.15 23.00 82.30 946.90 1792387.01 345.79 22.60 83.50 941.40 1776515.94 344.00 22.20 84.50 935.90 1755654.81 341.95 22.20 82.70 930.50 1708342.17 338.49 22.90 74.10 924.90 1569453.56 329.91
CORRELATION AMONG THE PARAMETERS
N(actual) T[C] U[%] P[hPa] TUP N(actual) 1
T[C] 0.995316 1
U[%] -0.91343 -0.94724 1
P[hPa] 0.96803 0.984656 -0.982669422 1
[image:3.595.72.525.78.181.2]Figure 1. The Graph of Relative Humidity, U(%) and Atmospheric Pressure, P[hPa] versus Refractivity Gradient, N for the month of January 2013
Figure 2. The Graph of Temperature, T(C) and Atmospheric Pressure, P[hPa] versus Refractivity Gradient, N for the month of January 2013
From the correlation values in Table 1 and Table 2, T and TUP have the highest correlation values in the two months. Similarly, for the T and TUP, high correlation values were also observed in all the twelve months considered. Hence, a multiple linear regression model was developed for estimating N from the values of T and TUP. There is a positive correlation between N and T, P and TUP which shows a direct proportional relationship between N and T, P and TUP. However, there is a negative correlation between N and U which shows inverse proportionality.
The model was developed using XURU online regression tool where the values of T is X1, TUP is X2 and N is Y. The dataset of T, TUP and N for the 12 months were pasted into the text box provided in Xuru Multiple Linear Regression (MLR) webpage and the model obtained from the Xuru MLR is given as;
𝑁= 2.38(T) + 0.000051[(T)(U)(P)] + 198.38 (5) The model prediction performance in terms of absolute estimation percentage error (%) for the months of January and June 2013 are given in Table 3 and Table 4 respectively. According to Table 3 and Table 4, the maximum absolute estimation percentage error is 0.09 % for the month of January and 0.98 % for the month of February. Among the twelve months dataset used to develop the model, the highest value of maximum absolute estimation percentage error was 3.22 % and it was observed in the month of May, which is shown in Table 5
Table 3. Model Prediction Performance In Terms Of Absolute Estimation Percentage Error (%) For The Month of January 2013
N(actual) N (estimated) Abs (e%)
382.50 382.78 0.072
373.81 373.74 0.018
369.94 369.88 0.015
365.19 364.85 0.093
362.83 362.68 0.040
360.51 360.52 0.003
357.72 357.76 0.010
355.42 355.57 0.043
353.05 353.17 0.032
351.63 351.70 0.021
350.25 350.27 0.006
348.71 348.65 0.017
346.94 346.74 0.056
345.19 345.13 0.017
343.44 343.51 0.020
341.27 341.27 0.001
339.44 339.60 0.047
[image:4.595.65.285.246.380.2] [image:4.595.72.523.445.724.2]Table 4. Model Prediction Performance In Terms Of Absolute Estimation Percentage Error (%) For The Month of February 2013
N(actual) N(estimated) Abs(e%)
385.67 381.98 0.956
377.90 374.18 0.98
366.23 363.51 0.74
364.25 361.62 0.72
362.22 359.67 0.71
360.51 358.15 0.66
358.33 355.98 0.66
356.42 354.24 0.61
354.07 351.93 0.60
352.17 350.21 0.56
349.98 347.95 0.58
348.15 346.26 0.54
345.79 343.79 0.57
344.00 342.04 0.57
341.95 340.03 0.56
338.49 337.64 0.25
329.91 332.28 0.72
Absolute Estimation Percentage Error (%) 0.98
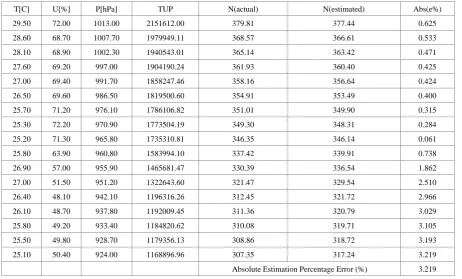
Table 5. Radiosonde meteorological data for Cross River for the year 2013 along with Model Prediction Performance in Terms of Absolute Estimation Percentage Error (%) For The Month of May 2013
[image:5.595.72.527.96.376.2] [image:5.595.69.532.412.691.2]Two sample meteorological datasets from online published journal articles were used to validate the model and the performance of the model in respect of the validation datasets are presented in Table 6 and Table 7. In Table 6, the absolute maximum estimation percentage error
of the model for the validation dataset from [18] is 2.46 % whereas in Table 7 the absolute maximum estimation percentage error of the model for the validation dataset from [20] is 1.25 %.
Table 6. Model Performance I Respect of Validation Dataset From [18]
T[C] U[%] P[hPa] N N (estimated) e% 25.00 94.00 1012.75 387.68 378.29 -2.42 25.00 100.00 1012.75 395.59 385.97 -2.43 25.00 89.00 1012.75 381.09 371.88 -2.42 25.00 90.00 1012.75 382.41 373.16 -2.42 25.00 82.00 1012.75 371.86 362.91 -2.41 25.00 94.00 1013.77 387.95 378.41 -2.46 25.83 94.00 1013.77 392.78 384.41 -2.13 25.56 94.00 1013.77 391.14 382.41 -2.23 26.39 94.00 1013.77 396.11 388.41 -1.95 26.11 94.00 1013.77 394.43 386.41 -2.03 25.00 94.00 1012.75 387.68 378.29 -2.42 25.00 94.00 1013.77 387.95 378.41 -2.46 25.00 94.00 1011.74 387.42 378.16 -2.39 25.00 94.00 1010.72 387.15 378.04 -2.35 25.00 94.00 1009.37 386.80 377.88 -2.31 Absolute Estimation Percentage Error (%) 2.46
Table 7. Model Performance I Respect of Validation Dataset From [20]
[image:6.595.68.531.175.422.2] [image:6.595.73.527.455.732.2]4. Conclusions
The study examined the correlation among radio refractivity and the meteorological parameters, namely atmospheric temperature (T), atmospheric pressure (P) and relative humidity (H). The correlation values showed that there is a positive correlation between N and T, P and TUP (that is, the product of T, U and P) which means that N is directly proportional to T, P and TUP. However, there is a negative correlation between N and U which indicated inverse proportionality between N and U. In all, T and TUP showed highest correlation values for the model training datasets; as such the two parameters were used in the development of the linear regression model that can be used to estimate the radio refractivity for the available meteorological dataset. The model performance was validated with meteorological data extracted from published journal articles. The results showed that the model can estimate refractivity with a maximum prediction error of about ±3.35%. Furthermore, the model can be applied in computing refractivity in any climatic region.
REFERENCES
[1] Walker, J., & Awange, J. L. (2018). Global Navigation Satellite System. In Surveying for Civil and Mine Engineers
(pp. 147-156). Springer, Cham.
[2] Capela, C. J. R. (2012). Protocol of communications for VORSat satellite.
[3] Mason, S. P. (2010). Atmospheric effects on radio frequency (RF) wave propagation in a humid, near-surface environment. Naval Postgraduate School Monterey Ca. [4] Adegoke, A. S., & Onasanya, M. A. (2008). Effect of
propagation delay on signal transmission. Pacific J Sci Technol, 9, 13-19.
[5] Ahmad, M. R. (2014). Interaction of Lightning Flashes with Wireless Communication Networks: Special Attention to Narrow Bipolar Pulses (Doctoral dissertation, Acta Universitatis Upsaliensis).
[6] Bleidorn, A. L. (2008). Modeling atmospheric effects on
wireless networks (Doctoral dissertation, Monterey,
California. Naval Postgraduate School).
[7] Blajian, G., & Prodanoff, Z. G. (2007). Atmospheric Effects of IEEE802. 11g over HTTP. In PDPTA (pp. 898-904). [8] Wu, J., & Li, Y. (2006, February). Atmospheric effects on
wireless optical communications. In ICMIT 2005:
Information Systems and Signal Processing (Vol. 6041, p.
60410Q). International Society for Optics and Photonics. [9] Pokhrel, S. (2017). Unit-2 Interaction of EMR with Earth
and Atmosphere. IGNOU.
[10]Hu, S., Gao, T. C., Li, H., Liu, L., Liu, X. C., Zhang, T., ... & Su, X. (2016). Effect of atmospheric refraction on radiative transfer in visible and near‐infrared band: Model development, validation, and applications. Journal of
Geophysical Research: Atmospheres, 121(5), 2349-2368.
[11]Akpootu, D. O., & Iliyasu, M. I. (2017). Estimation of Tropospheric Radio Refractivity and its Variation with Meteorological Parameters over Ikeja Nigeria. Journal of
Geography, Environment and Earth Science International,
10(1), 1-12.
[12]Adedayo, K. D. (2016). Statistical analysis of the effects of relative humidity and temperature on radio refractivity over Nigeria using satellite data. African Journal of
Environmental Science and Technology, 10(7), 221-229.
[13]Mufti, N. (2012). Investigation into the Effects of the Troposphere on VHF and UHF Radio Propagation and Interference between Co-Frequency Fixed Links (Doctoral dissertation, University of Leicester).
[14]Grabner, M., & Kvicera, V. (2011). Atmospheric refraction and propagation in lower troposphere. In Electromagnetic
Waves. InTech.
[15]Falodun, S. (2015). Quantitative Studies of Vertical Structure of Radio Refractive Index in a Coastal Area of Nigeria. Journal of Sustainable Technology, 6(2).
[16]Sim, C. Y. D. (2002). The propagation of VHF and UHF
radio waves over sea paths (Doctoral dissertation,
University of Leicester).
[17]Amajama, J., & Eshiet, M. (2016). Impact of weather components on (UHF) radio signal. International Journal of
Engineering Research and General Science (IJERGS), 4(3),
474-480.
[18]Joseph, A. (2015) Mathematical Relationships between Radio Refractivity and Its Meteorological Components with A New Linear Mathematical Equation to Determine Radio Refractivity.– International Journal of Innovative Science,
Engineering & Technology (IJISET), Vol. 2 Issue 12,
December, 2015
[19]Jari, L., & Ismo, H. (2015). Effect of temperature and humidity on radio signal strength in outdoor wireless sensor.
In Proceedings of the federated conference on computer
science and information systems (Vol. 5, pp. 1247-1255).
[20]Ogherohwo, E. P., Egah, M. Y., & Patience, R. P. (2014). Prognostication of Radio Refractivity in Transmission Link: Diurnal and Seasonal Variation of Surface Refractivity Over Jos-Plateau State. International Journal of Advanced
Research in Physical Science (IJARPS), 1(8), 76-92.
[21]Corstanje, A., Bonardi, A., Buitink, S., Falcke, H., Hörandel, J. R., Mitra, P., ... & Schellart, P. (2017). The effect of the atmospheric refractive index on the radio signal of extensive air showers. Astroparticle Physics, 89, 23-29.
![Figure 1. The Graph of Relative Humidity, U(%) and Atmospheric Pressure, P[hPa] versus Refractivity Gradient, N for the month of January 2013](https://thumb-us.123doks.com/thumbv2/123dok_us/8756057.892911/4.595.72.523.445.724/figure-relative-humidity-atmospheric-pressure-refractivity-gradient-january.webp)
![Table 6. Model Performance I Respect of Validation Dataset From [18]](https://thumb-us.123doks.com/thumbv2/123dok_us/8756057.892911/6.595.73.527.455.732/table-model-performance-i-respect-validation-dataset.webp)
