Journal of Physics: Conference Series
PAPER • OPEN ACCESS
Site Classification using Multichannel Channel
Analysis of Surface Wave (MASW) method on Soft
and Hard Ground
To cite this article: M. A. M Ashraf et al 2018 J. Phys.: Conf. Ser. 995 012108
View the article online for updates and enhancements.
Related content
Predominant modes for Rayleigh wave propagation using the dynamic stiffness matrix approach
Tarun Naskar and Jyant Kumar
-Correlation of densities with shear wave velocities and SPT N values
P Anbazhagan, Anjali Uday, Sayed S R Moustafa et al.
-Shear wave velocity mapping of Hat Yai district, southern Thailand: implication for seismic site classification
Sawasdee Yordkayhun, Chedtaporn Sujitapan and Tanit Chalermyanont
1234567890 ‘’“”
ISMAP 2017 IOP Publishing
IOP Conf. Series: Journal of Physics: Conf. Series 995 (2018) 012108 doi :10.1088/1742-6596/995/1/012108
Site Classification using Multichannel Channel Analysis of
Surface Wave (MASW) method
on Soft and Hard Ground
M. A. M Ashraf1,N. S. Kumar1, R. Yusoh2 Z. A. M. Hazreek3 and M. Aziman3
1 School of Civil Engineering, Engineering Campus, Universiti Sains Malaysia, Penang, Malaysia 2 School of Physics, Universiti Sains Malaysia, 11800, Penang, Malaysia
3 Faculty of Civil and Environmental Engineering, Universiti Tun Hussein Onn, Malaysia, 86400, Batu
Pahat, Johor, Malaysia
Email: [email protected]
Abstract. Site classification utilizing average shear wave velocity (Vs(30) up to 30 meters depth is a typical parameter. Numerous geophysical methods have been proposed for estimation of shear wave velocity by utilizing assortment of testing configuration, processing method, and inversion algorithm. Multichannel Analysis of Surface Wave (MASW) method is been rehearsed by numerous specialist and professional to geotechnical engineering for local site characterization and classification. This study aims to determine the site classification on soft and hard ground using MASW method. The subsurface classification was made utilizing National Earthquake Hazards Reduction Program (NERHP) and international Building Code (IBC) classification. Two sites are chosen to acquire the shear wave velocity which is in the state of Pulau Pinang for soft soil and Perlis for hard rock. Results recommend that MASW technique can be utilized to spatially calculate the distribution of shear wave velocity (Vs (30)) in soil and rock to characterize areas.
1.Introduction
2
1234567890 ‘’“”
ISMAP 2017 IOP Publishing
IOP Conf. Series: Journal of Physics: Conf. Series 995 (2018) 012108 doi :10.1088/1742-6596/995/1/012108
different velocities. Raw waveforms recorded from geophones placed on the surface can be post-processed to estimate a velocity-frequency relationship (i.e., dispersion curve) that summarizes the dispersion at the site. This curve can then be used in an inversion algorithm to estimate the most probable subsurface stiffness profile capable of generating the measured dispersion curve. [6][7][8][9][10][11][12][13][14]
2.Study area description
This study was carried out by obtaining shear wave velocity from two different geological sites which is at Engineering Campus of Universiti Sains Malaysia (USM), Nibong Tebal, Pulau Pinang for soft soil data acquisition and at Campus Pauh, Universiti Malaysia Perlis (UNIMAP), Perlis for hard rock data acquisition.
2.1 Soft soil data acquisition site
[image:3.595.72.524.379.703.2]The site situated inside the USM Engineering campus which situated along the west cost of the peninsular Malaysia in the Nibong Tebal, South Seberang Prai, Pulau Pinang. As per the geology map of Peninsular Malaysia (Fig 1), the soil along the west shore comprises of marine and continental deposits, for example mud, residue, sand, and peat with minor gravel content. The exploration territory which situated inside the limit of Penang and Perak States was already a mangrove region. In view of the quaternary geology report, the exploration zone belongs to Gula Formation. The lithology of the Gula Formation is portrayed as sand, silt, dirt, clay, gravel, and a little measure of peat. Residue were fluvially kept in estuaries and littoral zones, which shallower decades back.
1234567890 ‘’“”
ISMAP 2017 IOP Publishing
IOP Conf. Series: Journal of Physics: Conf. Series 995 (2018) 012108 doi :10.1088/1742-6596/995/1/012108
2.2 Hard rock data acquisition site
The study area is in south bound of the Perlis state with two neighbouring towns, Changlun and Arau. The study area is situated close to the Syed Sirajuddin Areeb Putra Sports Complex, UNIMAP Kampus Pauh, Perlis.
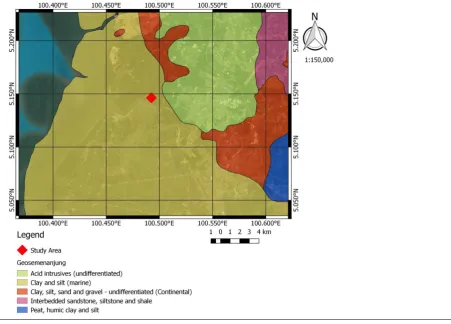
[image:4.595.70.523.274.596.2]Based on the Geological Map of Peninsular Malaysia (Fig 2), the lithology are limestone, shale, sandstone, and siltstone. From the quaternary geology report, the research area situated in Kubang Pasu formation. The Kubang Pasu formation is mainly composed of mudstone of various colours interbedded with quartz and feldspathic sandstone. There appears to be a continuous succession in Perlis, where clastic strata are sandwiched between Setul Group in the west (Setul boundary range) and the Chuping Hills in the east.
Figure 2. Geology of Perlis and north Kedah, Northwest of Peninsular Malaysia.
3.Methodology
4
1234567890 ‘’“”
ISMAP 2017 IOP Publishing
IOP Conf. Series: Journal of Physics: Conf. Series 995 (2018) 012108 doi :10.1088/1742-6596/995/1/012108
[image:5.595.81.509.560.636.2]seismic refraction method. The produced impact would generate surface waves, which would be detected by the geophones. The wave form appeared in the seismograph and scattering picture in the Rayleigh basic mode. The data acquisition parameters were summarized in Table 2 for active MASW.
Table 1. Set up of geophones according to spread configuration
Table 2. Active acquisition parameters.
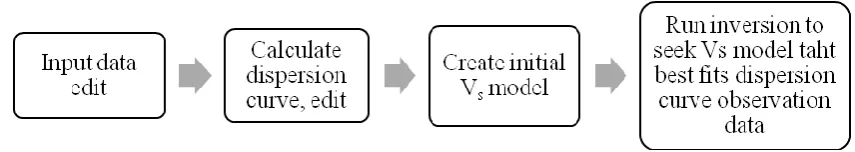
Acquired MASW data were processed and interpreted using SeisImager/SW software to determination of shear-wave velocity, Vs by developing the dispersion curve. The general data processing flows were summarized in three major steps: (i) filter the wiggle plot to the analysable range of frequency of R wave; (ii) develop the dispersion curve of R wave phase velocity and; (iii) inversion of the dispersion curve to obtain the Vs profiles. The filter and the development of dispersion curve process were carried out by using SeisImager/SW software. The general processing flows is shown in Figure 3.
Figure 3. General Data Processing Flow of MASW Method. (Geometrics, 2009)
4.Results and discussion
4.1 Soft soil
MASW is carried out to identify the subsurface profile of the study area indicated the Vs distribution.
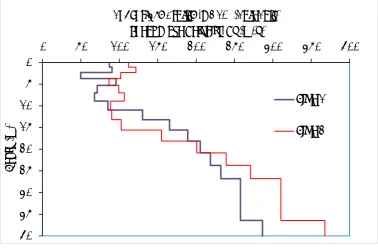
Shear wave velocity at USM were analysed by using the SeisImager software to produce the 1-D velocity profile. Figure 4 shows the 1-D shear velocity model obtained from the analysis.
Spread configuration Spacing (m) Offset (strike source) (m)
Linear with 24 geophones
1.5
5, 10, and 15 3
Parameter Settings
Spread configuration Linear Geophones interval 1.5 m and 3.0 m Total number of geophones 24 geophones Geophone type 4.5 Hz (Vertical) Nearest offset 5,10 and 15 m Source equipment 7.2 kg sledgehammer Sample interval 0.5 milliseconds
Record length 1 second
1234567890 ‘’“”
ISMAP 2017 IOP Publishing
IOP Conf. Series: Journal of Physics: Conf. Series 995 (2018) 012108 doi :10.1088/1742-6596/995/1/012108
0
5
10
15
20
25
30
35
40
0 50 100 150 200 250 300 350 400
D
epth
(m
)
Shear Wave Velocity, Vs (m/s)
Subsurface Profile In USM (Soft Soil)
Line 1
[image:6.595.108.487.104.354.2]Line 2
[image:6.595.122.477.411.621.2]Figure 4. 1-D shear velocity model for soft soil.
Table 3. Summary of MASW results.
Velocity (m/s) Material description
Table 3.12, Eurocode 8 Table 3.13, NEHRP Site class
50 - 360
Ground Type S1 = < 100, Deposit consisting of layer atleast 10m thick, of soft clay/silts with high plasticity index (P1>40) high water content.
Ground type C = 180 – 360, Deposit of dense or medium dense sand, gravel, or stiff clay with thickness from several tens to many hundreds of metres.
Class E = < 180, Soft clays
Class D = 180 – 360, Stiff Soil
4.2 Hard Rock
6
1234567890 ‘’“”
ISMAP 2017 IOP Publishing
[image:7.595.88.511.98.365.2]IOP Conf. Series: Journal of Physics: Conf. Series 995 (2018) 012108 doi :10.1088/1742-6596/995/1/012108
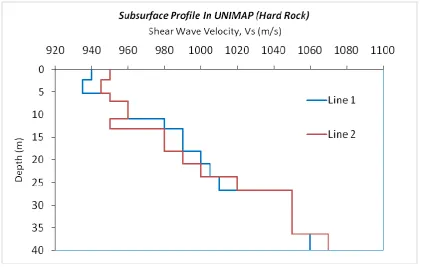
Figure 5. 1-D Shear velocity model for hard rock.
Table 4. Summary of MASW results.
Velocity (m/s) Material description
Eurocode 8 NEHRP Site class
900 - 1100 Ground type A = >800, Rock or other rock-like geological formation, including at most 5 m of weaker material at the surface.
Class B = 760 – 1500, Firm and hard rock
5.Conclusion
Site classification using Multichannel Analysis of Surface Wave as a geophysical method is possible for both soft and hard ground. The shear wave velocity obtained suing MASW method is representing the average of the velocity at specified death across the lateral length of the array. The results show that the subsurface can be classified using the MASW method which can be a good parameter for preliminary works and planning. Borehole or Cone penetration test can be used to validate the results obtained. MASW method has the potential to adapt in subsurface investigation to compliment the intrusive.
Acknowledgements
The authors express their appreciation for the Universiti Sains Malaysia Research University Grant
(1001/PAWAM/814192) for the financial support for this research.
References
[1] Sabatini P J, Bachus R C, Mayne P W, Schneider J A and Zettler T E 2002 Geotechnical engineering circular no. 5: evaluation of soil and rock properties, FHWA-IF-02-034 p 365 [2] Kockar K M 2006 Engineering Geological and Geotechnical Site, Middle East Technical
University
[image:7.595.122.476.401.521.2]1234567890 ‘’“”
ISMAP 2017 IOP Publishing
IOP Conf. Series: Journal of Physics: Conf. Series 995 (2018) 012108 doi :10.1088/1742-6596/995/1/012108
refraction and surface wave methods: a case of Lagos State University, Ojo, Lagos State
Arab. J. Geosci., 6(12), p 4925–4930
[4] Garofalo F, Foti S, Hollender F, Bard P Y, Cornou C, Cox B R, Ohrnberger M, Sicilia D, Asten M, Di Giulio G and Forbriger T 2016 InterPACIFIC project: Comparison of invasive and non-invasive methods for seismic site characterization. Part I: Intra-comparison of surface wave methodsSoil Dyn. Earthq. Eng.82 p 222–240
[5] Pegah E and Liu H 2016 Application of near-surface seismic refraction tomography and multichannel analysis of surface waves for geotechnical site characterizations: A case study
Eng. Geol.208 p 100–113
[6] Park C B, Miller R D and Xia J 1999 Multichannel analysis of surface waves Geophysics64(3) p 800-808
[7] Park C B, Miller R D, Xia J and Ivanov J 2007 Multichannel analysis of surface waves (MASW)—active and passive methods Lead. Edge, 26(1) p 60–64
[8] Kaufmann, Ronald and Taylor C 2002 Geophysical survey for the proposed Atlantic Crossing Bridge Panama Canal, Republic of Panama
[9] Ólafsdóttir E Á 2016 Multichannel Analysis of Surface Waves for assessing soil stiffness (Doctoral dissertation)
[10] Strobbia 2002 Surface wave method: acquisition, processing and inversion. Politecnico di Torino
[11] Ariffin J, Ismail M A, Tan C and Murtadza N M 2016 Site Characterization of Marine Clay Deposits in South Seberang Prai, Penang using Combined Active and Passive Multichannel Analysis of Surface Wave (MASW) IOP Conf. Ser. Mater. Sci. Eng136 p 012032
[12] Anbazhagan P and Sitharam T G 2008 Site Characterization and Site Response Studies Using Shear Wave Velocity Journal of Seismology and Earthquake Engineering 10(2) p 53–67 [13] Thitimakorn T 2013 Development of a NEHRP site classification map of Chiang Mai city,
Thailand, based on shear-wave velocity using the MASW technique J. Geophys. Eng10(4) p. 45007
[14] Madun A, Supa’at M E, Tajudin S A, Hazreek M, Sani S and Yusof M F 2016 Soil investigation using Multichannel Analysis of Surface Wave (MASW) and borehole ARPN J.