Copyright © 2004, American Society for Microbiology. All Rights Reserved.
Comparative Analysis of Gtf Isozyme Production and Diversity in
Isolates of
Streptococcus mutans
with Different Biofilm
Growth Phenotypes
Renata O. Mattos-Graner,
1* Marcelo H. Napimoga,
1Kasuo Fukushima,
2Margaret J. Duncan,
3and Daniel J. Smith
4Department of Microbiology and Immunology, Piracicaba School of Dentistry, University of Campinas, Sa˜o Paulo,
Brazil1; Department of Microbiology, School of Dentistry at Matsudo, Nihon University, Chiba, Japan2; and
Departments of Molecular Genetics3and Immunology,4The Forsyth
Institute, Boston, Massachusetts
Received 2 March 2004/Returned for modification 13 April 2004/Accepted 10 June 2004
Streptococcus mutansis the main pathogenic agent of dental caries. Glucosyltransferases (Gtfs) produced by these bacteria are important virulence factors because they catalyze the extracellular synthesis of glucans that are necessary for bacterial accumulation in the dental biofilm. The diversity of GtfB and GtfC isozymes was analyzed in 44 genotypes of S. mutans that showed a range of abilities to form biofilms in vitro. Several approaches were used to characterize these isozymes, including restriction fragment length polymorphism analysis of the gtfB and gtfC genes, zymographic analysis of the identified GtfB and GtfC genotypes, and quantitation of isozyme production in immunoblot experiments with specific monoclonal antibodies. A high diversity ofgtfgenes, patterns of enzymatic activity, and isozyme production was identified among the isolates tested. GtfC and, to a lesser extent, GtfB were produced in significantly higher amounts by strains that had high biofilm-forming ability than by strains with low biofilm-forming ability. Biofilm formation was indepen-dent of the GtfB and GtfC genotype. Atypical strains that showed an apparent single Gtf isozyme of interme-diate size between GtfB and GtfC were also identified. The results indicate that various expression levels of GtfB and GtfC isozymes are associated with the ability of distinctS. mutansgenotypes to grow as biofilms, strengthening the results of previous genetic and biochemical studies performed with laboratory strains. These studies also emphasize the need to identify factors that controlgtfgene expression.
Streptococcus mutansis the major pathogen of dental caries.
One of its most intensively studied virulence factors is the ability to synthesize extracellular water-insoluble glucan from sucrose through the activity of secreted glucosyltransferases (Gtf), leading to bacterial accumulation in the dental biofilm. Three distinct Gtfs (GtfB, GtfC, and GtfD) were demon-strated to participate in the sucrose-dependent adherence pro-cess (16, 23, 26). Antibodies raised against Gtfs have been shown to protect against dental caries in animal models (18, 21). Gtfs have also been incorporated into vaccines used in human clinical trials (3, 19, 20). GtfB and GtfC enzymes are encoded by highly homologous genes that are organized in a sequential operon-like fashion (17, 24). These two Gtfs are involved in the synthesis of water-insoluble␣(1-3)-rich glucans (17, 24). A third isotype, GtfD, shows less homology with GtfB and GtfC and is encoded by a gene located elsewhere in the chromosome. This enzyme catalyzes the synthesis of water-soluble␣(1-6)-rich glucans (8).
Genes coding for each Gtf isozyme have been inactivated, and the resulting mutant strains were analyzed for sucrose-dependent adherence in vitro and cariogenicity in animal mod-els. These studies indicated that GtfB and GtfC have the
high-est association with virulence (16, 26). We have shown that there is significant variability in the ability to form biofilms in vitro among a large group of clinical isolates containing distinct
S. mutansgenotypes and have suggested that these variations
may be associated with differential expression of proteins in-volved in the accumulation phase of biofilm growth (12).
A study of distinct genotypes that vary in biofilm growth may help us to understand how virulence factor expression is re-lated to the ability of S. mutans to accumulate in the dental biofilm and ultimately help to explain the differences in caries activity observed amongS. mutans-infected children (11). To-ward these goals, in this study, we characterized Gtf isozymes with respect togtfgene polymorphisms and enzyme production and activity patterns in a large number of clinical isolates which differ in their abilities to grow as biofilms. The results of our study indicate that S. mutansbiofilm formation is influenced more by the amounts of GtfC and GtfB produced than by the inherentgtfgene polymorphisms, suggesting that factors that control expression of GtfB and GtfC may account for differ-ences in virulence among infectingS. mutansstrains.
MATERIALS AND METHODS
Bacterial strains and growth conditions.A total of 76S. mutansisolates included in this study were obtained from 35 young children (11) and included 44 distinctS. mutansamplitypes, as previously determined by AP-PCR (13). Lab-oratory strains wereS. mutansSJ32, UA130 (ATCC 700611), and GS5 (kindly provided by H. K. Kuramitsu, State University of New York).S. mutansstrains were grown in either Todd-Hewitt broth (THB; Difco), brain heart infusion
* Corresponding author. Mailing address: Faculdade de Odontolo-gia de Piracicaba—UNICAMP, Departamento de MicrobioloOdontolo-gia e Imunologia, Av. Limeira, 901, CEP 13414-018 Piracicaba, SP, Brazil. Phone: 55 19 3412 5379. Fax: 55 19 3412 5218. E-mail: rmgraner @fop.unicamp.br.
4586
on May 15, 2020 by guest
http://jcm.asm.org/
(Difco), or chemically defined medium (CDM) under anaerobic conditions (10% H2, 10% CO2, 80% N2) or in candle jars.
DNA isolation.S. mutanschromosomal DNA was isolated by using a Master-Pure DNA purification kit from Epicentre Technologies (Madison, Wis.) as described by the manufacturer.
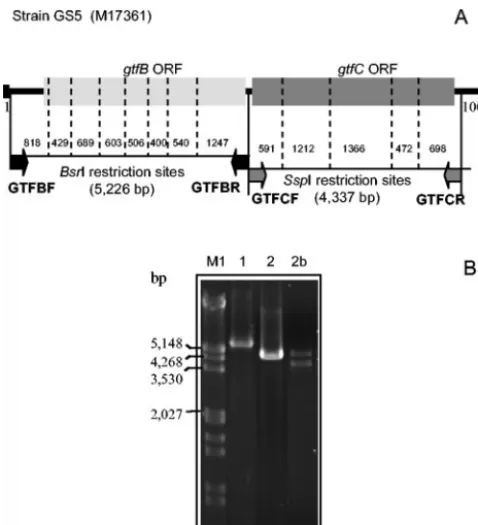
PCR-RFLP analysis ofgtfBandgtfC.Polymorphisms ofgtfBandgtfCgenes were identified by PCR-restriction fragment length polymorphism (RFLP) in the 44S. mutansamplitypes and in strains SJ32, UA130, and GS5. Seven additional isolates of duplicate amplitypes were also included to check agreement between RFLP patterns ofgtfgenes andS. mutansAP-PCR identity, giving a total of 51 isolates tested. SincegtfBandgtfCsequences are sequentially arranged in the chromosome and are highly homologous (76% amino acid sequence identity), primer sets used for independent amplification ofgtfB andgtfCincluded a nonconserved region located between the GtfB and GtfC open reading frames. The sequence used for primer design was obtained fromS. mutansstrain GS5 (GenBank accession number M17361). Figure 1 shows primer locations and restriction maps of thegtfBandgtfCamplicons. Amplification ofgtfBwith the specific primers GTFBF (5⬘-CAAAGATGAAGAAGCAGTAAT-3⬘) and GTFBR (5⬘-TTCTATAACAAAAGCACAATG-3⬘) yielded amplicons of 5.2 kb. Amplicons of 4.3 kb, corresponding togtfC, were obtained with primers GTFCF (5⬘-TTGGAGGAAATATGGAAAAG-3⬘) and GTFCR (5⬘-GTCTAAAACGA ACAGCACT-3⬘). Amplification reactions were performed with a polymerase enzyme system specific for the generation of long PCR products (Advantage2; Clontech Labs, Inc.). The PCR included 23 cycles of denaturing at 95°C (30 s), annealing at 59°C (1 min), and extension at 70°C (2 min). The restriction en-zymes BsrI and SspI were selected for RFLP analysis of the gtfB andgtfC
amplicons, respectively, since restriction maps indicated that these enzymes give the highest number of cleavage sites and yielded fragments suitable for electro-phoretic separation. Fragments of digestedgtfBandgtfCamplicons were sepa-rated by electrophoresis at 5 V/cm for 3 h in 3 and 2% low-melting-point agarose
gels (GTG; Novagen), respectively, in 0.5⫻Tris-borate-EDTA. Gels were then stained with ethidium bromide.
Measurement of GtfB, GtfC, and GtfD produced in culture fluids.After overnight growth in CDM, bacterial suspensions were adjusted to the same optical density (A550) so that the same size inocula were added to fresh CDM (4
ml) containing 10 M hydrochloride 4-(2-aminoethyl)-benzolsulfonylfluoride (AEBSF) (Roche Diagnostics, Indianapolis, Ind.) (12). After growth for 18 h, final absorbances of cultures (A550) were measured and cells were pelleted from
2 ml of culture. The supernatant was filtered through a 0.22-m-pore-size filter membrane (Spin-X; Costar, New York, N.Y.) and immediately frozen at⫺70°C. Fifty microliters of sample was diluted twofold in 0.02 M sodium phosphate buffer (pH 6.8) and applied to nitrocellulose membranes (Bio-Rad, Foster City, Calif.), as described elsewhere, by using a dot blot apparatus (Bio-Rad) (12). Membranes were blocked overnight in 100 mM Tris-HCl, 2.5 mM NaCl (pH 7.5), and 5% nonfat milk, followed by incubation with monoclonal antibodies (MAbs) P72 (anti-GtfB), P32 (anti-GtfC), and P4 (anti-GtfD) (5) at dilutions of 1:60, 1:30, and 1:60, respectively, in the blocking buffer. Following 2 h of incubation at room temperature with MAbs or the blocking buffer (negative control), mem-branes were washed four times with 100 mM Tris buffer containing 0.25% Tween, pH 7.5. Incubation with goat anti-mouse immunoglobulin G conjugated with horseradish peroxidase (Amersham Biosciences, Piscataway, N.J.) was then performed at room temperature for 2 h. Membranes were washed four times with 100 mM Tris buffer containing 0.25% Tween and drained, and immunolog-ical reactions were developed by using the ECL-plus system (Amersham). In-tensities of dot blot reactions were quantified with ImageQuant software (Mo-lecular Dynamics) from digital images of membranes exposed to X-ray films. Samples of all strains were blotted to the same membrane for direct comparison, and the immunoassay was repeated at least twice. The intensities of dot blots were normalized according the final absorbance (A550) of the respective culture
to minimize the effect of varying growth rates. TheA550values ranged from 1.30
to 1.69 (mean⫾standard deviation [SD], 1.49⫾0.11).
Analysis of GtfB and GtfC activity patterns in zymographic assays.To com-pare the patterns of GtfB and GtfC enzyme activity among the distinct RFLP classes ofgtfBandgtfC, 3 or more strains representative of eachgtfBandgtfC
genotype identified were randomly selected from the 51 strains analyzed. These strains represented a subset of 34 clinical isolates. Briefly, the samples of culture fluids were obtained from 18-h cultures grown in 4 ml of brain heart infusion during incubation in candle jars. These cultures had been inoculated with an adjusted inoculum size of 18-h cultures from frozen stocks prepared under the same conditions. The final absorbance (A550) of cultures used for enzyme
anal-ysis was measured again to check for variations in growth (mean⫾SD, 0.89⫾ 0.10; range, 0.71 to 1.05). Bacterial cells were removed from 3 ml of culture by centrifuging twice at 4°C (1,385⫻g, 3 min). Culture supernatants were dialyzed at 4°C against 0.02 M sodium phosphate buffer, pH 6.8, containing 10M phenylmethylsulfonyl fluoride, followed by dialysis against 0.2 mM sodium phos-phate containing 10 M phenylmethylsulfonyl fluoride, a protease inhibitor. After dialysis, samples were concentrated 100-fold by lyophilization. To prepare for electrophoresis, 7.5l of each concentrated culture fluid was resuspended in 2⫻Laemmli buffer (1:1), boiled for 1 min, and applied to sodium dodecyl sulfate (SDS)–6% polyacrylamide gels by using the mini-Protean II system (Bio-Rad). GtfB and GtfC enzyme activities were analyzed in simultaneously run qua-druplicate SDS–6% polyacrylamide gel electrophoresis (PAGE) gels. The first gel was used for protein detection by staining with Coomassie blue. The second gel was used for the zymogram assay. Proteins separated in the other two gels were transferred to nitrocellulose membranes for detection of the corresponding GtfB and GtfC isozymes in Western blot assays performed with MAbs P72 (anti-GtfB) and P32 (anti-GtfC), respectively.
For zymogram analysis, following electrophoretic separation, gels were washed twice for 15 min each with renaturing buffer containing 2.5% Triton X-100. Gels were then incubated for 18 h at 37°C with 0.2 M sodium phosphate buffer (pH 6.5) containing 0.2% dextran T70 and 5% sucrose. The reactions were stopped by washing gels with distilled water at 4°C for 10 min, and digital images of the resulting white opaque glucan bands, synthesized by Gtf within the gels, were captured by using a black background to enhance visibility.
[image:2.603.43.282.68.330.2]Western blot analyses of GtfB and GtfC from electrophoretic separation of culture supernatants were performed as described above for the dot blot assay, except that MAbs P72 and P32 were used at 1:200 dilutions. The antibody-reactive GtfB and GtfC bands were detected by using the horseradish peroxi-dase-conjugated goat anti-mouse immunoglobulin G reagent followed by the ECL system (Amersham). The relationships of antibody-stained Gtf bands to the corresponding glucan bands observed in zymograms were confirmed by measur-ing the distances of antibody-recognized bands from prestained molecular size markers (Gibco BRL, Carlsbad, Calif.), which were included in separate lanes of
FIG. 1. Chromosome locus of the GS5 strain containing thegtfB
and gtfC genes (GenBank accession number M17361). (A) Primer pairs used for specific amplification ofgtfBandgtfCgenes are repre-sented as black and shaded arrows, respectively. The restriction sites of the 5.2-kb gtfB and 4.3-kb gtfC amplicons are represented by the dashed lines; within them, the size of fragments are indicated. (B) PCR products obtained with the GTFBF-GTFBR (lane 1) and GTFCF-GTFCR (lane 2) primer pairs. In 18 isolates, efficient amplification of thegtfC genes was not obtained. Instead, PCRs yielded two weaker products as shown in lane 2b. Thus, RFLP analysis ofgtfCcould not be performed with these 18 strains. ORF, open reading frame.
on May 15, 2020 by guest
http://jcm.asm.org/
all gels. Intensities of the zymographic and Western blot bands were obtained from digital images captured by a scanning densitometer (Bio-Rad GS-700 imaging densitometer). To control for interassay variability, intensities of the principal glucan and protein bands of all isolates tested were divided by the intensity of a control strain (3VF2) used in all the experiments.
Biofilm formation in microtiter plates.Biofilm growth in microtiter plates was initiated from 1:100 dilutions of 18-h THB cultures transferred into fresh me-dium. THB contains trace amounts of sucrose, thus providing the substrate for Gtf activities (7). Briefly, after incubation, planktonic cells were removed by washing and the biofilms were stained with a 1% aqueous solution of crystal violet. The absorbances of crystal violet dissolved from ethanol treatment of the stained biofilms (A575) and of planktonic cultures grown under the same
condi-tions (A550) were measured.
Statistical analysis.Pearson correlation analyses were used to evaluate asso-ciations between production of GtfB, GtfC, and GtfD (normalized according to the A550of the tested cultures) and biofilm or planktonic growth amongS.
mutansamplitypes. Means of glucan band intensities were compared among the PCR-RFLP patterns identified for their respective Gtf isozyme by the Kruskal-Wallis U test.
RESULTS
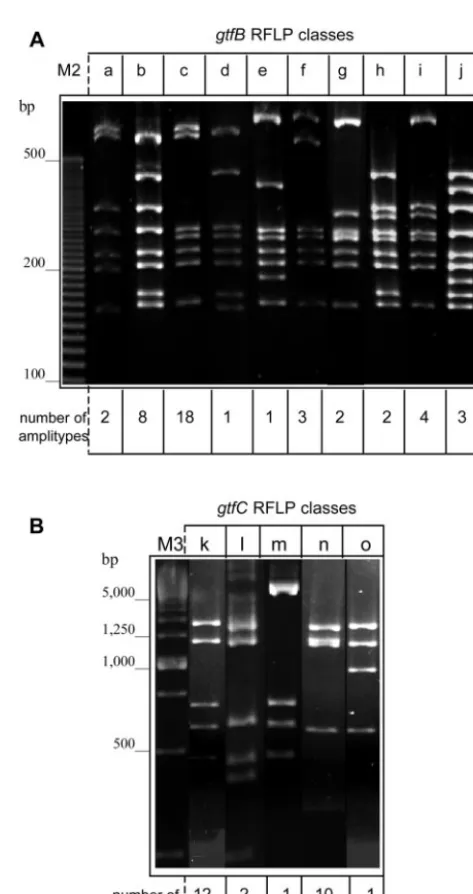
[image:3.603.301.538.59.506.2]Polymorphisms of gtfB and gtfC genes and zymographic patterns. Significant genetic diversity was identified in both gtfBandgtfCgenes. Figure 2 illustrates the distinct represen-tative classes ofgtfB(Fig. 2A) andgtfC(Fig. 2B) genes iden-tified in the RFLP analysis. The frequencies of each RFLP class among the 44S. mutansamplitypes tested are also shown (Fig. 2). ThegtfBRFLP class b was, as predicted, the pattern identified in strain GS5. This same gtfB genotype was also identified in strain SJ32 and in 8 clinical amplitypes (18.2%). ThegtfBRFLP class c was the most frequently detected geno-type, observed in 40.9% of the clinical amplitypes (n⫽18) and in UA130. Only strains 3SN1, 2SN3, and 4SM1 reflectedgtfB RFLP class f. PCR products corresponding to the 4.3-kbgtfC gene were not efficiently generated in 18 strains, although GtfC was recognized by the appropriate MAb (MAb P32) in the immunological analysis. Thus, the gtfC RFLP patterns were analyzed in 26 clinical amplitypes. Class k was the most fre-quently identified gtfC genotype (n ⫽ 12) and was also ob-served in strain GS5. The gtfC RFLP class n genotype was detected in strain SJ32 and 10 other distinct S. mutans amplitypes.
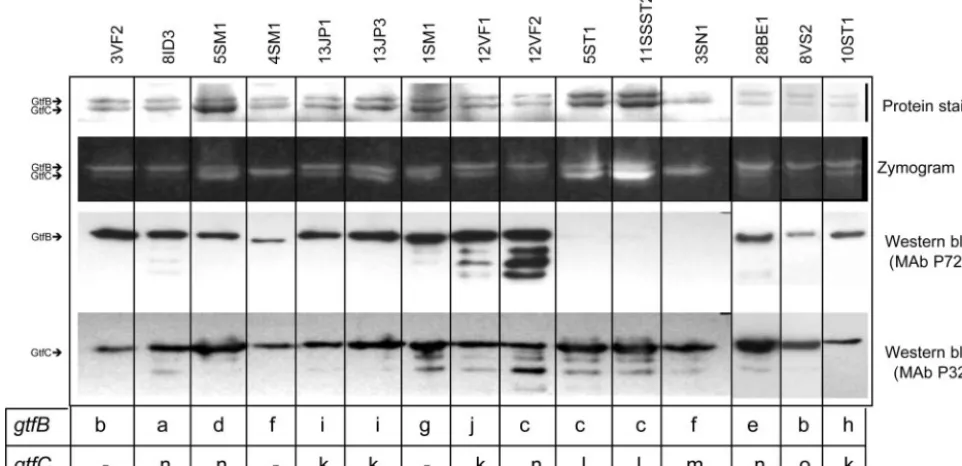
Figure 3 shows representative protein, zymogram, and West-ern blot pattWest-erns of Gtf isozyme activities identified in the 34 strains that demonstrated distinctgtfBandgtfCRFLP classes. Strains 3SN1 and 4SM1 showed atypical patterns of Gtf activ-ity, with an apparent single glucan-synthesized band of inter-mediate size between the commonly detected GtfB (165.8 kDa) and GtfC (153 kDa) correspondent glucan bands. Three other strains, 17A2, 2SN3, and 12JP3 (data not shown), also showed this single band pattern. As in strain 3SN1 (Fig. 3), strain 2SN3 did not produce detectable levels of GtfB in the immunological assays (see below). Similar to 4SM1 (Fig. 3), other strains (17A2 and 12JP3) showed detectable levels of GtfB, although the anti-GtfB MAb P72 reactions in Western blot analysis of these strains were with a protein that migrated more rapidly than typically seen for GtfB.
Strains that did not demonstrate GtfB reactivity by Western blot analyses (e.g., 5ST1, 11SSST2, and 3SN1) (Fig. 3) did not contain cell-associated protein, as observed in Western blot assays with cell extracts (data not shown). There was general agreement betweengtfpolymorphisms and Gtf production pat-terns when strains representing the same amplitype (AP-PCR
profile) were compared, indicating that the genetic and phe-notypic traits of the Gtf expressed were related to the genetic background of the isolates tested. Intensities of Gtf-related glucan bands, adjusted by the A550 of the applied cultures ranged from 0.44 to 2.30 for GtfB (mean⫾SD, 1.09⫾0.49) and from 0.71 to 9.64 for GtfC (mean⫾SD, 2.00⫾1.83). No significant differences in activity were detected when glucan band intensities were compared among distinctgtfB (Kruskal-Wallis,P⫽0.651) andgtfC(Kruskal-Wallis,P⫽0.091) RFLP classes.
Comparisons of Gtf production andgtfgene polymorphisms with biofilm growth. Relative amounts of secreted Gtf isozymes quantified by immuno dot blot analysis were quite variable among the 44S. mutans amplitypes tested. Relative
FIG. 2. (A) Ten distinct RFLP classes of thegtfBamplicon (a to j) were detected by BsrI digestion among the clinical strains analyzed. (B) Patterns of RFLP identified by SspI digestion ofgtfCamplicons (k to o).
on May 15, 2020 by guest
http://jcm.asm.org/
amounts of GtfB, expressed as the intensities of dot blot reac-tivities, normalized by theA550of the cultures tested, ranged from 0 to 131 arbitrary units (U) (mean⫾SD, 54.8⫾44.1 U). Relative amounts of GtfC ranged from 19.2 to 80.7 U for GtfC (mean ⫾ SD, 50.2 ⫾ 16.8 U). For GtfD, relative amounts ranged from 4.5 to 72.7 U (mean ⫾ SD, 20.7 ⫾ 15.2 U). Relative amounts of GtfB produced were associated with amounts of GtfC in a high proportion of amplitypes studied (Pearson correlation, r ⫽ 0.49, P ⬍ 0.001) but not with amounts of GtfD (r⫽0.01;P⫽0.95). Amounts of GtfC also were not associated with amounts of GtfD (r⫽0.07;P⫽0.62). To investigate the influence of varying production of Gtf isozymes from clinical isolates on their ability to grow as bio-films, the relative amounts of GtfB, GtfC, and GtfD produced were compared to biofilm growth measurements (Fig. 4). Rel-ative amounts of GtfC produced by the 44 amplitypes were significantly associated with the ability of these strains to grow as biofilms (Pearson correlation,r⫽0.36,P⬍0.02). Amounts of GtfB expressed were also associated with biofilm formation, although to a lower extent than those of GtfC (Pearson cor-relation, r ⫽ 0.31, P ⬍ 0.05). An inverse relationship was observed between amounts of GtfD produced and biofilm growth (Pearson correlation,r⫽ ⫺0.33,P⬍0.05). Planktonic growth was not related to levels of Gtf isozyme production (GtfB,r⫽ ⫺0.39,P⫽0.01; GtfC,r⫽ ⫺0.48,P⫽0.76; GtfD, r⫽0.20,P⫽0.20).
Comparisons of gtf polymorphisms with biofilm growth showed no clear differences in means of biofilm intensities between amplitypes carrying distinctgtfBand gtfCgenotypes. The fiveS. mutans amplitypes expressing an apparent single
Gtf synthesizing glucan band of intermediate size between GtfB and GtfC showed low biofilm formation, with crystal violet intensities (A575) ranging from 0.16 to 0.35 (mean, 0.26; SD, 0.07).
DISCUSSION
The production and activity of S. mutans Gtfs and their association with virulence has been studied extensively in lab-oratory strains (16, 18, 23, 26). Mutants ofgtfB,gtfC, orgtfD from strain UA130 showed a significantly lower potential to induce caries on smooth tooth surfaces in animal models when compared to the wild type, suggesting that all Gtf isozymes are important for colonization and caries induction (26). However, analyses of GS5 mutants carrying different combinations ofgtf gene deletions indicated that GtfB and GtfC were important in sucrose-dependent adhesion in vitro while deletion of GtfD had only a modest effect (23). The gtfC mutations in GS5 caused the largest decrease in adherence in vitro (23). Since these studies suggested that differential expression ofgtfgenes may be related to phenotypic expressions of virulence, we explored the potential variability in the expression and activity of Gtf isotypes in a large group of clinicalS. mutans isolates that had successfully colonized young children but differed in in vitro biofilm growth.
[image:4.603.51.532.76.309.2]Previously, we compared both sucrose-dependent adherence on glass surfaces and Gtf activities among clinical strains iso-lated from young children who exhibited large differences in caries activity and established that children with high caries activity were often infected by strains showing significantly
FIG. 3. Representative patterns of Gtf isozyme production and activities analyzed in clinical isolates representative of thegtfB andgtfC
genotypes identified by RFLP. GtfB and GtfC were electrophoretically separated on quadruplicate SDS–6% PAGE gels and then analyzed for protein by Coomassie staining, for glucan production after incubation of gels with sucrose, and immunologically for GtfB and GtfC in Western blots developed with MAb P72 or MAb P32, respectively. Strains are indicated above each lane. RFLP classes ofgtfBandgtfCamplicons are shown beneath each lane. Note that strains 4SM1 and 3SN1 presented a glucan-synthesized band of intermediate size between the typical GtfB- and GtfC-related glucan bands. Strains 5ST1 and 11SSST2, representative of a singleS. mutansamplitype, did not display detectable levels of GtfB.
on May 15, 2020 by guest
http://jcm.asm.org/
higher amounts of glucan synthesis compared to strains infect-ing caries-free children (14). The results suggested that diver-sity in Gtf expression or specific activity may be associated with the level of cariogenicity. However, analyses of specific Gtf isozymes were not performed (14).
The expression patterns of GtfB, GtfC, and GtfD were char-acterizedy using isozyme-specific MAbs (5, 22). This is the first
study that characterized Gtf isozymes in a large number of clinical isolates, and the results support the notion that differ-ences in expression of GtfB and GtfC are associated with the ability of the organism to form biofilms. The relationships between amounts of each Gtf isotype secreted with amounts of biofilm is consistent with the phenotypic traits observed ingtfB, gtfC, andgtfDmutants, supporting a pronounced role for GtfC in adherence (23). Contrary results have been observed with respect to the individual participation of GtfD in the virulence phenotype (23, 26). We found the amplitypes with the highest biofilm growth showed the lowest amounts of GtfD produc-tion, which may explain the lack of association observed be-tween amounts of total secreted Gtfs and biofilm growth pre-viously reported (12).
In the present study, no relationship was detected between specificgtfCgenotypes and amounts of GtfC produced, which concurred with the assumption that differences in GtfC amounts were indeed due to variation in expression levels rather than togtfCpolymorphisms. Five atypical strains (3SN1, 2SN3, 4SM1, 17A2, and 12JP3) showed a GtfB/C intermediate size glucan band and a low level of biofilm growth (A575from 0.16 to 0.35). The Western blot patterns of these strains were similar to those previously observed with the strain UA101 (27). The intermediate size Gtf of UA101 had been suggested to be a product of homologous recombination ofgtfBwithgtfC in the UA101 ancestor (27).
Although an important role for GtfB and GtfC in the viru-lence of S. mutanswas defined, the mechanisms that control expression of these proteins are poorly understood. For most genotypes analyzed in this study, the amounts of GtfB were positively associated with the amounts of GtfC expressed (Pearson correlation, r ⫽ 0.49, P ⬍ 0.001), supporting the notion that gtfB and gtfCgenes are part of an operon (29). However, several high GtfC producers showed no detectable GtfB (3SN1, 2SN3, 5ST1, and 11SSST1), a finding which is consistent with independent transcription of these genes, as proposed in other studies (6). Isolates 5ST1 and 11SSST3 showed no detectable levels of GtfB in immunological assays, although a glucan band of migration similar to that synthesized by the GtfB isozyme was detected (Fig. 3). These apparently GtfB-related glucan bands could, however, be the consequence of GtfD activities because this latter isozyme has a molecular mass of approximately 160 kDa and may not have adequately separated from GtfB on the SDS–6% PAGE gels (Fig. 2). Another possible explanation for GtfB-like glucan bands in strains with no detectable GtfB in Western blots is that the GtfB isozymes produced by these strains were not recognized by the MAb P72, although theirgtfBgenes were of RFLP class c, the same as identified in high GtfB producers (Fig. 3). Sequence analysis of the whole gtflocus in these atypical S.
mutansamplitypes may help to resolve these anomalies.
Measurement of glucan band intensities should be an indi-rect measurement of Gtf expression. However, zymograph variations were not always related to Western blot intensities (Fig. 3). The similar sizes of the Gtf isotypes made it difficult to determine the precise location of glucan-related bands, even when parallel Western blot assays were probed with specific MAbs. Despite this limitation, the relative amounts of glucans synthesized, which corresponded to the migration position of either GtfB and GtfC, were positively associated with biofilm
FIG. 4. Distribution of Gtf isozyme production and biofilm growth in 44S. mutansamplitypes. The relative amounts of Gtf produced were expressed as the intensities of the immunological dot blot reactions adjusted for theA550of the cultures tested. Biofilm growth was
ex-pressed as the A575 of ethanol-eluted crystal violet of the stained
biofilms. A significant positive association was observed between amounts of GtfB (A) and GtfC (B) produced and biofilm formation. No positive association was detected between amounts of GtfD and biofilm growth (C).
on May 15, 2020 by guest
http://jcm.asm.org/
growth in a subset of 29 strains (data not shown). The five atypical strains that synthesized single glucan bands were not included in these analyses. Variations in migration patterns, enzymatic kinetics, or protein degradation could influence zy-mographic results. For example, we cannot exclude the possi-bility that some glucan bands, which were associated with GtfC because of their migration position, could result from de-graded GtfB that retained activity but migrated faster.
Given the high number of polymorphisms identified in the gtfgenes, we presumed that different Gtfs may vary in their enzymatic kinetics, although no specific gtfgenotypes were related to low or high enzymatic activity measured in zymo-grams. Polymorphisms in gtf genes have been described among isolates from other populations (1, 2, 4), including several that encode silent mutations that have no effect on isozyme activity (2). The gtfB RFLP class c was the most common genotype, followed by class b, which included the laboratory GS5 strain. The majority of clinical isolates also demonstrated gtfC of pattern k, the same as identified in GS5. Previous sequence comparison of the gtfB and gtfC genes between five clinical isolates and the GS5 laboratory strain have indicated several frameshift mutations in the gtfBandgtfCgenes in GS5 which accounted for changes in the protein sequence (4). Besides the five atypical strains observed in the present study, no other clear influence ofgtf gene polymorphism on isozyme production, activity pattern, or biofilm growth were observed. Thus, the results indicate that the amount of Gtf isozyme produced is more important to biofilm growth thangtfgene polymorphism. The positive associations of GtfB/C production with biofilm formation in vitro, determined from the large number of clinical isolates tested, suggests that further studies are required to eluci-date mechanisms that regulate the expression of these isozymes. It is noteworthy that other factors could contrib-ute to the variability in the amounts of Gtfs produced. For example, strains could differ in the affinities of their ex-pressed Gtfs for the cell surface. We have only quantified Gtfs in culture fluids, since it has been shown that essentially all Gtf is released into the supernatant when strains are grown in non-sucrose-containing medium (7). Also, differ-ences in the turnover of extracellular proteins cannot be excluded.
Experiments with strains GS5 and UA130 with reporter genes fused to the promoter sequences ofgtfB/Cindicated that the expression of thesegtfgenes is enhanced in bacteria grow-ing as biofilms compared to planktonic growth (9, 25, 29). The amounts of Gtf that we quantified were from culture superna-tants of planktonic cultures, and its relationship with biofilm growth suggests an intrinsic diversity in expression. Chloram-phenicol acetyltransferase gene fusions performed with twoS.
mutansvariant strains that diverged in the production of
sev-eral proteins involved in virulence indicated that differences in the production of GtfC and GtfB were due to transcriptional activities of their respectivegtfgenes. Since no relationships to gtfB/Cpromoter region polymorphisms were identified, other factors controlling multiple virulence gene expression were suggested (28). In the present study, sequencing of promoter regions of the strains with divergent expression of GtfB and GtfC may shed new light on this question. A peak of expression ofgtfBandgtfCgenes was observed at the beginning of the log
phase in planktonic cultures, suggesting that a cell density-dependent intercell communication system may play a role in regulating expression of gtfB/C genes (6). Since the biofilm growth phenotype was also shown to be regulated by such cell density-dependent systems (10, 15), factors important for bio-film growth which affect the expression of gtfgenes were hy-pothesized (9). Alternatively, independent factors controlling gtfexpression may increase the ability of distinct genotypes to grow and accumulate in the biofilm phase. Comparative tran-scriptional profiling or differential display analysis between the clinical strains described herein which exhibit highly divergent patterns of Gtf isozyme production may reveal factors involved in the regulation ofgtfgenes.
ACKNOWLEDGMENTS
This study was supported by Fundac¸a˜o de Amparo a` Pesquisa do Estado de Sa˜o Paulo (FAPESP) grant 02/07156-1 and Public Health Service grant R37 DE-06153 (NIDCR). R.O.M-G. is also supported by Coordenac¸a˜o de Aperfeic¸oamento de Pessoal de Nível Superior (CAPES), ProDoc 028/03-7.
REFERENCES
1. Chia, J. S., T. Y. Hsu, L. J. Teng, J. Y. Chen, L. J. Hahn, and C. S. Yang.
1991. Glucosyltransferase gene polymorphism amongStreptococcus mutans
strains. Infect. Immun.59:1656–1660.
2. Chia, J. S., S. W. Lin, T. Y. Hsu, J. Y. Chen, H. W. Kwan, and C. S. Yang.
1993. Analysis of a DNA polymorphic region in thegtfBandgtfCgenes of
Streptococcus mutans. Infect. Immun.61:1563–1566.
3. Childers, N. K., S. S. Zhang, and S. M. Michalek.1994. Oral immunization of humans with dehydrated liposomes containingStreptococcus mutans glu-cosyltransferase induces salivary immunoglobulin A2 antibody responses. Oral Microbiol. Immunol.9:146–153.
4. Fujiwara, T., Y. Terao, T. Hoshino, S. Kawabata, T. Ooshima, S. Sobue, S. Kimura, and S. Hamada.1998. Molecular analyses of glucosyltransferase genes among strains ofStreptococcus mutans. FEMS Microbiol. Lett.161:
331–336.
5. Fukushima, K., T. Okada, and K. Ochiai.1993. Production, characteriza-tion, and application of monoclonal antibodies which distinguish three glu-cosyltransferases fromStreptococcus mutans. Infect. Immun.61:323–328. 6. Goodman, S. D., and Q. Gao.2000. Characterization of thegtfBandgtfC
promoters fromStreptococcus mutansGS-5. Plasmid43:85–98.
7. Hamada, S., and M. Torii.1978. Effect of sucrose in culture media on the location of glucosyltransferase ofStreptococcus mutansand cell adherence to glass surfaces. Infect. Immun.20:592–599.
8. Honda, O., C. Kato, and H. K. Kuramitsu.1990. Nucleotide sequence of the
Streptococcus mutans gtfDgene encoding the glucosyltransferase-S enzyme. J. Gen. Microbiol.136(Pt 10):2099–2105.
9. Li, Y., and R. A. Burne.2001. Regulation of thegtfBC andftfgenes of
Streptococcus mutansin biofilms in response to pH and carbohydrate. Mi-crobiology147:2841–2848.
10. Li, Y. H., N. Tang, M. B. Aspiras, P. C. Lau, J. H. Lee, R. P. Ellen, and D. G. Cvitkovitch.2002. A quorum-sensing signaling system essential for genetic competence inStreptococcus mutansis involved in biofilm formation. J. Bacteriol.184:2699–2708.
11. Mattos-Graner, R. O., M. S. Correa, M. R. Latorre, R. C. Peres, and M. P. Mayer.2001. Mutans streptococci oral colonization in 12–30-month-old Bra-zilian children over a one-year follow-up period. J. Public Health Dent.
61:161–167.
12. Mattos-Graner, R. O., S. Jin, W. F. King, T. Chen, D. J. Smith, and M. J. Duncan.2001. Cloning of theStreptococcus mutansgene encoding glucan binding protein B and analysis of genetic diversity and protein production in clinical isolates. Infect. Immun.69:6931–6941.
13. Mattos-Graner, R. O., Y. Li, P. W. Caufield, M. Duncan, and D. J. Smith.
2001. Genotypic diversity of mutans streptococci in Brazilian nursery chil-dren suggests horizontal transmission. J. Clin. Microbiol.39:2313–2316. 14. Mattos-Graner, R. O., D. J. Smith, W. F. King, and M. P. Mayer.2000.
Water-insoluble glucan synthesis by mutans streptococcal strains correlates with caries incidence in 12- to 30-month-old children. J. Dent. Res.79:1371– 1377.
15. Merritt, J., F. Qi, S. D. Goodman, M. H. Anderson, and W. Shi.2003. Mutation ofluxSaffects biofilm formation inStreptococcus mutans. Infect. Immun.71:1972–1979.
16. Munro, C., S. M. Michalek, and F. L. Macrina.1991. Cariogenicity of
Streptococcus mutansV403 glucosyltransferase and fructosyltransferase mu-tants constructed by allelic exchange. Infect. Immun.59:2316–2323.
on May 15, 2020 by guest
http://jcm.asm.org/
17. Shiroza, T., S. Ueda, and H. K. Kuramitsu.1987. Sequence analysis of the
gtfBgene fromStreptococcus mutans. J. Bacteriol.169:4263–4270. 18. Smith, D. J., B. Shoushtari, R. L. Heschel, W. F. King, and M. A. Taubman.
1997. Immunogenicity and protective immunity induced by synthetic pep-tides associated with a catalytic subdomain of mutans group streptococcal glucosyltransferase. Infect. Immun.65:4424–4430.
19. Smith, D. J., and M. A. Taubman.1987. Oral immunization of humans with
Streptococcus sobrinusglucosyltransferase. Infect. Immun.55:2562–2569. 20. Smith, D. J., and M. A. Taubman.1990. Effect of local deposition of antigen
on salivary immune responses and reaccumulation of mutans streptococci. J. Clin. Immunol.10:273–281.
21. Smith, D. J., M. A. Taubman, W. F. King, S. Eida, J. R. Powell, and J. Eastcott.1994. Immunological characteristics of a synthetic peptide associ-ated with a catalytic domain of mutans streptococcal glucosyltransferase. Infect. Immun.62:5470–5476.
22. Tomita, Y., X. Zhu, K. Ochiai, Y. Namiki, T. Okada, T. Ikemi, and K. Fukushima.1996. Evaluation of three individual glucosyltransferases pro-duced byStreptococcus mutansusing monoclonal antibodies. FEMS Micro-biol. Lett.145:427–432.
23. Tsumori, H., and H. Kuramitsu.1997. The role of theStreptococcus mutans
glucosyltransferases in the sucrose-dependent attachment to smooth
sur-faces: essential role of the GtfC enzyme. Oral Microbiol. Immunol.12:274– 280.
24. Ueda, S., T. Shiroza, and H. K. Kuramitsu.1988. Sequence analysis of the
gtfCgene fromStreptococcus mutansGS-5. Gene69:101–109.
25. Wexler, D. L., M. C. Hudson, and R. A. Burne.1993.Streptococcus mutans
fructosyltransferase (ftf) and glucosyltransferase (gtfBC) operon fusion strains in continuous culture. Infect. Immun.61:1259–1267.
26. Yamashita, Y., W. H. Bowen, R. A. Burne, and H. K. Kuramitsu.1993. Role of theStreptococcus mutans gtfgenes in caries induction in the specific-pathogen-free rat model. Infect. Immun.61:3811–3817.
27. Yamashita, Y., W. H. Bowen, and H. K. Kuramitsu.1992. Molecular analysis of aStreptococcus mutansstrain exhibiting polymorphism in the tandemgtfB
andgtfCgenes. Infect. Immun.60:1618–1624.
28. Yamashita, Y., Y. Tsukioka, Y. Nakano, Y. Shibata, and T. Koga.1996. Molecular and genetic analysis of multiple changes in the levels of produc-tion of virulence factors in a subcultured variant ofStreptococcus mutans. FEMS Microbiol. Lett.144:81–87.
29. Yoshida, A., and H. K. Kuramitsu.2002.Streptococcus mutansbiofilm for-mation: utilization of agtfBpromoter-green fluorescent protein (PgtfB::gfp) construct to monitor development. Microbiology148:3385–3394.