Optimisation of plastohydrodynamic system of wire
drawing using polymer melts.
PARVINMEHR, Hossein.
Available from Sheffield Hallam University Research Archive (SHURA) at:
http://shura.shu.ac.uk/20210/
This document is the author deposited version. You are advised to consult the
publisher's version if you wish to cite from it.
Published version
PARVINMEHR, Hossein. (1983). Optimisation of plastohydrodynamic system of wire
drawing using polymer melts. Doctoral, Sheffield Hallam University (United
Kingdom)..
Copyright and re-use policy
See
http://shura.shu.ac.uk/information.html
Sheffield Hallam University Research Archive
SHEFFIELD SI l w
Sheffield Hallam University
REFERENCE ONLY
Ci
|^r n.
U-'Z
Ho f
3 o JAN 1995
Q.O-S"!
3
o \
Z^yO
,V°1S
P ^ n \ I G - M
T
\tjs
n ( ] - 1?- > \ Ib^ n v i
i '/ • t \
2 3 FEB 1995
-ProQuest Number: 10700855
All rights reserved
INFORMATION TO ALL USERS
The quality of this reproduction is dependent upon the quality of the copy submitted.
In the unlikely event that the author did not send a com plete manuscript and there are missing pages, these will be noted. Also, if material had to be removed,
a note will indicate the deletion.
uest
ProQuest 10700855
Published by ProQuest LLC(2017). Copyright of the Dissertation is held by the Author.
All rights reserved.
This work is protected against unauthorized copying under Title 17, United States C ode Microform Edition © ProQuest LLC.
ProQuest LLC.
789 East Eisenhower Parkway P.O. Box 1346
OPTIMISATION OF PLASTOHYDRODYNAMIC SYSTEM OF WIRE DRAWING USING POLYMER MELTS.
by
Hossein Parvinmehr BSc.
A thesis submitted to the COUNCIL FOR NATIONAL ACADEMIC AWARD in partial fulfilment for the degree of DOCTOR OF PHILOSOPHY
Department of Mechanical and Production Engineering, Sheffield City Polytechnic.. (Sponsoring Establishment)
Arthur Lee and Sons Ltd. (Collaborating Establishment)
CONTENTS PAGE
ACKNOWLEDGEMENT xv
DECLARATION xvi
ABSTRACT xvii
NOTATION . xviii
CHAPTER 1: Introduction. 1
1.1- The Wire Drawing Process. 2
1.2- The Historical Background Of Hydrodynamic
Lubrication. 4
1.3- Introduction Of Polymer Melt As A Lubricant
In Wire Drawing. .- 7
1.4- Background Development Leading To The Design Of The Pressure Reduction Units And Scope Of
The Present W o r k . 8
CHAPTER 2: Rheology Of Polymer Melts. 16
2.1- Introduction. 17
2.2- Temperature Dependent Viscosity. 18
2.3- Stress-Strain Dependent Viscosity. 19
2.3.1- Critical Shear Stress. 20
2.3.2- Sharkskin. 22
2.4- Pressure Dependent Viscosity. 23
CHAPTER 3: Description Of The Experimental Equipment
Development Of The Die-less Units. 34
3.1- Description Of The Experimental Equipments. 35
3.2- Modification To The Existing Rig. 36
3.3- Design And Development Of The Pressure
Reduction Units. 37
3.4- Further Modification To The Existing Rig. 42 3.5- Experimental Procedure And Difficulties
Encountered. . 4 4
3.6- Wire Preparation. 46
CHAPTER 4: Experimental Results Obtained Using
The Stepped Bore Reduction U n i t . 64
4.1- Introduction. ( 65
4.2- Determination Of The Yield Characteristics
Of The Wires. 66
4.3- Experimental Results. 71
4.3.1- Results Of Pressure. 71
4.3.2- Results Of Drawing Load Versus Drawing
Speed. 93
4.3.3- Results Of Coating Thickness Versus
Drawing Speed. 99
4.3.4- Results Of Percentage Reduction In Area
Versus Drawing Speed. 109
4.4- Determination Of The Deformation Profiles. 116
4.5- Evaluation Of The Product Quality. 121
4.5.1- Roundness Test. 121
4.5.2- Examination Of The Uniformity Of The
4.5.3- Micro-Examination Of The Surface Finish
Of The Wires. 123
4.6- Results Of Multi-Pass Tests. 141
CHAPTER 5: Plastohydrodynamic Analysis Of The Wire Drawing Using The Stepped Bore Reduction
U n i t . 144
5.1- Critical Review Of The Previous Analyses. 145
5.2- Analysis. 149
CHAPTER 6: Results From The Analysis. 170
6.1- Introduction. 171
6.2- Theoretical Percentage Reduction In Area. 172
6.3- Theoretical Coating Thickness. 191
6.4- Theoretical Yielding Position Of The Wire. 209
6 . 5 - ..Theoretical Pressure. - 222
6.6- Theoretical Shear Stress On The Wire. 228
6.7- Theoretical Stress In The Wire. 237
6.8- Theoretical Deformation Profile. 238
CHAPTER 7: Discussion. 242
7.1- Introduction. 243
7.2- Error Analysis. 243
7.3- Discussion On The Test Procedure And
Experimental Results. 247
7.4- Discussion On The Analysis And Theoretical
Results. 256
7.5- Comparison Between The Theoretical And
Experimental Results. 266
CHAPTER 8: Conclusions. 279
CHAPTER 9: References. 281
APPENDIX 1: Description Of The Extrusion Rheometer Used To Determine The Flow Characteristics
Of The Polymer Melts. Al.l
APPENDIX 2: Experimental Results Obtained Using
The Tapered Bore Reduction Unit. A2.1
APPENDIX 3: Newtonian'Analysis. A3.1
APPENDIX 4: Flow Chart And Listing Of The Computer Programme For The Non-Newtonian
Analysis. A4.1
APPENDIX 5: Experimental Results In Tabular Form. A5.1
LIST OF FIGURES PAGE
« *
1- Typical Pressure And Die Unit 12
2- Nozzle-Die Unit 12
3- Pressurized Chamber 13
4- High Pressure Die Unit 13
5- Double Die Unit 14
6- Pressure Tube-Die Arrangement 15
7- Effect Of Temperature On Viscosity Of Polymers 26 8- Effect Of Temperature On Viscosity Of
Alkathene WVG 23 And Polypropylene KM 61 26
9- Flow Curves For Alkathene WVG 23 27
10- Flow Curves For Polypropylene KM 61 28
11“ Effect Of Shear Rate On Viscosity Of
Alkathene WVG 23 - 29
12- Effect Of Shear Rate On Viscosity Of
Polypropylene KM 61 30
13- A Possible Mechanism Of Sharkskin 31
o
14- Flow Curves For 0.92 Polyethylene At 130 C 32 15- Viscosity Versus Pressure For Different
Shear Rate CO.92 Polyethylene 130 C) 33
16- Variable Diameter Unit 47
17- Stepped Bore Reduction Unit 48
18- Tapered Bore Reduction Unit 49
19- Stepped Bore Reduction Unit Assembly 50
20- Tapered Bore Reduction Unit Assembly 51
21- Air Assisted Polymer Feed Assembly 52
22- Wire Feed Assembly 53
24- The Yield Characteristics Of The Copper Wire 25- The Yield Characteristics Of The Mild Steel Wire 26- The Yield Characteristics Of The 18/8
Stainless Steel Wire
27- Pressure Versus Speed For Copper Wire With WVG 23, 180° C
28- Pressure Versus Speed For Copper Wire With WVG 23, 130° C
29- Pressure Versus Speed For Copper Wire With KM 61, 200° C
30- Pressure Versus Speed For 18/8 Stainless Steel Wire With WVG 23, 130° C
31- Pressure Versus Speed For 18/8 Stainless Steel Wire With KM 61, 200° C
32- Pressure Versus Speed For Mild Steel Wire With WVG 23, 130° C
33- Pressure Versus Speed For Mild Steed Wire With KM 61, 200° C
34- Pressure Versus Speed For Mild Steel Wire With KM 61, 200° C (ht/h2= 2.0)
35- Pressure Distributions For Copper Wire’ With WVG 23, 180° C
36- Pressure Distributions For Copper Wire With WVG 23, 130° C
37- Pressure Distributions For Copper Wire With KM 61, 200° C
38- Pressure Distributions For 18/8 Stainless Steel Wire With WVG 23, 130° C
39- Pressure Distributions For 18/8 Stainless Steel Wire With KM 61, 200°C
40- Pressure Distributions For Mild Steel Wire
With WVG 23, 130° C 90
41- Pressure Distributions For Mild Steel Wire
With KM 61, 200° C 91
42- Pressure Distributions For Mild Steel Wire
With KM 61 , 200° C (hi /ha = 2.0) 92
43- Drawing Loads For Copper Wire With WVG 23
(130° C & 180° C) 95
44- Drawing Loads With WVG 23, 130°C 96
45- Drawing Loads With KM 61, 200 C 97
46- Drawing Loads For Mild Steel Wire With
KM 61, 200° C 98
47- Coating Thickness On Copper Wire With
WVG 23 (130° C & 180° C) 102
48- Coating Thickness With WVG 23, 130 C • 103
49- Coating Thickness With KM 61, 200 C 104
50- Coating Thickness On Mild Steel Wire With
KM 61, 200° C 105
51- Percentage Reduction In Area For Copper
Wire - WVG 23 (130° C & 180° C) 112
o
52- Percentage Reduction In Area - WVG 23, 130 C 113 53- Percentage Reduction In Area - KM 61, 200 C 114 54- Percentage Reduction In Area For Mild Steel
Wire - KM 61, 200° C 115
55- Deformation Profiles For Copper Wire - '
WVG 23, 130° C 118
56 Deformation Profiles For Mild Steel Wire
-WVG 23, 130° C 119
57- Deformation Profiles For 18/8 Stainless
58- Roundness Test On Received Copper Wire 126 59- M 11 " Copper Wire - WVG 23, 130° C 126 60- " M " Copper Wire - KM 61, 200°C 127 61- " M " Copper Wire - KM 61, 200°C 127 62- " " " Received Mild Steel Wire 128 63- " M " Mild Steel Wire - KM 61, 200°C 128 64- M M " Mild Steel Wire - KM 61, 200°C 129
65- " M Mild Steel Wire
-WVG 23, 130° C * 129
66- Roundness Test On Received 18/8 Stainless
Steel Wire 130
67- Roundness Test On 18/8 Stainless Steel
Wire - WVG 23, 130° C 130
68- Roundness Test On 18/8 Stainless Steel
Wire - WVG 23, 130° C 131
69- Roundness Test On 18/8 Stainless Steel
Wire - KM 61, *200° C 131
70(a)- Variations Of Diameter For Copper Wire 132
70(b)- " " " " " M 133
71- Variations Of Diameter For Mild Steel Wire 134
72- Geometry Used In The Analysis 148
73- Comparison Between Theoretical Solutions
Predicting Percentage Reduction In Area 177
74- Theoretical Effect Of Gap Ratio On Percentage
Reduction In Area ■ • ' ' 1 7 8
75- Theoretical Effect Of Length Ratio On Percentage
Reduction In Area 179
76- Theoretical Effept Of Initial Viscosity On
77- Theoretical Effect Of Shear Stress Constant On Percentage Reduction In Area
78- Theoretical Effect Of Critical Shear Stress On Percentage Reduction In Area
79- Theoretical Effect Of Viscosity Constant On Percentage Reduction In Area
80- Theoretical Effect Of Pressure Coefficient Of Viscosity On Percentage Reduction In Area 81- Theoretical Effect Of Initial Yield Stress
On Percentage Reduction In Area
82- Theoretical Effect Of Strain Hardening Constant On Percentage Reduction In Area 83-.Theoretical Effect Of Strain Hardening
Index On Percentage Reduction In Area
84- Theoretical Effect Of Strain Rate Sensitivity Cons. On Percentage Reduction In Area
85- Theoretical Effect Of Strain Rate Sensitivity Index On Percentage Reduction In Area
86- Theoretical Effect Of Wire Diameter On Percentage Reduction In Area
87- Comparison Between Theoretical Solutions Predicting Coating Thickness
88- Theoretical Effect Of Length Ratio On Coating Thickness
89- Theoretical Effect Of Gap Ratio On Coating Thickness
90- Theoretical Effect Of Initial Viscosity On Coating Thickness
91- Theoretical Effect Of Shear Stress Constant On Coating Thickness
92- Theoretical Effect Of Critical Shear Stress On Coating Thickness
93- Theoretical Effect Of Viscosity Constant On Coasting Thickness
94- Theoretical Effect Of Pressure Coefficient Of Viscosity On Coating Thickness
95- Theoretical Effect Of Initial Yield Stress On Coasting Thickness
96- Theoretical Effect Of Strain Hardening Constant On Coating Thickness
97- Theoretical Effect Of Strain Hardening Index On Coating Thickness
98- Theoretical Effect Of Strain Rate Sensitivity Constant On Coating Thickness
99- Theoretical Effect Of Strain Rate Sensitivity Index On Coating Thickness
100- Theoretical Effect Of Wire Diameter On Coating Thickness
101- Comparison Between Theoretical Solutions Predicting Yielding Position Of Wire
102- Theoretical Effect Of Length Ratio On Yielding Position Of Wire
103- Theoretical Effect Of Gap Ratio On Yielding Position Of Wire
104- Theoretical Effect Of Initial Viscosity On Yielding Position Of Wire
105- Theoretical Effect Of Shear Stress Constant On Yielding Position Of Wire
106- Theoretical Effect Of Critical Shear Stress On Yielding Position Of Wire
107- Theoretical Effect Of Viscosity Constant On Yielding Position Of Wire
108- Theoretical Effect Of Pressure Coefficient Of Viscosity On Yielding Position Of Wire 109- Theoretical Effect Of Initial Yield Stress
On Yielding Position Of Wire
110- Theoretical Effect Of Wire Diameter On Yielding Position Of Wire
111- Theoretical Pressure Distributions Showing Effect Of Shear Stress Constant
112- Theoretical Pressure Distributions Showing Effect Of Pressure On Viscosity
113- Theoretical Pressure Variations At Step With Effect Of Shear Rate On Viscosity 114- Theoretical Pressure Variations At Step
_„With Effect Of Pressure On Viscosity
115- Theoretical Variations Of Shear Stress (lei ) With Effect Of Shear Rate On Viscosity
116- Theoretical Variations Of Shear Stress (Tci ) With Effect Of Pressure On Viscosity
117- Theoretical Variations Of Shear Stress (Xc2 )
With Effect Of Shear Rate On Viscosity
118- Theoretical Variations Of Shear Stress (Xc2 )
With Effect Of Pressure On Viscosity 119- Theoretical Shear Stress Distribution On
The Wire
120- Theoretical Variations Of Shear. Stress (Xc2 )
Due To Deformation Of Wire
121- Theoretical Pressure And Axial Stress Distributions For Copper Wire
122- Theoretical Deformation Profiles (Yd = 0 . 3 5 m/s)
123- Theoretical Deformation Profiles (Vd = 1.76 m/s)
124- Comparison Between Experimental And Theoretical Results
125- Pressure Distributions (Vd = 0.22 m/s) 126- Pressure Distributions (Vd = 1.18 m/s) 127- Pressure Distributions (Vd = 2.90 m/s) 128- Deformation Profiles For Copper Wire
(Vd = 0.22 m/s)
129- Deformation Profiles For Copper Wire (Vd = 0.48 m/s)
Al- Schematic Diagram Of The Extrusion Rheometer A2- Percentage Reduction In Area For Copper
-Wire - WVG 23 (130° C & 180* C ) A3 Coating Thickness On Copper Wire
-WVG 23 (130° C & 180° C)
o
A4- Drawing Load For Copper Wire - WVG 23, 180 C A5 Pressure Variations For Copper Wire
-WVG 23, 180° C •
A6- Flow Chart And Listing Of The Programme For The Newtonian Analysis
A7- Flow Chart And Listing Of The Programme For The Non-Newtonian Analysis
LIST OF PLATES PAGE
1- Showing General View Of The Drawing Bench 55
2- Showing Inter-Changeable Bull Blocks 56
3- View Of Instrumentations 57
4- General View Of The Drawing Bench Showing
Feed Mechanism 58
5- Modified Bull Block And Removable Brackets 59 6- Section View Of The Stepped Bore Reduction Unit 60
7- M " 11 M .Tapered " " n 60
8- Pressure Transducers And Polymer Hopper 61
9- Air Feed Assembly And Load Frame 62
10- Air Feed Components 63
11- Sharkskin On Copper Wire - -WVG 23, 130 C 106
12- " » " » - KM 61, 200° C 106
13- - " " Mild Steel Wire - WVG 23, 130°C 107
14- " M » M " - KM 61, 200° C 107
15- ” 11 18/8 Stainless Steel Wire
-WVG 23, 130° C 108
16 Sharkskin On 18/8 Stainless Steel Wire
-KM 61, 200° C 108
17- Surface Finish Of Copper Wire As Received 135 18- " " " " " - WVG 23,
130° C - 1.0 m/s 135
19- Surface Finish Of Copper Wire - WVG 23,
130 C - 0.5 m/s 136
20- Surface Finish Of Copper Wire - KM 61,
200° C - 0.5 m/s 136
22- Surface Finish Of Mild Steel Wire - KM 61,
200° C - 1.0 m/s 137
23- Surface Finish Of Mild Steel Wire - KM.61,
200 C - 0.5 m/s 138
24- Surface Finish Of Mild Steel Wire - WVG 23,
130° C - 0.5 m/s 138
25- Surface Finish Of 18/8 Stainless Steel Wire
As Received 139
26 Surface Finish Of 18/8 Stainless Steel Wire
-WVG 23, 130° C - 0.5 m/s 139
27 Surface Finish Of 18/8 Stainless Steel Wire
-WVG 23, 130°C - 1.0 m/s 140
28 Surface Finish Of 18/8 Stainless Steel Wire
ACKNOWLEDGEMENTS
The author gratefully acknowledges his appreciation for the continual assistance and invaluable suggestions proffered by D r . G. R. Symmons and Dr. M. S. J. Hashmi without whose supervision this work could not have been accomplished.
The technical assistance offered by Mr R. Teasdale and his staff was received with gratitude and particular thanks go to Mr D. McKay, Mr R. Wilkinson and Mr M. Jackson for their co-operation during the duration of this work.
DECLARATION
The author declares that no part of this work has been submitted in support of another degree or qualification to this or any other establishment. The author further declares that he has not been a registered candidate or enrolled
student for another award of the CNAA or other academic or professional institution during the course of the research programme.
ABSTRACT
OPTIMISATION OF PLASTOHYDRODYNAMIC SYSTEM OF WIRE DRAWING USING POLYMER MELTS.
H. Parvinmehr
A feasibility study carried out on the wire drawing system consisting of a reduction die preceded by a pressure tube and polymer melt lubrication, led to the introduction of the die-less wire drawing process. The conventional reduction die is altogether replaced by a die-less unit of stepped bore configuration. The deformation is induced by means of an effective die which is formed as a result of hydrodynamic pressures generated in the unit due to the motion of the wire and viscous action of the polymer m e l t . The dimensions of the unit are such that the smallest bore size is greater than the incoming wire diameter, metal to metal contact, therefore is eliminated, removing some of the disadvantages encountered in a conventional wire drawing process.
\ An extensive experimental study has been under taken whi'oh showed that the deformation in the wire_was._.much h i gher__a±— s 1 o wex^drawin g^spe^s^^^YXEeLjdbtai n ab 1 e
percentage reduction in area^reduced at higher drawing speeds. However, use of a higher viscosity polymer melt and/or a
multi-unit drawing system has resulted in higher deformation of the wire at higher drawing speeds.
An analysis has been developed for predicting the ength of the deformation zone, shape of the effective die nd .percentage re,duction^„in area based^oiT^an ^empirical expression relaFing shear stfressflmd she^ar~rate "of the
polymer m e T t . The theory incorporates the~pressure coefficien of vi^cosTTy derived from the available data, the limiting shear stress which manifests itself as slip in the polymer melt and the strain hardening and the strain rate sensitivity of the wire material.
Results from the analysis appears to under estimate the experimental results at slower drawing speeds and over
NOTATION
P, pressure gradient in the first section of the' unit prior to the deformation of wire.
P2 pressure gradient in the second part of the unit prior to the deformation of wire
Ti shear stress in the melt in the first part of unit
x2 shear stress in the melt in the second part of unit
K non-Newtonian factor
xCl shear stress on the wire in the first section of the unit prior to deformation
1C2 shear stress on the wire in the second section of the unit prior to deformation
Tea critical shear stress
T]o initial viscosity of polymer melt
a viscosity constant
b pressure coefficient of viscosity
V velocity of wire prior to deformation
Qi flow of polymer in the first section of the unit
Q2 flow of polymer in the second section of the unit
Ui velocity of polymer in the first section of the unit
U2 velocity of polymer in the second section of the
unit
h, radial gap in the first section of the unit prior to deformation of wire
h.2 radial gap in the second section of the unit prior
to deformation of wire
11 length of the first section of the unit
12 length of the second section of the unit
V8 wire speed at commencement of slip
Y apparent shear rate in the first section of the unit
Xi yielding position of wire
(jXl axial stress in the wire at commencement of plastic deformation
P, radial pressure in the melt at commencement of plastic deformation
Di original diameter of wire
crr radial stress in the wire
Di wire diameter in the deformation zone
hi radial gap in the deformation zone
a semi-angle of the effective die
A x step size in the deformation zone
B slope of the deformation line within A x
Tci shear stress on the wire in the deformation zone
Qi
flow of polymer in the deformation zone
Vi
velocity of wire in the deformation zone
Yo
initial yield stress in the wire
Ko
strain hardening constant
n
strain hardening index
Yi
yield, stress in the deformation zone
Vd
velocity of wire at the end of deformation zone
Si
dynamic/static stress ratio
h3
polymer coating thickness
Note : percentage reduction in area is given by;
—
D?
SUBSCRIPTS:
first section of the unit
second section of the unit
deformation zone
denotes radial direction
denotes axial direction
1 inch = 25.4 mm
1 foot. = 12 inches
1 bar = 10D N/m2
1 psi = 6897.11 N/m2
1
2
i
r
CHAPTER 1: Introduction.
1.1- The Wire Drawing Process.
1.2- The Historical Background Of Hydrodynamic Lubrication.
1.3- Introduction Of Polymer Melt As A Lubricant In Wire Drawing.
1.1- The Wire Drawing Process
Conventional wire drawing is the process of pulling the wire through a trumpet shaped die to produce a reduction in diameter. The principal purpose of wire drawing is to consistently reduce wire to a specific size with acceptable metallurgical properties.
The process is usually carried out employing tungsten carbide dies. Diamond dies however, are used especially for finer wires. When the wire is drawn cold, the deformation of metal produces a very high drawing load which makes the presence of a lubricant essential. Generally two types of lubrication methods are used in wire drawing depending upon the material and size of the wire. These are:
i)- "Wet Drawing" in which the entire apparatus is submerged in a bath of lubricant. This type of lubrication is usually employed for wire diameters of less than 0.5mm.
ii)- "Dry Drawing" refers to a system in which the wire is passed through a box of soap powder before entering
the die. To facilitate the pick up of soap powder, the wire is passed through the lime liquid, borax or other alkaline substances. Dry drawing is usually used for wire diameters of more than 0.5mm.
In conventional wire drawing, friction between the wire and the die is of the boundary type where metal to metal contact takes place inspite of the presence of a
Hydrodynamic lubrication however, refers to a regime where a thick lubricant film separates two metal surfaces previously i n .contact. To create such a regime, certain wire
speed and lubricant pressure must be reached and maintained in order to keep the surfaces continously apart. Prior to hydrodynamic lubrication, boundary lubrication is the
dominant regime. The film thickness produced in dry drawing is greater than that in boundary lubrication but less than that in hydrodynamic lubrication, "Quasi-Hydrodynamic"
(
1
,
2
).
Attempts were made (2,3) to ascertain the mean die pressure by means of the split-die technique in order to estimate the die wear. The radial force tending to separate the two halves of the die was measured concurrently with the drawing force. It was shown that there is an optimum die angle for a given reduction in area for which drawing force is the least.
Boundary lubrication methods have been used for the wire drawing process since the inception of the process
itself. However, the tasks of producing satisfactory physical properties of the drawn wire to meet the demand for increased production and quality of product are proving to be beyond the scope of these traditional lubrication methods. Therefore, other means of lubrication are being investigated.
1.2- The Historical Background Of Hydrodynamic Lubrication
In the past, both the die angle and the lubricant were selected by means of trial and error to ensure that the best possible results were obtained. As demand for higher quality wire increased, better lubrication proved necessary to promote efficiency, surface finish, quality, heat dissipation and loss of production time. The latter may be summarized as:
1- Reduced drawing time.
2- Reduction of the number of interpass heat treatments. 3- Elimination of pre-drawing time.
4- Reduction of down time due to changing dies because of excessive wear.
Recently, attempts have been made to introduce more
<
theoretical background to the process which will hopefully enable greater understanding of .the mechanism of the
deformation of wire in the tube before the die entrance. Although it was shown that hydrodynamic lubrication was achieved under the designed conditions, the pressure nozzle had to be pla.ced vertical and was of such a length that the wire industry found it too inconvenient to put it into practice.
Wistreich (5) conducted experimental work on the forced lubrication based on'a pressure tube system. Soap powder was used as the lubricant in a short nozzle (2 inch, length) which was attached to the entry side of the die. The
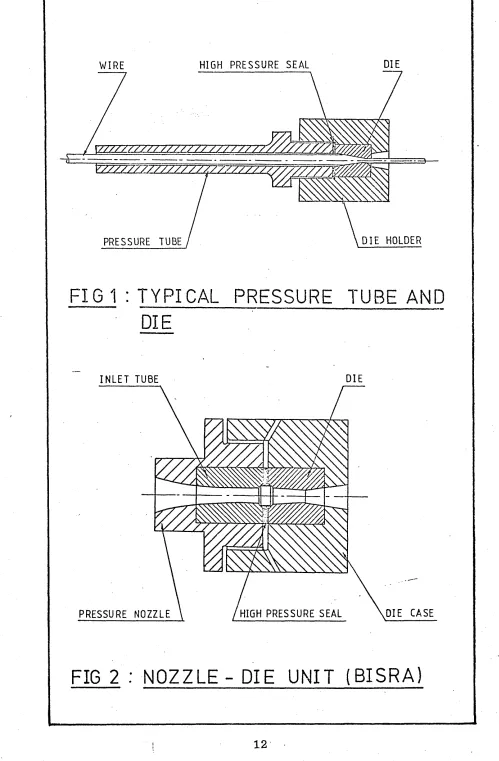
experimental results showed' that the speed, temperature and the tube gap had a direct effect on the property of the film thickness produced. He also showed that when the soap powder was replaced by oil, an increase rather than the decline of film thickness was observed. The schematic diagram of the (BISRA) unit is shown in figure 2.
Tattersall (6) published a detailed analysis of plasto-hydrodynamic lubrication in wire drawing taking some
rheological and metallurgical properties of the process into account. Results from experiment and theory showed that these were in reasonable agreement. More recently Chu (7), using the work of Tattersall has presented charts for inlet tube design.
Theoretical analysis of the high speed strip drawing process by Bloor etal (8) predicted that film thickness
—4
of the order of 10 in. were attainable using tapered dies and mineral oil as a lubricant. The experimental process was carried out at speeds of up to 9000 ft/min with
surfaces were protected by a hydrodynamic film as exhibited by the surface quality of the material after drawing.
Apart from the consideration of the inlet tube one of the main themes of the analysis presented by other workers
(9,10,11) has been the study of the theoretical film thickness which would be developed under representative practical drawing conditions. An improvement in lubrication was reported by Middlemiss (12) using an externally
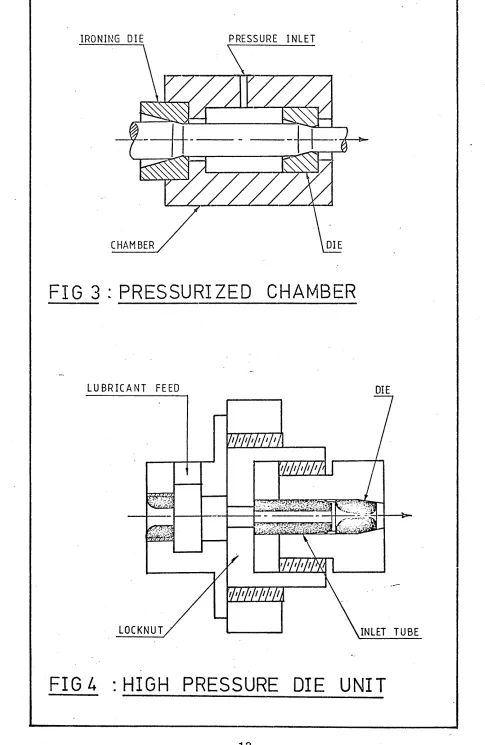
pressurized lubrication system. The unit consisted of two dies separated by a narrow tube which was connected to a hydraulic pump to pressurize the lubricant in order to assist the formation of hydrodynamic film at the beginning of the drawing process. The wire was first passed through an ironing die which acted as a seal and then through the reduction die. A section view of the unit is shown in figure 3. This pre-pressurized lubrication method was reported to work successfully for the reduction die but
the ironing die was worn severely due to lack of lubrication. Further evidence of improvement in lubrication and
machine efficiency was observed when the ironing die was replaced by a short pressure tube with very fine
tolerances. The system was still provided with pressurized lubricant and the action of the tube was to reduce the oil leakage. As soon as steady state lubrication was reached, the hydraulic pump was dispensed with in order to reduce the cost of operation. The modified unit is shown in figure 4.
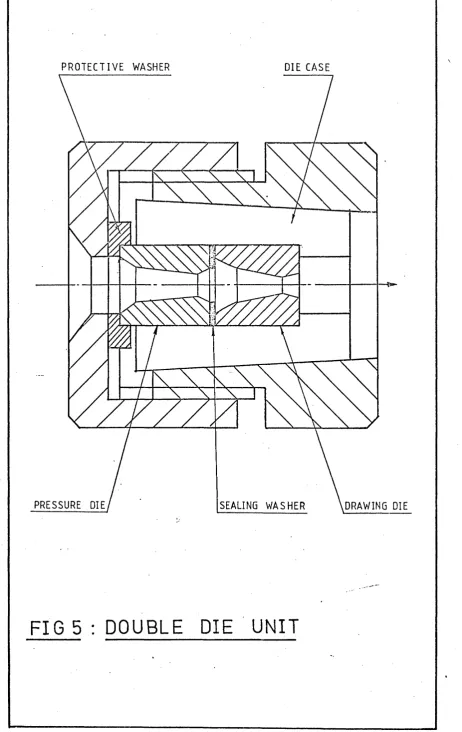
Middlemiss's unit in that the pressure die takes over the function of the pump by the motion of the wire. The
lubricant is transported into the chamber formed by the exit cone of the pressure die and the entry part of the drawing die, where the pressurized lubricant provides the hydrodynamic lubrication during drawing. Although, it was claimed that the efficiency was increased by 53%, die life was improved by 500%, and the electrical power consumption was reduced by 45%, there was however, a lack of
substantial experimental evidence.
1.3- Introduction Of Polymer Melt As A Lubricant In Wire Drawing'
Polymers have been considered as a lubricant previously and were used in other processes such as hydrostatic
extrusion and deep drawing. The reason for this type of lubrication stems from the desire to have an alternative lubrication system which has very different characteristics from those currently in use. One of the advantages that a polymer melt can offer is its high viscosity which conventional lubricants fail to provide at higher temperatures.
drawing and polymer melt lubrication investigating the
coating properties of the polymer. Practical results showed a decrease in the coating thickness with increasing speed . which gave some correlation with his newtonian solution. Crampton (16) carried out an indepth study of the wire drawing process based on the similar unit adopted by Stevens again using polymer melt as a lubricant. The apparatus consisted of a pressure tube connected to the forward end of a conventional die. The polymer melt was dragged into the tube by the motion of the wire, generating high pressures which resulted in hydrodynamic lubrication and coating of wire during the drawing process. A section view of the unit is shown in figure 6. The lubrication ability of the polymer melt was theoretically and
experimentally examined by changing various parameters such as polymer temperature, wire material, drawing speed etc. and computer assisted, plasto-hydrodynamic non-newtonian solution was shown to be in some agreement with the
experimental results.
1.4- Background Development Leading To The Design Of The Pressure Reduction Units And The Scope Of The Present Work
i)- The need for a leader wire.
ii)- Start up problems during which the wire may snap, iii)- Severe die wear prior to the establishment of
hydrodynamic lubrication.
When polymer melt was introduced in conjunction with the pressure tube, it was thought that it would provide a novel lubrication system which would give partial solutions to the existing problems. The initial researchers (14,15,16) showed that in addition to above difficulties, other
limitations were also present:
i)- Up to certain drawing speeds "Bamboo” effect was observed on the polymer coating with subsequent necking of the wire.
„ii)- Polymer coating thickness on the wire reduced by increasing the drawing speed.
A careful study of previous works was undertaken to develop a system in order to eliminate some of the
limitations and difficulties inherent in the wire drawing process. Crampton (16) showed that during drawing,
deformation of wire took place before the die entrance due to the high pressure generated in the pressure tube. It was then thought that under certain geometrical
configurations it might be possible to remove the reduction die and still generate the necessary pressure by the
degree of success. Hence two reduction units were designed and manufactured, one being of stepped and the other being of tapered bore. Dimensions of the units were chosen in a
fashion that a narrow gap was present between the wire and the smallest diameter of either units, preventing metal to metal contact taking place. This immediately solved the problem of a leader wire which was absolutely necessary prior to drawing process in the case of conventional wire drawing. Initially an experimental programme was conducted to examine the performance of the pressure reduction units. The obtained results confirmed successful achievements in the die-less wire drawing where many difficulties associated with this deforming process were completely eliminated ie die and consequently die wear, start up problems, breakage etc. The only observed limitation was the fact that at
increasing drawing speeds the performance of both units, in terms of the obtainable reduction in area, decreased. Since the design and manufacturing of the stepped bore reduction unit proved simpler, an extensive experimental and
theoretical work was carried out for this unit.
The objectives of the present work are to fulfil the following points:
1- To provide an improved theoretical solution, taking detailed rheological and metallurgical properties of the polymer melt and the wire into account.
3- To examine the’ product from the present system and compare the results with those wires drawn using the
conventional drawing process, and critically evaluate the new system in the light of industrial practice and
WIRE HIGH PRESSURE SEAL DIE
\//jjy:&2jyyj'zy7:z /7Z7V/ 77 //jy77Z77Mffi
D IE HOLDER PRESSURE TUBE
FIG 1 : TYPICAL PRESSURE TUBE AND
DIE
IN L E T TUBE DIE
DIE CASE HIGH PRESSURE SEAL
PRESSURE NOZZLE
[image:37.617.39.538.25.786.2]IRONING DIE PRESSURE INLET
DIE CHAMBER
r
IG 3 : PRESSURIZED CHAMBER
L U B R IC A N T FEED DIE
LOCKNUT INLET TUBE
[image:38.612.51.536.18.763.2]PROTECTIVE WASHER DIE CASE
PRESSURE DIE SEALING WASHER DRAWING DIE
[image:39.614.73.536.18.751.2]CHAPTER 2: Rheology Of Polymer Melts.
2.1- Introduction.
2.2- Temperature Dependent Viscosity.
2.3- Stress-Strain Dependent Viscosity.
2.3.1- Critical Shear Stress.
2.3.2- Shark Skin.
2.4- Pressure Dependent Viscosity.
2.1- Introduction
Rheology of polymer melt describes the flow
characteristics of the material. Polymers generally consist of very long molecules and the atoms making these long
chains are carbon and hydrogen atoms. The links between the atoms form a definite angle with each other, depending
o mainly on the linking atoms but usually a little over 100 .
In most cases the molecular segments, if they have
sufficient energy, can rotate about these links. One of the most common forces of attraction between the molecules is the Van der Y/aals forces and polymers with this type of bonding are commonly called Thermoplastic polymers. Another form of bonding between the molecules is cross-linking
which is refered to Thermosetting polymers. In Thermoplastic polymers long molecules take up a non-random configuration under the stress which would be partially recovered when stress is removed (Thermosetting polymers show brittle
behaviour). If the stress applied together with a temperature increase is high enough to overcome the Van der Waals
forces, a relative molecular motion takes place causing the polymer to flow. The ease of flow will depend on the
mobility of the molecular chains and the forces holding them together.
2.2- Temperature Dependent Viscosity
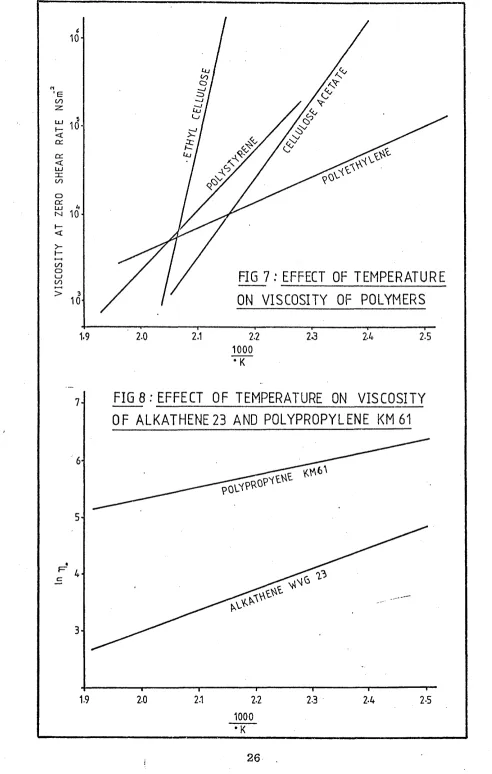
An increase in temperature generally decreases the viscosity of the fluids. This effect vastly differs for different types of polymers. Figure 7 shows typical changes in viscosity against the reciprocal of absolute temperature at zero shear rates. The slope of each line measures the activation energy for each polymer. Temperature increase in polymers with higher activation energies has more
deterioration effect on viscosity compared to those of lower activation energies. This energy is a function of polarity in polymers and the most non-polar polymers such as polyethylene with very small inter-molecular forces have low activation energy.
Dienes (17) believed that as the temperature increases the molecular arrangements within the polymer change more towards random configuration, therefore it becomes easier for the polymer to flow at higher temperatures. Attempts have also been made (18) to explain the difference in temperature dependence of viscosity between different
polymers. It was indicated that the variation of viscosity with temperature is a function of the difference between the melt temperature and the glass transition temperature of the polymer.
Polymers used for the experimental tests were an ICI polyethylene polymer (Alkathene WVG23) and a Shell
polypropylene (KM61) with specific densities of 0.913 and 0.908 respectively. Figure 8 shows the variation of
behaviour since viscosity measurements are affected by pressure, shear.rate, temperature etc. and it is necessary to include these effects on viscosity of polymer melts.
2.3- Stress-Strain Dependent Viscosity
shown in figures 11 and 12 from which viscosity can be read directly, (in the case of Newtonian fluids, straight
horizontal lines would be produced).
2.3.1- Critical Shear Stress
Critical shear stress is the stress at which the
uniformity of the flow of the polymer melt ceases to exist. Many workers (20 to 25) investigated this phenomenon and showed that certain flow defects are associated with polymer melts at critical shear stress. The flow
irregularities were shown to take the form of Spiral, Ripple, Bamboo, Zig Zag or Hilex for different types of polymers. Non-uniformity of the flow for polypropylene
o
KM61 was observed while being extruded at 200 C at shear
5 2
stress of 3.2 x 10 N/m as shown in figure 10. The
extruded polymer showed random shape. This phenomemon for polypropylene, at higher temperatures, and Alkathene WVG23 polymer was not detected during the extrusion process.
The terms "Melt fracture", "Elastic turbulance" and "Flow distortion" have been used to describe this effect. However, there is a general agreement on the following points:
1- Critical Shear Stress (CSS) is independent of die length and diameter.
2- CSS has values in the region of 0.1 - 1.0 MN/m2 for most polymers.
Also at critical shear stress, the following observations were made by the above authors:
1- A discontinuity in the viscosity shear stress curves occured.
2- The flow defect always took place when non-Newtonian fluids were involved.
3- The critical shear stress was shown by cinematography method to take place in the die.
A careful study of polymer flow was conducted by Benbow and Lamb (26) who showed, employing a transparent die and coloured polymer, that slip occured at the die wall when critical' shear stress was reached. Experiments carried out by them showed that the critical shear stress was
affected by die materials where different flow
characteristics were observed for each material. Results from brass and silver steel dies were compared using
Alkathene polymer. It was shown that for brass die, there is a change in slope of shear stress-shear rate curve at the onset of flow distorsion, whereas silver steel die exhibited a smooth flow curve. Also the silver steel die results indicated a critical shear stress independent of temperature whilst the brass die showed a slight increase in critical stress with temperature.
believed that slip on the die wail was the cause of the discontinuity in the flow of the polymer. Westover (28) carried out a study of polymer slip on an ultra high molecular weight linear polyethylene incorporating
hydrostatic pressure. Two interesting observations were mad e :
1- Flow rate above the critical shear stress increased rather than decreasing as for most of the polymers. 2- The critical shear stress occured at lower shear rate
as the hydrostatic pressure upon the melt increased.
Westover .concluded that the basic concepts of maximum shear stress, apparent shear rate and viscosity are invalid after slip occurs and that Rabinowitsch (35) equation
becomes inapplicable.
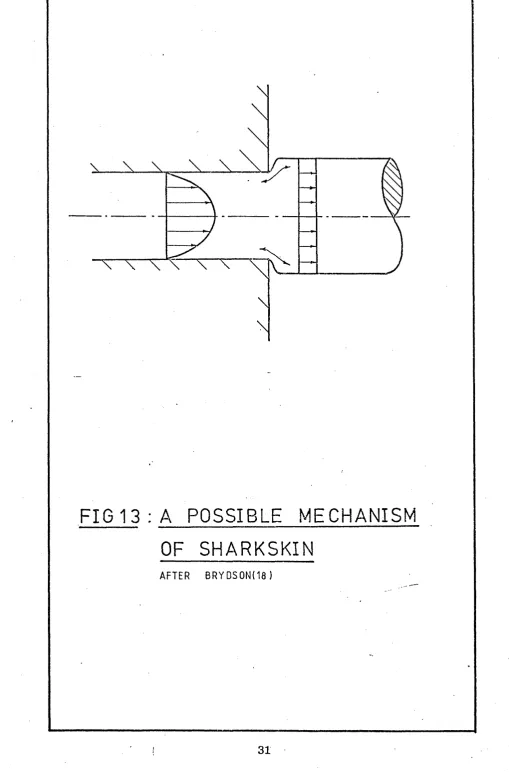
2.3.2- Shark-Skin
Shark-skin is another flow defect which occurs at shear stresses below critical value and figure 10 clearly shows these differences for polypropylene polymer. This flow distorsion manifests itself in regular ridges
perpendicular to the flow direction. The possible mechanism of shark-skin has been described as the surface failure of the melt caused by the outer layer of the polymer
accelerating away from a relatively stationary bank
between the elastic and viscous properties of the melt (18,24).
To investigate the source of shark-skin, Benbow and Lamb (26) carried out an experiment employing a thin walled w o o d ’s metal die, extruding silicone gum through, at a
stress sufficient to give pronounced shark-skin. To examine the extruding polymer, the die was melted in boiling water and it was found that the polymer surface in the die was smooth, thus showing that the stresses causing shark-skin were produced at the die exit. A schematic representation of the shark-skin mechanism is shown in figure 13. Also plates 11 to 16 show shark-skin produced on polymer coatings during the drawing process.
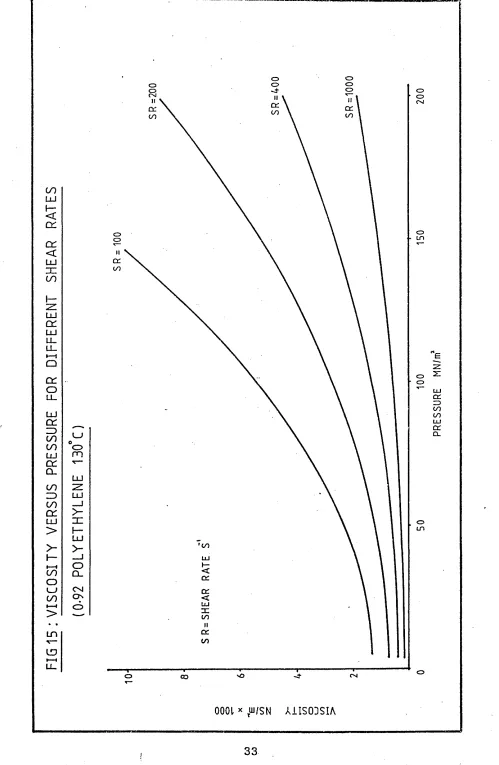
2.4- Pressure Dependent Viscosity
The influence of pressure on the polymer melts and the consequence changes of apparent viscosity and other flow properties are not as well understood as the effect of temperature and shear rate. Compressibility of polymers was investigated by Maxwell and Matsuoka (29) and they showed that polymers are compressible fluids and the
compressibility varies with the pressure rate, temperature and the polymer type. They reported a 2'.5% permanent change in the density of polyethylene under high pressures.
Viscosity, by definition, is the internal resistance to shearing stress due to inter molecular forces of
attraction. It was thought that when the molecular
of these materials,' may be increased. Studies by Maxwell and Jung (30) on polyethylene and polystyrene showed a non-linear increase of viscosity due to high pressure
at constant shear rate. At the pressure of 150 MN/m2 , molten polystyrene was reported to act like a solid plug. Other workers (28,31,32) have also confirmed the increasing effect of pressure on viscosity of polymer melts. It was pointed out that a pressure increase of 160 MN/m2 causes a viscosity change by a factor of over one hundred for
polystyrene and a factor of five for polyethylene. Cogswell (33) suggested that the effect of the increase in pressure may be linked to that due to a drop in temperature.
Experimental results reported by Cogswell on low density polyethylene showed an increase in pressure of 100 MN/m2 had the same effect on viscosity as that due to a drop in
o
temperature of 53 C within the melt range.
One of the most comprehensive studies of the effect of pressure on different polymer melts was conducted by Westover (34) based on a similar device used by Maxwell
and Matsuoka (29). Most of the experimental work
carried out by Westover was on a branched 0.92 density polyethylene with pressure varying from 14 MN/m2 to 170 MN/m2 .
2.5- The Effect Of Polymer Flow Characteristics
In the present work polymer melt is subjected to very high shear rates and pressures, much greater than those capable of being investigated in any extrusion rheometer. Crampton (16) concluded that the decrease in coating
thickness was due to the presence of a critical shear stress at low shear rates. It is however believed that, the poor performance of the units at higher drawing speeds is related to a combination of factors such as shear rate, melt flow instability, partial crystallization,
compressibility etc. and not the critical shear stress alone.
The formation of shark skin is thought to take place at the exit end of the unit, therefore, this effect on the performance of the system is neglected. Furthermore, little is known about the crystallization and
VI
SC
OS
IT
Y
AT
ZE
RO
SH
EA
R
RA
TE
NS
m
10
-Uj n
Lu
1 0
-Uj
1 0
-FIG 7 : EFFECT OF TEMPERATURE
ON VISCOSITY OF POLYMERS
2.0 2.1 23 2.4
1.9
2.2
2-51000 • K
FIG 8 : EFFECT OF TEMPERATURE ON VISCOSITY
OF ALKATHENE23 AND POLYPROPYLENE KM 61
1.9 2.0 2.1 2.2 2-3 2-5
[image:51.614.41.533.7.781.2]110
NS
m
01* 111N S S 3H1S aV3HS s
SH
EA
R
RA
TE
S
x1
1 o o 1 o
CD
> ° CM
fn 11 "« CNI ^ R o
1 ° lt»
,U to NO i |, ,|
F"‘
co
CM ^
CD
>-C£L
o
o
Q I—
UJ ' I
cr <c
Cl ca
o
o
LxJ Oo
UJ cc <X UJ o cr o om CM o oCM NOo
cr o C/) o 00 cr O') o m
ot x
uinssaais
uvbhsFIG
11
:
EF
FE
CT
OF
SH
EA
R
RA
TE
ON
CO
OsiCD
oCnI
CO oCO vO LJ Oin o m
CO
o
o
CO
o CO o vO CO o o o oo Ln
f UJSN A 1 I S 0 D S I A
>-L— I— 5
(S) oCM
o
UJ
'o
LU
CO
UJ>
om
CM
cr
ooLU
IE
cr
o
LU
o
CO oLL
LLCD
o CM O O o o o o o o o X "to < cc cc < LU\
\
FIG 13 : A POSSIBLE MECHANISM
OF SHARKSKIN
[image:56.615.33.543.16.789.2]F
IG
H
:
FL
OW
CU
RV
ES
FO
R
0.9
2
PO
LY
ET
H
YL
EN
E
AT
13
0
C
AF TE R W ES T0 VE R (3 4) O . CD "o' CO r* q.°\o '
oO'! t— CCCO ID
O (/)
DC 00
Q LU
>- cc
o
o in
~o
HIIM1
SS3H1S UV3HS WflNIXVWFIG
15
:
VI
SC
OS
IT
Y
VE
RS
US
PR
ES
SU
RE
FO
R
DI
FF
ER
EN
T
SH
EA
R
RA
TE
S
LJ o Om LU LU _1 >-□= I— LU >-_I o Q_ ON o o o o o CC 00 o o o o o LT> UJ cc cc UJ 00 cc oo o o CO0001 x UJ/SN AilS O D SIA
[image:58.613.44.543.11.776.2]CHAPTER 3: Description Of The Experimental Equipment And Design And Development Of The Die-less Units.
3.1- Description Of The Experimental Equipments.
3.2- Modification To The Existing Rig.
3.3- Design And Development Of The Pressure Reduction Units.
3.4- Further Modifications To The Existing Rig.
3.5- Experimental Procedure And Difficulties Encountered.
3.1- Description Of The Experimental Equipments
Initial tests were carried out using the existing
drawing bench originally designed by Stevens (15) and later modified by Crampton (16). A full description of the
apparatus is given below.
The drawing bench consisted of interchangeable bull blocks of 50, 100 and 300mm diameter, driven by a Shraga 3-phase electric motor (type BTH 18/4.5hp V S C .) capable of running at speeds infinitely variable between 550 and 2200 revolutions per minute. The power v/as transmitted from the motor to the bull block via a flexible type tyre coupling
(Fenner F80) , a 29:3 reduction worm gear box (Croft type 41/551/05) and a coupling clutch (Broadbent type DP25) which enabled the bull block to be engaged when the electric motor was running at the required speed, thus providing a rapid'build up to full speed. The above arrangements facilitated drawing speeds infinitely variable betwTeen 0.2 m/s to 4.0 m/s.
The above equipment were mounted on a suitable bench of welded steel construction and guarding were placed around all the moving parts to provide adequate safety.
from the strain gauge bridge was fed, via the transmitter to the UV recorder and the output from the magnetic sensor passed through an amplifier before being fed into a digital counter which gave a visual display of the rotational speed The polymer was heated by means of an electric heater band and the temperature was controlled thermostatically
o
within +4 C of the set temperature using thermocouples connected to a digital meter.
The pressure tube/die unit consisted of a polymer melt reservoir, pressure tube and die, held together with three sockets headed cap screws. A copper seal was
incorporated, between the die and the pressure tube to prevent leakage. The schematic diagram of this unit is shown in figure 6 . The wire coil was placed at the side of the drawing bench on a purpose built stand and a heavy ring was placed over the coil thus preventing the wire
from becoming entangled. Guides and a freely rotating pulley was used to turn the wire through a right angle so that a horizontal feed to the pressure tube was achieved.
3.2- Modification To The Existing Rig
As the experimental work progressed it became
3.3- Design And Development Of The Pressure Reduction Unit
The principal objective of the experimental programme was to optimise the existing wire drawing system with
polymer melt lubrication. Some initial experimental work was conducted by extending Crampton’s research to enhance better understanding of the principles of the process during which the following limitations and problems were encountered:
i)- A leader wire was found absolutely necessary before the drawing process could commence. ii)- Wire breakage was repeatedly occuring before
full drawing speed was reached,
iii)- Die wear prior to hydrodynamic lubrication was noticed.
iv)- Non-uniform wire was produced owing to "Bamboo" effect.
v)- The coating thickness on the wire was reduced at higher drawing speeds.
die was used. These observations gave way to conclusions that as the result of high pressures an effective die v/as formed by the polymer inside the pressure tube and that the reduction die was acting as a seal controlling the flow of the polymer. Since the die was found to be
performing as a means of generating high pressures in the tube, it was then thought that under a special geometrical configuration, it may be possible to eliminate the die from the unit and still generate the necessary pressure within the tube to deform the wire. The suggestion that a die-less wire drawing unit may be developed to reduce the wire diameter by the hydrodynamic action of the
polymer lubricant became a dominant objective in optimising the system to meet industrial requirements.
Theoretical argu ments revealed that such a device had to be dimensionally greater than the nominal wire diameter in order to eliminate some of the existing problems in the conventional wire drawing process. With the concept of the die-less wire drawing in mind, a number of designs were considered to examine the feasibility of such a system.
First it was thought that a suitable tube with its diameter slightly bigger than the undeformed wire could be used instead of the pressure tube thus providing a gap to prevent metal to metal contact during initial insertion of the wire. If the tube was then subjected to external pressures to cause the diameter of the tube to
become smaller than the wire, it would result in deformation of the wire due to the effect of the hydrodynamic
of the required pressure was impractical to achieve for the desired dimensional changes.
Another idea of die-less wire drawing stemmed from the concept of thermal expansion. It is well known that the variation of temperature causes dimensional changes. This led to the idea that a tube with its diameter initially smaller than wire would increase in size when heated, thus providing a gap. between the wire and the tube so preventing metal to metal contact. With the commencement of the
drawing process, the tube would then be cooled to reduce the gap and induce deformation of wire under hydrodynamic lubrication condition. Calculations for the necessary expansion of the tube indicated that an extremely large temperature rise was required to cause the satisfactory dimensional changes. The above methods were soon abandoned due to their inconveniences.
The third attempt produced a unit the schematic
diagram of which is shown in figure 16. It consisted of two parts, a stepped bore cylindrical body and a special
purpose nut. The external diameter of the main cylindrical body was reduced once to match the internal diameter of the threaded nut and again to a smaller size which then gradually tapered down over a certain length. This tapering length of the main body was slitted into four equal
segments to achieve variable bore size by tightening the nut. This nut had a parallel bore with internal thread to match with the externally threaded part of the main body
and a length having tapered bore which progressively