Community Kernels Detection in OSN using SVM
Clustering and Classification
Rahul Nema
Department of Information Technology S.O.I.T, RGPV
Bhopal, India
Anjana Pandey
Department of Information Technology S.O.I.T, RGPV
Bhopal, India
ABSTRACT
Security is an important issue in online social networking web sites. Here in OSN users can post their messages publicly on wall. In OSN a person may be attached to a community and can post any message on their friend’s wall, hence it is necessary to check the validity of the user in the communities. Although there are various techniques implemented for the detection of community kernels in OSN. Here in this paper a new and efficient technique for the detection of community kernels in large OSN using combinatorial method of support vector machine based clustering and classification of Community kernels in the dataset is proposed. The proposed technique implemented provides high precision and recall as compared to the existing technique of Greedy and WEBA.
Keywords
OSN, SNA, Community Kernels, Google+, twitter, Co-author, Wikipedia.
1.
INTRODUCTION
In many systems in the world can be represented as networks in which network links represent relationships between the interrelating parts (nodes) of the systems. Examples of well-known networks are social media and online social networking sites such as Facebook, Google+, and Twitter. Networks have been used to model systems of interrelating parts in many fields ranging from social sciences to behavioral ecology to molecular biology, from civil engineering to electrical engineering, to computer science. Network links, in different domains, represent various kinds of relationships such as human friendship, organizational structures, physical proximity of animals, interconnectivity of infrastructures, Web hyperlinks, or even more abstract relationships such as similarity of data points.
One of the most important observations about networks in the nature is the existence of communities [1-3]. Communities, also known as modules and clusters, are sets of nodes which are relatively more connected, and are believed to be the intrinsic structures in networks in the nature. Nodes in the same community often share interesting properties such as a common function, interest, or purpose. Thus, community detection is one of the most important problems in network analysis. Among the areas to which network analysis is applicable, the research interest is specifically in developing computational methods for analyzing networks which arise in sociology and behavioral ecology such as those which describe friendship links and animal social interactions.
1.1
Social Networks
Networks have been studied as graphs in mathematics, physics, sociology, engineering and computer science, biology and economics. Each field has its own theory of networks and each field has its own way of aggregating collective behavior.
Social network analysis (SNA) is a set of research procedures for identifying structures in systems based on the relations among actors. Grounded in graph and system theories, this approach has proven to be a powerful tool for studying networks in physical and social worlds, including on the web [4-6]. SNA focuses on relations and ties in studying actor’s behavior and attitudes. Thus the positions of actors within a network and the strength of ties between them become critically important. Social position can be evaluated by finding the centrality of a node identified through a number of connections among network members. Such measures are used to characterize degrees of influence, prominence and importance of certain members [7]. Tie strength mostly involves closeness of bond. There is general agreement that strong ties contribute to intensive resource exchange and close communities, whereas weak ties provide integration of relatively separated social groups into larger social networks [8,9].
1.2
Community Detection
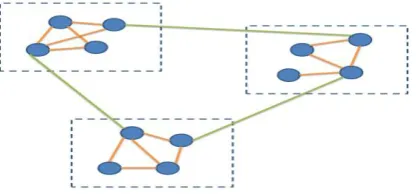
In a social network a community represents individuals that form a group distinguishable by its properties or characteristics. In other words when say that encountered a community it might be for example a group of friends, family, work colleagues or other group of individuals with same characteristics and label inside the context of a network.
[image:1.595.321.530.639.736.2]Detection of communities on a network has many applications, for example clients that have the same interests and are geographically near each other might be beneficiary of the implementation of mirror servers for faster services on the World Wide Web. The identification of retail clients with similar interests in products enables the retailer to give better recommendation services and therefore augment the probability of rising profits and service quality. On telecommunications and computer networks community structures of nodes can help to improve compactness of routing tables maintaining efficient choice of communication paths. Regarding community structure several areas give much importance if the node lives inside a community or on the boundaries of the community.
1.3
Community Detection Algorithms
Community detection in graphs has been generally defined but multiple methods of estimating quality of the detection exist. The majority of current works on community detection relies on improving the modularity value [10]. Modularity can therefore be used to compare different approaches to community detection. There is a good compilation of approaches to communities detection in [11] which resumes saying that the majority of techniques can be divided into two different approaches: agglomerative and divisive.
2.
RELATED WORK
Zhao et al. [12] present a general framework for intelligent analysis and monitoring the security of network information content in high-speed network. The system can intelligently gather and transform various channels of non-structured, semi-structured and structured data based on broadband network, carry on security assurance related characteristic selections and topic identification, perform social network analysis of email. The system can help information security experts find the association rules in the results from various analyzing levels, and visualize association patterns by their relational structures from Link analysis techniques and provide early warning to system administrators. Peer-to-Peer networks can be seen as truly distributed computing systems. Each peer is both a client and a server in these networks. A reasonable trust construction approach for these systems comes from the social network analysis. Zhang et al. [13] proposes a recommendation-based global trust model for Peer-to-Peer network, which is easy to implement. In their model, a peer’s trust information is defined by its past transactions with other peers. Each peer’s global reliability is decided by two factors: one is the reliability of the peer that it transacts with, the other is the corresponding recommendation degree provided by the transaction peer. A peer’s trust value is calculated from the in-degree, corresponding weight (recommendation degree) and the recommend peer’s trust value. They also introduce some security mechanism into this model to defense several attacks, such as tamper, pretend, slander and exaggerate.
Social networks are also useful for judging the trustworthiness of outsiders. Boykin & Roychowdhury [14] propose an automated anti-spam tool that exploits the properties of social networks to distinguish between unsolicited commercial e-mail (spam) and messages associated with people the user knows. This technique is predicated on recognizing the unique characteristics inherent to social networks. The natural instinct to form close knit social networks operating in cyberspace has been exploited to provide an effective and automated spam-filtering algorithm. They use the quantitative definition of the clustering coefficient that involves counting the fraction of a node’s neighbors that are also each other’s neighbors. Nolker & Zhou [15] propose a novel approach to identifying key members and their roles by discovering implicit knowledge from online communities. They focus on an open discussion bulletin board and have identified three roles that are important to this type of online community namely, Leaders (individuals that are in a position to spread knowledge and provide cohesiveness and consistency), Motivators (individuals that keep conversation going) and Chatters. They view this online community as a social network connected by member-member relationships. To understand conversation and its interplay with relationships, the relationship-based measures from the social network
combined with behavior-based measures from the information retrieval realm (i.e., TF-IDF) to determine the key members. This approach was tested on real world data collected from a Usenet bulletin board over a one year period. It was shown that this approach was able to identify prominent members whose behaviors are community supportive and filter chatters whose behaviors are superficial to the online community. To assist law enforcement and intelligence agencies ascertain terrorist network knowledge efficiently and effectively, Memon & Larsen [16] propose a framework of automated analysis, visualization and destabilization of terrorist networks. Based on this framework, they have developed a prototype called iMiner that incorporated several techniques, including social network analysis, for automatically detecting cells from a network, identifying various roles in a network (e.g., central members, gatekeepers, and followers), and may also assist law enforcement about the effect on the network after capturing or killing a terrorist in a network. They treat a terrorist network as an undirected graph. Using degree centrality and eigenvector centrality from SNA the undirected graph was converted into a directed graph. They define a new centrality measure called dependence centrality. The dependence centrality (DC) of a node is defined as how much that node is dependent on any other node in the network. Their approach involves converting the directed graph into a hierarchical chart using this newly proposed centrality measure. From this hierarchical chart, it is possible to distinguish the leaders and peripheries in the network in order to destabilize the network. The key players have low dependence centrality (DC) as they have large number of direct links with other nodes of the network and they do not depend on others to communicate with those nodes.
Girvan & Newmann [2] is based on the edge between’s that measures the fraction of all shortest paths passing on a given link. By removing links with high between’s, it can progressively split the whole network into disconnected components, until the network is decomposed in communities consisting of one single node. Girvan & Newmann have generalized Freeman’s between’s centrality to edges and defined the edge between’s of a link as the number of shortest paths between pairs of vertices that run along it. If a network contains communities or groups that is only loosely connected by a few inter group edges, then all shortest paths between different communities must go along one of these few edges. Thus, the edges connecting communities will have high edge between’s. By removing these edges, needs to separate groups from one another and so reveal the underlying community structure. Its major drawback is the computational cost. Calculation of link between’s the most computer intensive part of the algorithm. This calculation needs to be repeated every time a link is removed as the between’s of all the other links is affected.
this is that edges connecting nodes in different communities are included in few or no triangles and tend to have small values of the edge clustering coefficient. On the other hand, many triangles exist within clusters. The algorithm is fast, since it calculates the clustering coefficient with local information only, hence overcoming the major drawback of the GN algorithm.
3.
PROPOSED METHODOLOGY
The proposed methodology implemented here works in following stages.
1. Take an input OSN dataset. 2. Preprocess the input training dataset.
3. Apply SVM clustering for the clustering of similar values in the dataset.
4. Detect and classify Community kernels from the input dataset.
3.1
OSN Dataset
The online social network dataset includes twitter dataset and facebook dataset or Co-author dataset. These datasets mainly contains various nodes and edges between them which shows the relationship or linking between users. Some of these datasets contains community which needs to be identified.
3.2
SVM Clustering
Support Vector machine is a learning algorithm which work on the basis of linear kernel and Gaussian kernel. It takes ‘X’ and ‘Y’ as input parameters with gamma and Class index ‘C’, where each of the data in ‘X’ contains value and ‘Y’ contains their respective cluster label.
SVM Clustering
1. Input: number of values and their respective labels as (x1, x2, x3……xn) and labels as (y1,y2,y3…….yn) and gamma and Class index Coefficient.
2. Initialize a matrix ‘Si’ with empty set ∅ 3. repeat for all values in the matrix 4. for i=1,...n do
5. Ent(y) =∆ 𝑦𝑖, 𝑦 + 𝑤𝑇𝜓 𝑥𝑖, 𝑦 − 𝑤𝑇𝜓(𝑥𝑖, 𝑦𝑖) 6. compute Y=argmaxy∈ 𝑦𝐻(𝑦)
7. compute T=max{0,maxy∈ 𝑆𝑖𝐻(𝑦) 8. if H(Y)>Ti + ∈ 𝑡ℎ𝑒𝑛
9. SiSi ∪ {𝑌}
10. woptimize primal over S=∪ 𝑖𝑆𝑖 11. end if
12. end for
13. until no Si has changed during iteration.
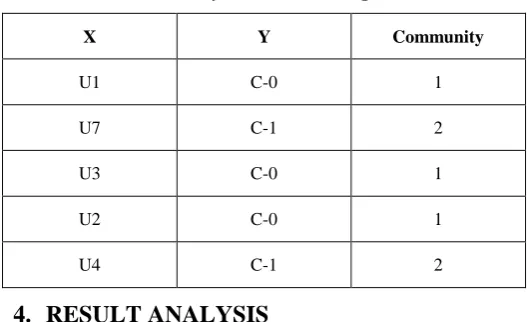
As soon as the clustering is done on the input dataset. Detection is done using classification of the dataset. The table shown below is the SVM data values and their corresponding labels on the basis of which communities can be detected and classified.
Here ‘X’ contains various users in the OSN and when SVM is applied on these values to get the resultant cluster labels and hence can be detected as community kernel or not.
Table 1. Community classification using SVM
X Y Community
U1 C-0 1
U7 C-1 2
U3 C-0 1
U2 C-0 1
U4 C-1 2
4.
RESULT ANALYSIS
Here in the proposed methodology is applied on three OSN datasets.
1. Coauthor: It consists of a Coauthor relation network of nearly 822415 nodes in the network and 2928360 edges which are undirected. Each of the edge is connected to a node that shows the relationship between nodes.
2. Wikipedia: This dataset contains 310990 number of nodes in the network and 10780996n edges with each of the node is connected with a edge to the other node.
3.
Twitter: The dataset is established with 465023 number of nodes and 833590 edges in the relation and edges are directed.The table shown below is the comparison of CPU Utilization on the basis of three datasets. The table shows the performance of the proposed methodology.
Table 2. Comparison of CPU Utilization
Dataset Greedy WEBA Proposed
Co-author 84 120 53
Wikipedia 22.4 50.6 17.43
Twitter 9.7 24.7 4.39
[image:3.595.309.573.119.280.2]The table shown below is the comparison of precision on the basis of three datasets. The table shows the performance of the proposed methodology.
Table 3. Comparison of Precision
Precision Co-author Wikipedia
WEBA 0.911 0.458
Greedy 0.368 0.752
The table shown below is the analysis of various techniques that are implemented for the detection of community kernels in OSN. The proposed methodology implemented provides high recall as compared to the other existing techniques.
Table 4. Comparison of Recall
Recall Co-author Wikipedia
WEBA 0.664 0.58
Greedy 0.659 0.466
Proposed 0.784 0.731
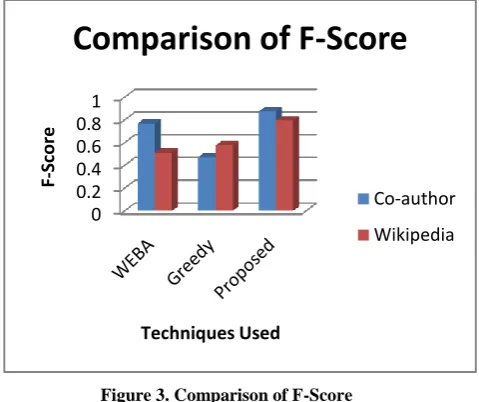
The table shown below is the analysis of various techniques that are implemented for the detection of community kernels in OSN. The proposed methodology implemented provides high F-score as compared to the other existing techniques.
Table 5. Comparison of F-Score
F-Score Co-author Wikipedia
WEBA 0.7681321 0.5118304
Greedy 0.4722726 0.575422
Proposed 0.8722943 0.7957145
[image:4.595.53.276.131.229.2]The figure shown below is the comparison of various techniques for the detection of community kernels on the basis of three datasets. The proposed methodology provides efficient CPU Utilization as compared to the other existing technique of Community detection.
Figure 2. Comparison of CPU Utilization
[image:4.595.317.561.321.506.2]The figure shown below is the comparison of various techniques for the detection of community kernels on the basis of three datasets. The proposed methodology provides efficient Accuracy as compared to the other existing technique of Community detection.
Figure 3. Comparison of F-Score
The figure shown below is the comparison of precision on the basis of three datasets. The table shows the performance of the proposed methodology.
Figure 4. Comparison of Precision
The figure shown below is the analysis of various techniques that are implemented for the detection of community kernels in OSN. The proposed methodology implemented provides high recall as compared to the other existing techniques.
Figure 5. Comparison of Recall
0 20 40 60 80 100 120
CPU
Util
ization
Dataset
Comparison of CPU
Utilization
Greedy
WEBA
Proposed
0 0.2 0.4 0.6 0.8 1
F-Sc
o
re
Techniques Used
Comparison of F-Score
Co-author
Wikipedia
0 0.2 0.4 0.6 0.81 1.2
Pr
e
ci
si
o
n
Detection Techniques
Comparison of Precision
Co-author
Wikipedia
0 0.2 0.4 0.6 0.8 1
R
e
cal
l
Detection Techniques
Comparison of Recall
Co-author
[image:4.595.53.283.458.698.2] [image:4.595.317.566.565.747.2]5.
CONCLUSION AND FUTURE WORK
The proposed methodology implemented here for the detection of community kernels in OSN provides high precision and recall as compared to other existing technique of community detection. The methodology correctly detected the communities in the OSN dataset. The result is compare on the basis of three large datasets co-author, Wikipedia and twitter dataset.
The result analysis shows the performance of the proposed methodology. The proposed methodology implemented here provides high precision and recall as well as provides high CPU Utilization.
Although the technique implemented here for the detection of community kernels provides high accuracy and has high precision and recall but further enhancements can be done for the improvement of accuracy as well as for the small dataset.
6.
REFERENCES
[1] Bruhn, J.: The Sociology of Community Connections. Springer Science+Business Media B.V., 2011
[2] Girvan, M. and Newman, M. E. J.: Community structure in social and biological networks. Proceedings of the National Academy of Sciences, 99(12):7821-7826, 2002. [3] Wellman, B.: The network community: An introduction to networks in the global village. Networks in the Global Village, 1999
[4] S.D. Berkowitz. An Introduction to Structural Analysis: The Network Approach to Social Research. Toronto: Butterworths, 1982.
[5] Lada A. Adamic. The small world web. In Proceedings of the third European Conference on Research and Advanced Technology for Digital Libraries, ECDL, number 1696, pages 443–452. Springer-Verlag, 1999. [6] Réka Albert and Albert-László Barabási. Statistical
mechanics of complex networks. Reviews of Modern Physics, 74:47–97, 2002.
[7] Faust K. Centrality in affiliation networks. Social Networks, 19:157–191, April 1997.
[8] M.S. Granovetter. The strength of weak ties. American Journal of Sociology, 78:1360–1380, 1973.
[9] BarryWellman and ScotWortley. Different strokes from different folks: Community ties and social support. The American Journal of Sociology, 96(3):558–588, November 1990.
[10]Newman, M. "Modularity and community structure in networks". Proceedings of the National Academy of Sciences of the United States of America 103(23):8577—82, 2006.
[11]Fortunato, S. "Community detection in graphs" Physics Reports 486(3–5):75-174, Physics Reports, 2010. [12]Yangping Zhao, Jizhuang Zhao, and Rongsheng Xu.
Network information content security: a framework for intelligent analysis and monitoring. icsssm, 2:841–843 Vol. 2, 2005.
[13]Zhen Zhang; Xiao-Ming Wang; Yun-Xiao Wang. A p2p global trust model based on recommendation. Machine Learning and Cybernetics, Proceedings of 2005 International Conference on, 7:3975–3980 Vol. 7, 18-21 Aug. 2005.
[14]P. Oscar Boykin and Vwani P. Roychowdhury. Leveraging social networks to fight spam. Computer, 38(4):61–68, 2005.
[15]Robert D. Nolker and Lina Zhou. Social computing and weighting to identify member roles in online communities. In Web Intelligence, pages 87–93, 2005. [16]Nasrullah Memon and Henrik Legind Larsen. Practical
algorithms for destabilizing terrorist networks. In Proceedings of the The First International Conference on Availability, Reliability and Security, ARES, pages 389– 400, 2006.