ISSN 2250-3153
http://dx.doi.org/10.29322/IJSRP.9.10.2019.p9444 www.ijsrp.org
Classification of Normal and Epileptic EEG Signals
Using Simple Statistical Feature Extraction
Khin Mu Mu Myint*, La Pyae Lynn**, Phyu Phyu Htun **
* Department of Mechatronic Engineering, Yangon Technological University Yangon, Myanmar
** Department of Mechatronic Engineering, Yangon Technological University Yangon, Myanmar
DOI: 10.29322/IJSRP.9.10.2019.p9444 http://dx.doi.org/10.29322/IJSRP.9.10.2019.p9444
Abstract- Electroencephalogram (EEG) is a useful, lost-cost, non-invasive technique used in clinical studies to check the electrical activity of the brain. EEG is widely used in medicine for symptomatic and analysis of several situations such as epilepsy, brain tumors. Epilepsy is a neurological disease that referred to as a disorder of the central nervous system distinguished by the loss of consciousness and seizures. This paper intends to classify the normal and epileptic EEG signals using the extraction of simple statistical features from the signals. The four features such as mean, standard deviation, average power, and kurtosis are used to classify the state. Before extracting the features from the signals, DWT based sub-band decomposition is used to filter the undesired signals. In this work, the dataset contains two sets (Set A and Set E) from the five normal healthy people and five epileptic people. To do the experiment, 160 data (80 normal and 80 epilepsy) has been used as training data and 40 data (20 normal and 20 epilepsy) has been used as test data. The accuracy of the classification result is 97.5%. The proposed statistical features based classification method is a reliable, easy, and fast method for the classification of EEG signals.
Index Terms- EEG signal, Epileptic seizure detection, Statistical features extraction, Discrete Wavelet Transform, non-invasive techniques
I. INTRODUCTION
he human brain is a complicated structure managed and among many neurological diseases, epilepsy holds second place after stroke where 50 million people suffer globally [1]. The billions of neurons in the human brain have highly complex firing patterns, mixing in a rather intricate fashion. The neural vibrations that can be measured with EEG are even visible in raw, unfiltered, unprocessed data. Nevertheless, the signal is always a compound of numerous underlying base frequencies, which are considered to reflect certain cognitive, affective or attentional states. Because these frequencies vary insignificantly dependent on specific factors, stimulus properties, and internal states, research classifies these frequencies based on specific frequency ranges, or frequency bands: Delta band (1 – 4 Hz), theta band (4 – 8 Hz), alpha band (8 – 12 Hz), beta band (12 – 25 Hz) and gamma band (> 25 Hz) [2].
Electroencephalography (EEG) is a useful method to monitor the nonlinear electrical function of the brain’s nerve cells; thus, it is a valuable tool for the epilepsy evaluation and treatment [3]. Epilepsy can be potentially life-threatening with brain failure, heart and lung failure, head trauma due to accidents and sudden accidental death. Even understated epileptic can cause insignificant harm in the brain. Long-term problems such as fall in intelligence quotient (IQ), depression, suicide, social problems may lead to reduce the quality of life. So the investigation of epilepsy is the most important in the existing development of research. The main challenge is to detect epilepsy seizures, to maintain independence in the patient’s life, and also to help the person with epilepsy to lead a full and fruitful life [4]. Epilepsy is unexpected and repeated seizures can result from large numbers of neurons going through an excessive and synchronous electrical discharge. The idiopathic epilepsy is the most common type of epilepsy, which may affect 6 (out of 10) people with the disorder, and it has no detectable cause. Epilepsy which may take place due to a known cause is called secondary epilepsy or symptomatic epilepsy. The major causes of secondary epilepsy are the brain may get impairment from injuries, inherited abnormalities with associated brain defects, a severe head injury, stroke may limit the amount of oxygen to the brain, some infection like meningitis and encephalitis of the human brain and a brain tumor which creates more randomness [5].
There are various techniques to diagnose epilepsy such as electroencephalography (EEG), magnetic resonance imaging (MRI), functional magnetic resonance imaging (fMRI), single-photon emission computed tomography (SPECT), positron emission tomography (PET), and magnetoencephalography (MEG). As EEG has speed, high time resolution, and non-invasive advantages, still now it remains one of the most useful and effective tools in the treatment of epilepsy. Prediction of epileptic seizure based on EEG signals separated into three classes: time domain, frequency domain, and the nonlinear methods [6].
ISSN 2250-3153
detection techniques are namely that the mimetic techniques, morphological analysis, template matching algorithms, parametric methods, independent component analysis (ICA), artificial neural networks, clustering techniques, knowledge-based rules, data mining, and classification techniques [8].
The author Harender presents a framework for epileptic seizure detection from recorded EEG signals for a healthy and epileptic patient. Simulink used to model, EEG signal decomposition using discrete wavelet transform (DWT) After DWT decomposition, a statistical feature for epilepsy detection with k-Nearest Neighbor (k-NN) classifier used to classify. Results showed that k-NN classifier gives better accuracy with SD and SD with MA for eyes open and epileptic seizure dataset with less number of extracted features [9]. The other authors A.Sharmila & P.Mahalakshmi described that a constructive pattern recognition strategy for analyzing EEG data as normal and epileptic seizures proposed. With this strategy, the signals decomposed into frequency sub-bands using discrete wavelet transform (DWT). Principal component analysis (PCA) and linear discriminant analysis (LDA) were applied to reduce the dimensionality of EEG data. These reduced features used as input to Naïve Bayes and K-Nearest Neighbour Classifier to classify normal or epileptic seizure signals. The performance of the classifier was evaluated terms of accuracy, sensitivity, and specificity. This evaluation used to propose a reliable, practical epilepsy detection method to enhance the patient’s care and quality of life [10]. In this work, DWT is applied to decompose the input signals and statistical features are extracted from the signals to classify. There are five main components to know the results. They are signals acquisition, pre-processing, features extraction, classification and displaying the result. This paper created into four sections: Section I is about a brief introduction to EEG signals and epilepsy, section II describe the methodology and procedure of the proposed system, section III presents experimental test and result obtained from the study. Finally, section IV expresses the conclusion of this system. The overall block diagram of the proposed system is shown in Fig.1.
Fig.1 Overall block diagram of the system
II. METHODOLOGY AND PROCEDURE
In this proposed method, there are eight parts to perform the system. Firstly, signal acquisition is needed to get the required data and next sub-band decomposition using DWT, select the D5 signal, Butterworth Bandpass filter, Butterworth Lowpass filter to get the correct value, extracting the features, and classification. Finally, the result shows the normal and epileptic condition of EEG signals from the people. The flow chart of the system is shown in Fig.2.
Signal Acquisition
Sub-band Decomposition using DWT
Butterworth Lowpass Filter (6) to get the definite value
ISSN 2250-3153
[image:3.612.202.425.177.351.2]http://dx.doi.org/10.29322/IJSRP.9.10.2019.p9444 www.ijsrp.org
Fig. 2 Flow chart of the overall system A. Signal Acquisition
The EEG data is used in this study were collected from the Department of Epitology at the University of Bonn, Germany [11]. The data consist of five sets that are called set A to E and each data set takes 23.6 s consisting of 100 EEG segments recorded on the scalp by a single channel. The set A and set B include surface EEG recordings that are collected from five healthy subjects while eyes were opened and closed, individually using a standardized electrode placement scheme. The dataset of sets C, D and E were received from five epileptic patients undergoing pre-surgical evaluations. Set C was recorded on patients before the epileptic attack at hemisphere hippocampal formation and set D was recorded from the epileptogenic zone. The data set E was recorded from patients during an epilepsy occurrence using depth electrodes placed within the epileptogenic zone.
Fig.3 EEG signals for Set A to Set E in time domain
Fig.3 shown the sample signals for Set A to Set E of the data of the University of Bonn. The data was recorded with a 128-channel amplifier system and digitized through 12-bit A/D converter with a sampling frequency of 174 Hz. The data from set A to E consists of 100 files, and each file contains 4097 successive EEG signals. In this work, only data from set A and set E have been taken, so a total of 200 data were obtained for these sets. The performance can be evaluated from the results obtained for 160 training data and 40 testing data for normal and epileptic patients.
B. Sub-Band Decomposition using DWT
[image:3.612.241.382.594.737.2]ISSN 2250-3153
Fig.4 Level five Wavelet Decomposition of input EEG signal
Fig. 5 Wavelet Decomposition of sample EEG epoch of Set A
Fig. 6 Wavelet Decomposition of sample EEG epoch of Set E
Fig.4 shows the level five wavelet decomposition of input EEG signal. Fig. 5 and Fig.6 show the Wavelet Decomposition of sample EEG signal for normal and epileptic EEG signals of Set A and Set E.
C. Butterworth Filter
The D5 signal is selected form the EEG signal which is passed through the DWT decomposition state. In the D5 signal, which has some noise parts. Therefore, the signals require to remove the noise using the Butterworth filter. Firstly, the Bandpass Butterworth filter is used to select the range of the frequency between 1 to 60 Hz. And then this output signal is passed through a Lowpass Butterworth filter to restrict the frequency up to 6 Hz.
ISSN 2250-3153
http://dx.doi.org/10.29322/IJSRP.9.10.2019.p9444 www.ijsrp.org
3) Average Power (AP): Average Power is a feature provides information about eh frequency content of the signal and the mathematic expression is given in equation (3).
4) Kurtosis (K): Kurtosis is a measure of the probability distribution of the signal and calculated using the equation (4).
Where,
Xj represents jth sample in EEG dataset, μ represents mean and L is segment length.
E. Classification of the EEG Signal
The classification step is the final part to display the result of EEG signals. The purpose of the classifier is to identify, epilepsy abnormality in EEG data by linear/non-linear mathematical approach. There are a lot of classification techniques. K-NN classifier and SVM classifier are used in this study.
III.TEST AND RESULT
The total data used in this system is 200 data from Set A and Set E. The 80% of the total data are used as training data and 20% of the total data are used as testing data. So, the number of the training data is 160 and the number of the testing data is 40. The statistical feature value of 20 normal and 20 epileptic testing EEG signals express in Table 1.
TABLE 1
STATISTICAL FEATURE VALUES FOR TESTING DATA
No. Type Mean SD AVP K (Kurtosis)
1 Normal 0.0057 16.9592 287.5451 4.4919
2 Normal 0.0152 14.0820 198.2534 5.0129
3 Normal 0.0091 8.2492 68.0320 4.5387
4 Normal -0.0258 11.4619 131.3449 3.7587
5 Normal -0.0308 15.5607 242.0773 3.7177
6 Normal -0.0096 12.7337 162.1069 3.2542
7 Normal -0.0630 11.1827 125.0263 3.4008
8 Normal 0.0535 14.6306 214.0041 3.8541
9 Normal 0.0050 10.7072 114.6165 3.2637
10 Normal 0.0063 15.6425 244.6278 3.7671
11 Normal -0.0335 14.6747 215.2949 2.9560
12 Normal -0.0193 12.9084 166.5855 5.0167
13 Normal 0.0023 14.0014 195.9903 3.9251
14 Normal 0.0096 15.6066 243.5051 2.6999
15 Normal 0.0018 16.4979 272.1131 3.1459
16 Normal -0.0952 12.7894 163.5385 4.1916
17 Normal 0.0436 12.9851 168.5733 3.6101
18 Normal -0.0406 12.6403 159.7396 3.6894
AP = 1𝐿 ∑𝐿 /𝑋𝑗/ 2
𝑗=0 (3)
K = 𝐸(𝑋𝑗−𝜇)
4
ISSN 2250-3153
No. Type Mean SD AVP K (Kurtosis)
19 Normal -0.0227 15.2219 231.6506 3.7449
20 Normal -0.0058 14.4496 208.7410 3.2231
21 Epilepsy 0.7789 255.1827 65102.9173 2.4869
22 Epilepsy -0.1862 171.9687 29566.0415 2.5116
23 Epilepsy -0.1000 31.8094 1011.6019 3.1085
24 Epilepsy -0.0179 53.3434 2844.8236 3.6649
25 Epilepsy 0.2735 203.3345 41334.8918 2.4581
26 Epilepsy 0.0653 46.6200 2172.8971 3.5776
27 Epilepsy 0.6281 237.6694 56473.3704 2.3043
28 Epilepsy 0.2833 82.8161 6856.9178 2.6429
29 Epilepsy 0.1244 62.1670 3863.8036 3.3348
30 Epilepsy -0.3897 105.4930 11126.2038 3.9878
31 Epilepsy -0.5364 245.6477 60328.3620 2.9413
32 Epilepsy 0.4129 145.6145 21198.5701 2.5174
33 Epilepsy 0.0562 214.0767 45817.6568 3.1081
34 Epilepsy -0.1959 126.0139 15875.6656 3.0597
35 Epilepsy 0.0070 87.0571 7577.0901 2.5151
36 Epilepsy 0.1109 47.1027 2218.1350 3.5794
37 Epilepsy -0.2877 271.4051 73642.8353 2.6731
38 Epilepsy -0.1204 119.6173 14304.8235 2.8225
39 Epilepsy 0.7061 123.4914 15246.8952 2.7535
40 Epilepsy -0.1647 130.7472 17090.6746 2.7582
[image:6.612.175.414.528.714.2]ISSN 2250-3153
http://dx.doi.org/10.29322/IJSRP.9.10.2019.p9444 www.ijsrp.org
IV. Conclusions
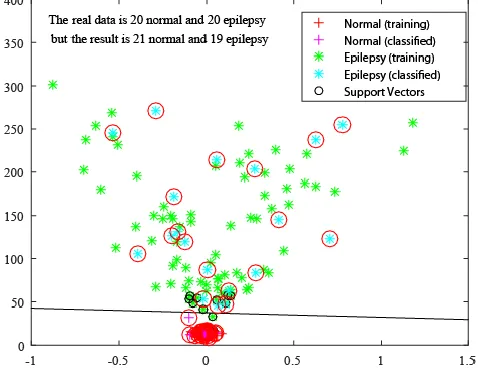
The feature extraction method is a significant, low-cost, and very effective method in medical diagnosis systems, constrain that the medical data to be investigated in lesser time with good accuracy. In this study, only four statistical features derived from EEG signals are vital for outstanding epileptic seizure classification. In the total 40 testing data, the real test data is 20 normal and 20 epilepsy. The result display 21 normal and 19 epilepsy. One of the epileptic EEG signals is showed as the normal signal. Mostly, the wrong signals are epileptic signals. For that reason, the accuracy of the result is 97.5%. There are some limitation in this system about the length (time) of the input EEG signals. The length of the data used in this study is 23.6 s. This limitation will be solved by other time-frequency techniques. The important role of the classification section will be discussed in the next time.
ACKNOWLEDGMENT
Special thanks are due to with supervision of Dr. La Pyae Lynn and Dr. Phyu Phyu Htun from the Department of Mechatronic Engineering (Yangon Technological University) for their kindness and guidelines for this paper. The author appreciates all the teachers from the Department of Mechatronic Engineering (Yangon Technological University) for their support, encouragement, motivation and invaluable guidance in the preparation of this research. The authors would like to express their thanks to all the preparation period of this paper. All preparation period of this paper. Motivation and invaluable guidance in the preparation of this research. The authors would like to express their thanks to all the preparation period of this paper.
REFERENCES
[1] World Health Organization (WHO), Epilepsy fact sheet, 2009 (online).http://www.who.int/mental_health/neurology/epilepsy/en/ [2] Pocket Guide,2016,iMotions, Biometric Research Platform.
[3] Rizvi, S.A.; Zenteno, J.F.T.; Crawford, S.L.; Wu, A. Outpatient ambulatory eeg as an option for epilepsysurgery evaluation instead of inpatient eeg telemetry. Epilepsy Behav. Case Rep. 2013, 1, 39–41.
[4] A. Sharmila, P.Geethanjali, “DWT based Epileptic Seizure Detection from EEG signals using Naïve Baues/k-NN Classifiers”.In: IEEE 2016-00333.
[5] U. R. Acharya, F. Molinari, and S. V. Sree, “Automated diagnosis of epileptic EEG using entropies,” Biomedical Signal Processing and Control, vol. 7, no. 4, pp. 401–408, 2012.
[6] G. Giannakakis, V. Sakkalis, M. Pediaditis, and M. Tsiknakis, “Methods for seizure detection and prediction: an overview,” Modern Electroencephalographic Assessment Techniques, vol. 91, pp. 131–157, 2015.
[7] Gotman J. Automatic recognition of epileptic seizures in the EEG. Electroencephalogr Clin Neurophysiol. 1982;54:530–540. [8] Wilson SB, Emerson R. Spike detection: a review and comparison of algorithms. Clin Neurophysiol. 2002; 113:1873–1881. [9] Harende and R.K.Sharma,‘ DWT based Epileptic Seizure Detection from EEG signal using k-NN classifier’. In IEEE 2017.
[10] A.Shamila & Mahalakshmi,‘Wavelet-based feature extraction for classification of epileptic seizure EEG signal’. In Journal of Medical Engineering & Techology in 2017.
[11] EEG Database from University of Bonn, Germany.[Online]. Available: http://www.epileptologiebonn.de.
AUTHORS
First Author – Khin Mu Mu Myint, PhD (Candidate), Yangon Technological University and [email protected].
Second Author – La Pyae Lynn, Professor, Yangon Technological University and [email protected].