Business Administration Dissertations Programs in Business Administration
12-7-2016
Leadership in Small U.S. Industrial Machining and
Fabricating Companies
Christopher Gabers
Follow this and additional works at:https://scholarworks.gsu.edu/bus_admin_diss
This Dissertation is brought to you for free and open access by the Programs in Business Administration at ScholarWorks @ Georgia State University. It has been accepted for inclusion in Business Administration Dissertations by an authorized administrator of ScholarWorks @ Georgia State University. For more information, please [email protected].
Recommended Citation
Gabers, Christopher, "Leadership in Small U.S. Industrial Machining and Fabricating Companies." Dissertation, Georgia State University, 2016.
PERMISSION TO BORROW
In presenting this dissertation as a partial fulfillment of the requirements for an advanced degree from Georgia State University, I agree that the Library of the University shall make it available for inspection and circulation in accordance with its regulations governing materials of this type. I agree that permission to quote from, copy from, or publish this dissertation may be granted by the author or, in his absence, the professor under whose direction it was written or, in his absence, by the Dean of the Robinson College of Business. Such quoting, copying, or publishing must be solely for scholarly purposes and must not involve potential financial gain. It is understood that any copying from or publication of this dissertation that involves potential gain will not be allowed without written permission of the author.
NOTICE TO BORROWERS
All dissertations deposited in the Georgia State University Library must be used only in accordance with the stipulations prescribed by the author in the proceeding statement.
The author of this dissertation is:
Christopher W. Gabers 1206 Chloe Drive Gallatin, TN 37066
The director of this dissertation is:
Dr. Conrad S. Ciccotello
J. Mack Robinson College of Business Georgia State University
Leadership in Small U.S. Industrial Machining and Fabricating Companies
by
Christopher W. Gabers
A Dissertation Submitted in Partial Fulfillment of the Requirements for the Degree
Of
Executive Doctorate in Business
In the Robinson College of Business
Of
Georgia State University
GEORGIA STATE UNIVERSITY
ROBINSON COLLEGE OF BUSINESS
Copyright by Christopher W. Gabers
ACCEPTANCE
This dissertation was prepared under the direction of Christopher W. Gabers Dissertation Committee. It has been approved and accepted by all members of that committee, and is
has been accepted in partial fulfillment of the requirements for the degree of Executive
Doctorate in Business Administration in the J. Mack Robinson College of Business of
Georgia State University.
Richard Phillips, Dean
DISSERTATION COMMITTEE
Dr. Conrad S. Ciccotello (Chair) Dr. Karen Loch
ACKNOWLEDGEMENTS
How does one acknowledge, give thanks, and gratitude to so many people that
have been a part of this journey. I will simply start by saying…Thank you!! This path
would have never been possible without the unconditional support I was afforded by my
spouse and children. My Love, you were my rock and guiding light when I needed it
most. Additionally, the support I have been blessed with my entire life from my parents,
siblings and entire family network continued to give me focus and drive to the finish line.
I would like to give a special thanks to each of my committee members for
continually supporting me even when the research seemed like it was unobtainable. I
would also like to acknowledge the amazing staff and faculty of the Executive Doctorate
in Business program as well each of my classmates. Each participating member of this
program became more than just a professor, tutor, director, or, classmate, they became
my Georgia State University family.
Sir Isaac Newton famously stated, “If I have seen further it is by standing on the
shoulders of giants”. To this end, I dedicate this work to all of the “giants” who have
come before me as well as the ones who are still with me. Each of you have propelled me
to such a time as this. Thank you!!!
Trust in the Lord with all your heart and lean not on your own understanding; in all your ways submit to Him, and He will make your paths straight. Proverbs 3: 5-6
TABLE OF CONTENTS
ACKNOWLEDGEMENTS ... iv
LIST OF TABLES ... viii
LIST OF FIGURES ... ix
I CHAPTER 1: INTRODUCTION ... 1
II CHAPTER 2: INDUSTRY CONTEXT ... 3
II.1 The Eighth Largest Economy ... 3
II.2 Industrial Sector Dominated by Small Companies ... 4
II.3 Manufacturing Multiplier Effect ... 5
II.4 U.S. Manufactured Products in the U.S. Economy ... 6
II.5 Improves Living Standards ... 7
II.6 Industry Pays Higher Average Compensation... 8
II.7 Employment Manufacturing ... 9
II.8 Industry Supports Millions Outside of Sector ... 10
II.9 Industry Context Summary ... 11
III CHAPTER 3: LITERATURE REVIEW ... 12
III.1 Transactional & Transformational Leadership ... 12
III.2 The Manufacturing Setting ... 20
IV CHAPTER 4: METHODOLOGY ... 23
IV.1 Multifactor Leadership Questionnaire ... 23
IV.2 Instrumentation ... 23
IV.3 Validity of the Multifactor Leadership Questionnaire... 26
V.1 Samples ... 27
V.2 Data Collection & Analysis ... 27
V.3 Results ... 29
V.3.1 Manufacturer’s MLQ Scores ...29
V.3.2 Summary of MLQ Scores and Profile ...34
V.3.3 Pearson Correlation & Fixed Effect Regressions ...35
V.3.4 Multiple Linear Regressions ...38
V.3.5 Descriptive Statistics & Normative U. S. Sample ...45
VI CHAPTER 6: DISCUSSION OF FINDINGS, CONTRIBUTIONS, LIMITATIONS & FUTURE RESEARCH ... 48
VI.1 Discussion of Findings ... 48
VI.2 Contributions ... 49
VI.3 Limitations & Future Research ... 49
VII CHAPTER 7: PERSONAL REFLECTION OF 20 YEARS ... 51
VII.1 Organization Transformation ... 51
VII.2 Leadership Transformation ... 53
VII.3 Closing Thoughts and Recommendations for Practitioners ... 54
REFERENCES ... 56
APPENDIX ... 62
Multifactor Leadership Questionnaire Samples ... 62
Participant Consent Form - Copy ... 66
LIST OF TABLES
Table 1 Research Design ... 2
Table 2 Manufacturing firms by # of employees and percentage of total firms ... 5
Table 3 Leadership Scales and Outcome Variables (Yammarino, F. J. & Bass, B. M. (1990) ... 15
Table 4 Descriptive statistics (Yammarino, F. J. & Bass, B. M. (1990) ... 16
Table 5 Leadership Scales (Avolio et al. 1988) ... 17
Table 6 Descriptive Statistic (Avolio et al. 1988) ... 18
Table 7 Constructs, Factors, and Scales of the MLQ5x ... 24
Table 8 Leadership Factor Definitions ... 25
Table 9 Participants Organizational Structure, Size, & Characteristics ... 27
Table 10 MLQ scores of Manufacturer # 1 ... 30
Table 11 MLQ scores of Manufacturer # 2 ... 32
Table 12 MLQ scores of Manufacturer # 3 ... 34
Table 13 Fixed Effect Regression Predicting Extra Effort ... 36
Table 14 Fixed Effect Regression Predicting Effectiveness ... 37
Table 15 Fixed Effect Regression Predicting Satisfaction ... 37
Table 16 Multiple Linear Regression Predicting Extra Effort ... 41
Table 17 Multiple Linear Regression Predicting Effectiveness ... 43
Table 18 Multiple Linear Regression Predicting Satisfaction ... 45
Table 19 One Sample T-tests Comparing Sample Means to Normative Means ... 46
LIST OF FIGURES
Figure 1 The Eighth Largest Economy: The U.S. Manufacturing Sector ... 4
Figure 2 Industrial Employment: Small Company Dominance ... 5
Figure 3 Multiplier Effect: Industrial Manufacturing ... 6
Figure 4 Goods Manufactured Domestically & Utilized In U.S. Economy ... 7
Figure 5 Improved Living Standards ... 8
Figure 6 Food & Beverage [Only] Leads Manufacturing in Terms of Employment . 9 Figure 7 Manufacturing Supports Millions of U.S. Jobs in Other Sectors ... 10
Figure 8 Manufacturing Workforce Becoming More Educated ... 22
Figure 9 Normal P-P Plot for Extra Effort ... 40
Figure 10 Scatterplot for Extra Effort ... 40
Figure 11 Normal P-P Plot for Effectiveness ... 42
Figure 12 Scatterplot for Effectiveness ... 42
Figure 13 Normal P-P Plot for Satisfaction ... 44
ABSTRACT
Leadership in Small U.S. Industrial Machining and Fabricating Companies
by
Christopher W. Gabers
June 1, 2016
Committee Chair: Conrad S. Ciccotello
Major Academic Unit: J. Mack Robinson College of Business
Given the continuous advances with globalization and overall competition, small
U.S. machining and fabrication companies (manufacturing) are required to constantly
maintain a competitive advantage to stay relevant (Avolio, 2004; Cascio 1995). To help
maintain that competitive advantage, leadership has been extensively researched for
many years within multiple segments of the U.S. economy; however, specific focus has
been neglected when it comes to transactional and transformational leadership styles
within small U.S. industrial machining and fabricating companies.
The focus of this research centers on three small industrial machining and
fabricating businesses in the manufacturing sector. Distributing the multifactor
leadership questionnaire (MLQ) this research investigates the leadership style of each
businesses leader. The MLQ specifically focuses on the leadership styles that the leaders
self-assess between transactional and transformational leadership and then leverage that
information when the employees provide a 360-loop feedback, which rates the leader.
The MLQ is the gold-star standard to evaluate transactional and transformational
leadership (Bass & Avolio, 2000; Avolio & Bass, 2004). The MLQ additionally provides
subordinates and leader, which this dissertation will focus on as well. Previous studies
provide a solid foundation on transactional and transformational leadership within
alternative environments other than small U.S. industrial machining and fabricating
companies, which is the focus of this dissertation.
This dissertation presents the findings that employees in an industrial environment
would exhibit higher levels of extra effort, effectiveness, and satisfaction, provided the
leader espouses more transformational leadership. Results revealed transformational
leadership was significantly related to extra effort, effectiveness, and satisfaction. To the
contrary, results revealed that transactional leadership was not significantly related to
extra effort, effectiveness, and satisfaction. Additional results substantiated the findings
listed above by conducting a Person correlation that showed transformational leadership
scores were positively related to transactional leadership scores. To substantiate the
study further results were compiled by conducting three fixed effect regressions
analyzing the independent variables of transactional and transformational leadership
I CHAPTER 1: INTRODUCTION
Paramount to any organization’s success is maintaining a level of leadership to
achieve business longevity while striving to maximize shareholder value. Earlier
research has advanced the knowledge that organizations with higher value-creating
individuals (Dutton 2003) will consistently outperform comparable firms, while other
studies have shown (Thakor 2000), that the individuals with the highest value-creating
ability are consequently the individuals with the “greatest energy and enthusiasm, and are
the happiest at work” (Cameron et al, 2006). Leadership contributes to this creation and
cultivation of value-creating individuals by achieving the outcomes of extra effort,
effectiveness, and satisfaction.
In this research, two main theories are highlighted and a highly respected
leadership questionnaire is the method of studying these leadership styles that may be
beneficial within small U.S. industrial machining and fabricating companies. The
theories of transactional and transformational leadership (Burns 1978) are the focus in
this dissertation. The questionnaire survey instrument will be the MLQ (Bass & Avolio
1990).
This dissertation investigated the leadership styles within the context of an
industrial manufacturing environment. Three privately owned companies were analyzed
each falling within the industry of manufacturing and the standard industrial
classification of small machining and fabricating companies. The results will help
provide insight to the academic community as well provide a future understanding for
small U.S. industrial machining and fabricating business leaders on leadership styles and
This dissertation engaged in a research design summarized in Table 1 (Mathiassen
et al., 2012). Each of the elements stated in the design is reviewed and elaborated in
greater detail in the succeeding sections of this dissertation. The research investigated the
leadership styles of transactional or transformational within three industrial machining
and fabricating companies as well as the subordinates that are led each day to examine
which leadership style produces the outcomes of extra effort, effectiveness, and
satisfaction. The problem setting was the U.S. industrial machining and fabricating
environment, requiring continual focus on how to promote extra effort, effectiveness, and
satisfaction within the organization. The area of concern was leadership in small U.S.
industrial machining and fabricating companies. The research question was:
RQ: Which leadership style (transformational or transactional) is more beneficial
within small U.S. industrial machining and fabricating companies to achieve the
[image:17.612.84.526.434.693.2]outcomes of extra effort, effectiveness, and satisfaction?
Table 1 Research Design
P (Problem setting) Small U.S. industrial machining and fabricating companies ensuring extra effort, effectiveness, and satisfaction from subordinates.
A (Area of concern) Leadership in small U.S. industrial machining and fabricating companies
RQ (Research Question) Which leadership style (transformational or transactional) is more beneficial within small U.S. industrial machining and fabricating companies to achieve the outcomes of extra effort, effectiveness, and satisfaction?
F (Framework) Transactional & Transformational Leadership
M (Method) Quantitative
(Multifactor Leadership Questionnaire)
CA (Contribution to A) A: A quantitative analysis on leadership in small U.S. industrial machining and fabrication companies.
II CHAPTER 2: INDUSTRY CONTEXT
On February 12th, 2013 speaking to the American people during the State of the
Union address, President Barack Obama stated, “after shedding jobs for more than 10
years, our manufacturers have added about 500,000 jobs over the past three” (The White
House 2013). This statement was welcome news to many Americans that rely on a
strong domestic manufacturing economy. The Economic and Statistics Administration
(ESA) within the United States Department of Commerce stated in the annual executive
summary in 2012, “The role of the manufacturing sector in the U.S. economy is more
prominent than is suggested solely by its output or number of workers. It is a cornerstone
of innovation in our economy: manufacturing firms fund most domestic corporate
research and development, and the resulting innovations and productivity growth
improve our standard of living” (ESA 2012). The following information underscores the
importance of the research that this dissertation set out to investigate. Manufacturing is
still undeniably important to the well being of our nations macro and microeconomics
within the global markets. The leadership that is utilized within these
industrial-manufacturing companies is important because it helps protect and promote the
continuous success that our nation relies upon (Scarborough, 2001)
II.1 The Eighth Largest Economy
Measured through the lens of the gross domestic product (GDP), the United States
dominates the world in producing goods and services. Additionally, the manufacturing
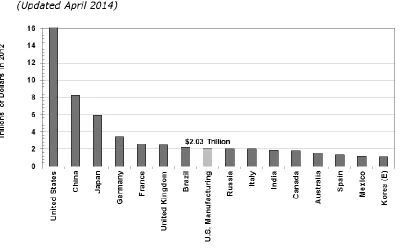
sector output has grown by over eighty-three percent between the years of 1992 to 2012,
trillion of value added in 2014 and representing the equivalence of the 8th largest
[image:19.612.105.509.174.426.2]economy in the world (The Manufacturing Institute, 2014).
Figure 1 The Eighth Largest Economy: The U.S. Manufacturing Sector
II.2 Industrial Sector Dominated by Small Companies
Updated in 2014 by the U.S. Census Bureau, the vast majority of employees are
found within organizations that have fewer than 20 employees. The three participating
firms for this research would be represented within that categorization. Figure 3 and
table 2 represents the overall importance of small manufacturing firms within the U.S.
economy. As the table states, over seventy-five percent of total firms are captured within
typically smaller in organizational size have a closer nit “family” environment in which
transformational leadership could thrive.
Figure 2 Industrial Employment: Small Company Dominance
Table 2 Manufacturing firms by # of employees and percentage of total firms
Number of Employees Number of Firms Percentage of Total Firms
0-4 107,256 42.07%
5-9 47,315 60.63%
10-19 38,587 75.77%
20-99 46,589 94.04%
100-499 11,670 98.62%
500+ 3,524 100.00%
II.3 Manufacturing Multiplier Effect
The multiplier effect is one of the most debated and argued economic data
statistics in government, however, it is one of the most important data points that an
economy can look towards to improve the overall economy. The American Heritage
New Dictionary of Cultural Literacy defines the multiplier effect as, “an effect in
consumption greater than the initial amount spent.” To this end, industrial manufacturing
shows to be an important aspect to the overall success to the American economy. The
manufacturing segment has the highest multiplier effect compared to any other sector.
Figure 3 Multiplier Effect: Industrial Manufacturing
II.4 U.S. Manufactured Products in the U.S. Economy
Industrial machining and fabricating companies are the building blocks of the
overall manufacturing economy. The products that are domestically produced are by far
more utilized throughout the U.S. economy compared to any other sector within the
economy. Figure 4 depicts the major percentage advantage that manufacturing goods
Figure 4 Goods Manufactured Domestically & Utilized In U.S. Economy
II.5 Improves Living Standards
Technological advancements are regularly praised for their achievements in
making our lives better, however, these technological shifts are additionally found within
the environment of industrial manufacturing companies. Manufacturing continues to
improve the living standards of all Americans as well as people around the globe.
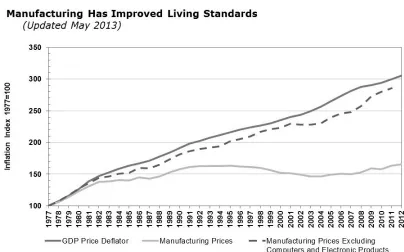
“Strong productivity gains, rapid advances in innovation, and international competition
have led to deflation in manufactured goods” (The Manufacturing Institute, 2014), which
in return provides individuals the power to buy more for less while not forgoing quality
of the product. Figure 5 shown below provides the optical importance on why
Domestic manufacturing allows for the upward economic mobility of individuals by
allowing them to participate in the global economy. This study provides the importance
of transformational leadership on helping continue to ensure that manufacturing remains
a vital option of American employment and in return a continuous increase in our living
[image:23.612.99.503.237.489.2]standard.
Figure 5 Improved Living Standards
II.6 Industry Pays Higher Average Compensation
Given the previous paragraph dealing with the manufacturing sector improving
individual standards of living it would only make sense that the data would show that the
earn higher wages and receive more generous benefits than other working Americans. In
December 2011, manufacturing employers paid $32.93 per hour in wages and benefits,
while all employers in the economy paid about $30.44 per hour”(The Manufacturing
Institute, 2014).
II.7 Employment Manufacturing
This dissertation focuses on companies that would be represented within a
standard industrial classification of manufacturing most commonly known as fabricating
and machining companies. These companies would be within the classification shown in
figure 7 as fabricated metal products. This subcategory is only surpassed by the food,
beverage, and tobacco products in relation to the number of individuals that are
employed. Additionally, these fabricating companies represent many of the small
[image:24.612.103.445.428.668.2]organizations that employ fewer than 20 employees.
II.8 Industry Supports Millions Outside of Sector
Just as important as the manufacturing sector employees millions of Americans,
the sector additionally supports millions of U.S. jobs that are not within the
manufacturing sector. “More than one in seven U.S. private sector jobs depends on the
U.S. manufacturing base”, and “manufacturing supported an estimated 17.5 million jobs
in the United States in 2011; this includes 12.0 million jobs directly within manufacturing
and 5.5 million jobs in sectors such as professional services (accounting, legal,
consulting, etc.), wholesaling, transportation, agriculture, and F.I.R.E. (finance,
[image:25.612.98.443.351.567.2]insurance, and real estate”(Manufacturing Institute, 2014).
II.9 Industry Context Summary
The previous information and data helps us understand that the industrial
manufacturing sector is a vital aspect for the U.S. economy. It is also relied upon by
millions of Americans for employment and quality of life. To this end, this dissertation
focuses on this sector given its overall importance to our way of life and focuses on the
leadership styles that leaders within this sector utilize with their subordinates. This
research will add to the leadership literature. It will also provide guidance for the
practitioner regarding how leadership in an industrial environment can impact employee
III CHAPTER 3: LITERATURE REVIEW
In this section, the two main leadership styles that are represented by the
Multifactor Leadership Questionnaire are reviewed. To better understand what the
questionnaire is, an overview of the leadership styles is presented as well as a review of
previous research studies. Many of the previous studies utilized the MLQ in alternative
sectors other than a U.S. industrial machining and fabricating environment which is the
focus of this dissertation.
III.1 Transactional & Transformational Leadership
Leadership experts agree that the type of leadership plays a role in employees’
extra effort, effectiveness, and satisfaction. Studies have shown that the leader with more
of a transformational leadership style “generate[s] higher commitment in their followers
(Avolio, 1999; Avolio & Yammarino, 2002; Bass, 1998); similarly, “Fuller, Patterson,
Hester, and Stinger (1996) reported in a meta-analysis greater follower compliance if
their leaders were more transformational then transactional” (Mind Garden, 2004).
James MacGregor Burns (1978) proposed the theory of transactional and
transformational leadership within the context of political science with the publication of
his groundbreaking book Leadership. Within it, Burns states the following: “Essentially
the leaders’ task is consciousness-raising on a wide plane…the leader’s fundamental act
is to induce people to be aware or conscious of what they feel – to feel their true needs so
strongly, to define their values so meaningfully, that they can be moved to purposeful
action.” Burns professed that leadership could successfully achieve organizational
change and accomplish goals while additionally creating a paradigm shift within the
Concurrent with the views of Burns, Bernard Bass (1990) viewed
transformational leadership as when an individual, “broaden[s] and elevate[s] the
interests of their employees, when they generate awareness and acceptance of the
purposes and the mission of the group, and when they stir their employees to look beyond
their own self-interest for the good of the group.”
Transactional Leadership is more quid pro quo, when the leader expects a particular outcome and this outcome only assures reward and praise. Burns expounded
upon this form of leadership by stating, “[transactional] leadership is the reciprocal
process of mobilizing, by persons with certain motives and values, various economic,
political, and other resources, in a context of competition and conflict, in order to realize
goals independently or mutually held by leaders and followers. The nature of those goals
is crucial. They could be separated but related; that is, two persons may exchange goods
or services or other things in order to realize independent objectives.” Transactional
leadership is the more antiquated and the lesser used leadership style of the two but it is
still necessary in specific circumstances. “In a historical sense, it is grounded solidly in
the era of industrialization and modernism, and, in this way, it highlights leadership’s
past” (Zacko-Smith 2010). Burns believed that the leader that exuded a transactional
leadership style was unable to achieve aspirations of the individual(s) being led.
“Perhaps industrial leaders operate in a more structured setting and hence exhibit
categorically different leadership” (Sivanathan & Fekken 2002). Additionally, it has
been shown that “a manufacturing environment leans itself well to transactional
leadership” (Sandilands 2012), when the organization is large and
organization with fixed operations that must be performed in a specific manner each time,
such as a manufacturing company, will benefit from transactional leadership style”
(Sandilands 2012), whereas, “previous data indicate that transformational leaders also use
active transactional-style leadership to achieve their objectives” (Avolio et al. 1998).
Multiple research studies on transformational and transactional leadership styles
have been performed throughout the past 30 years. Yammarino and Bass (1990)
conducted a research on the “conceptual classification of transformational leadership
(Lowe et al. 1996), in which the dependent variables were extra effort, effectiveness, and
satisfaction. This research was conducted within the context of a military environment at
the U.S. Naval Academy, where 186 officers and 793 subordinates participated in the
study. The overall focus of the study “was to evaluate empirically the nature of
leader-follower interactions as conceptualized here based on subordinates’ views of their
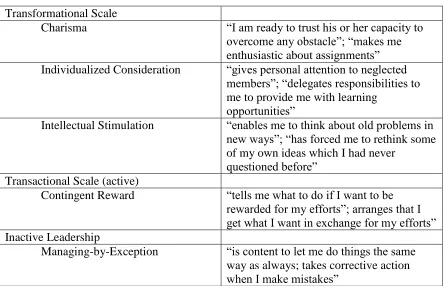
leaders” by utilizing the MLQ. Table 3 depicts the nine leadership scales created for their
Table 3 Leadership Scales and Outcome Variables (Yammarino, F. J. & Bass, B. M. (1990)
Transformational Leadership Scales
Charisma (six items) “I am ready to trust him or her to overcome any obstacle”
Individualized Consideration (six items) “Treats me as an individual rather than just a member of the group”
Intellectual Stimulation (six items) “Shows me how to think about problems in new ways”
Inspirational Leadership (six items) “Provides vision of what lies ahead”
Transactional Leadership Scales
Contingent Promises (three items) “Talks about special commendations and promotions for good work”
Contingent Rewards (three items) “Personally pays me a compliment when I do good work”
Active Management-by-Exception (four items)
“Would reprimand me if my work was below standard”
Passive Management-by-Exception (four items)
“Shows he/she is a firm believer in ‘if it isn’t broke, don’t fix it.”
Outcome Variables
Extra Effort “Four items were used to measure how
much extra effort subordinates were willing to put forth in their jobs. For example, “I do more than I expected to do in my work”. Items from this scale used the same
response format as the leadership items.”
Satisfaction “Two items were used to measure
subordinates’ satisfaction with their
leaders. For example, “In all, how satisfied were you that the methods of leadership used by this officer were the right ones for getting your unit’s job done?” Response alternatives were on a 5-point format ranging from “very dissatisfied” (0) to “very satisfied” (4)”
Effectiveness “Four items were used to measure the
The results of their study were similar to previous research that had been
“reported by Yammarino and Bass (1990) for the Naval War College sample and by Bass
and Avolio (1990) for other samples using the MLQ.” Table 4 showcases a portion of
[image:31.612.86.527.204.531.2]the research descriptive statistics.
Table 4 Descriptive statistics (Yammarino, F. J. & Bass, B. M. (1990)
Measures Mean (M) Standard Deviation
(SD)
MLQ Scale Range Transformational
Charisma 2.48 1.26 4.00
Individualized consideration
2.66 1.17 4.00
Intellectual stimulation
2.63 1.15 4.00
Inspirational leadership
2.45 1.15 4.00
Transactional Contingent promises
1.88 1.38 4.00
Contingent rewards
2.59 1.52 4.00
Active
management-by-exception
2.92 1.29 4.00
Passive
management-by-exception
2.47 1.10 4.00
Outcomes
Extra Effort 2.79 .99 4.00
Effectiveness 2.81 1.06 4.00
Satisfaction 3.01 1.59 4.00
Adapted from Yammarino, F. J. & Bass, B. M. (1990). Transformational leadership at multiple levels of analysis. Human Relations, 43, 975–995.
Bass (1985) conducted a prior research on the correlation of leadership styles
compared to the performance of satisfaction. This was additionally conducted within the
context of a military environment. Two years later, Bass joined research forces with
David Waldman and Walter Einstein to conduct a study (Waldman et al. 1987) that
had positively and significantly improved individual performance and associated with the
job satisfaction of subordinates”(Macit, 2003). Bruce Avolio with the additional support
of Waldman and Einstein conducted a game simulation (Avolio et al., 1988) with MBA
students on the potential effects of transformational leadership. The game was designed
to represent “a complex simulation that exposes students to opportunities and problems
typically confronting a medium-sized publically held manufacturing corporation”.
Similar to Yammarino & Bass (1990) the study utilized the MLQ as well as a leadership
scale that is depicted in Table 5. However, Yammarino & Bass’s study focused on the
outcome variables of Extra Effort, Satisfaction, and Effectiveness, whereas, Avolio
[image:32.612.85.532.366.652.2](1988) concentrated on the descriptive statistics rather than the outcomes of the MLQ.
Table 5 Leadership Scales (Avolio et al. 1988)
Transformational Scale
Charisma “I am ready to trust his or her capacity to overcome any obstacle”; “makes me enthusiastic about assignments” Individualized Consideration “gives personal attention to neglected
members”; “delegates responsibilities to me to provide me with learning
opportunities”
Intellectual Stimulation “enables me to think about old problems in new ways”; “has forced me to rethink some of my own ideas which I had never
questioned before” Transactional Scale (active)
Contingent Reward “tells me what to do if I want to be rewarded for my efforts”; arranges that I get what I want in exchange for my efforts” Inactive Leadership
Managing-by-Exception “is content to let me do things the same way as always; takes corrective action when I make mistakes”
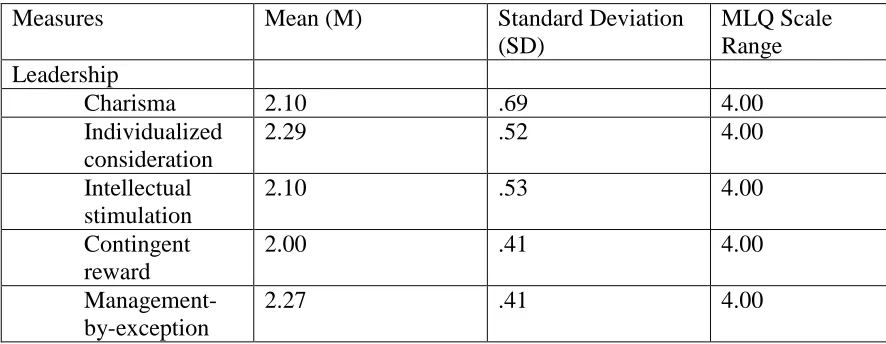
The results of the study demonstrated that “a moderately strong relationship was
found between the transformational and active transactional leadership shown by team
[image:33.612.84.527.177.349.2]leaders”. Table 6 depicts the descriptive statistics that the research produced.
Table 6 Descriptive Statistic (Avolio et al. 1988)
Measures Mean (M) Standard Deviation
(SD)
MLQ Scale Range Leadership
Charisma 2.10 .69 4.00
Individualized consideration
2.29 .52 4.00
Intellectual stimulation
2.10 .53 4.00
Contingent reward
2.00 .41 4.00
Management-by-exception
2.27 .41 4.00
Adapted from (Avolio et al. 1988) Transformational leadership in a management game simulation. Group & Organization Studies, 13(1), 59-80.
In 1992, research (Tucker et al.,) was conducted within the confines of an
academic setting to determine “whether transformational leadership accounts for more of
the variance” (Macit 2013) in the following areas:
Subordinates’ perceived satisfaction with their leaders
Subordinates’ perception of the leader effectiveness, and
Subordinates’ perception of their extra effort beyond that accounted for by
transactional leadership
Their findings showed that contingent reward “was associated with satisfaction,
effectiveness, and extra effort. However, such transactional leadership augmented by
transformational leadership, generated perceived increase of satisfaction, effectiveness,
William L. Koh, Richard M. Steers, and James R. Terborg conducted a research
(Koh et al., 1995) study in Singapore regarding the context of transformational and
transactional leadership and how these leadership styles affected teacher satisfaction.
The study examined the following attributes:
“The influence of transformational leader behavior by school principals as it
related to organizational commitment”
“Organizational citizenship behavior”
“Teacher satisfaction with leader”
“Student academic performance”
The study found that transformational leadership “had significant add-on effects to
transactional leadership in the prediction of organizational commitment, organizational
citizenship behavior, and teacher satisfaction”.
An additional study (Sillins, 1994) compared the causes and effects of
transformational leadership and transactional leadership within the context of schools
located in Canada. Within their research it was found that “transformational leadership
accounted for a significant incremental effect above that of transactional leadership in
bringing about enhanced school, teacher, program and instruction, and student
outcomes”.
Further studies were conducted within the healthcare system (Taylor and Klafehn
(1995), Avolio et al., (1995), Medley and Larochelle (1995), and Bycio et al., (1995),
specifically nurse executives and staff nurses, indicating that utilizing more of the traits
had a “positive and significant relation with transformational leadership behaviors and
contingent reward leadership behavior” (Macit 2013).
Flin & Yule (2004) found that, “the organizational structure and cultures typical
of industrial workplaces do not match those of healthcare organizations”. They
continued by stating that, “in an industrial setting there are, of course, both formal and
informal leaders. But on a power plant, if one asks a team or a department “who is the
leader?”, an unequivocal response is normally given. In a hospital, the formal leadership
hierarchy is less well defined”.
Religious leadership research (Bass 1990) showed that ministers that exude
transformational leadership translated into the church experiencing higher membership as
well as attendance. Complementary to the previous studies, research (Aminuddin 1998)
depicts that job satisfaction among associates and subordinates increased due to
transformational behavioral leadership within the context of academia.
Transformational leadership has been researched and defined as being a beneficial
leadership style throughout the years. It has been substantiated multiple times within
scholarly journals (Lowe et at. 1996). This dissertation sought to research whether
transformational or transactional leadership validated the previous studies that
demonstrated that transformational leadership promotes the outcomes of employee extra
effort, effectiveness, and satisfaction, within the environment of an industrial
manufacturing setting.
III.2 The Manufacturing Setting
As previously stated, multiple environments and settings have been studied
academics, and religious leaders, while leaving an opportunity for research in an
industrial manufacturing setting.
The manufacturing environment has evolved over the past few years due to
multiple technological and engineering advancements. To this end, the educational
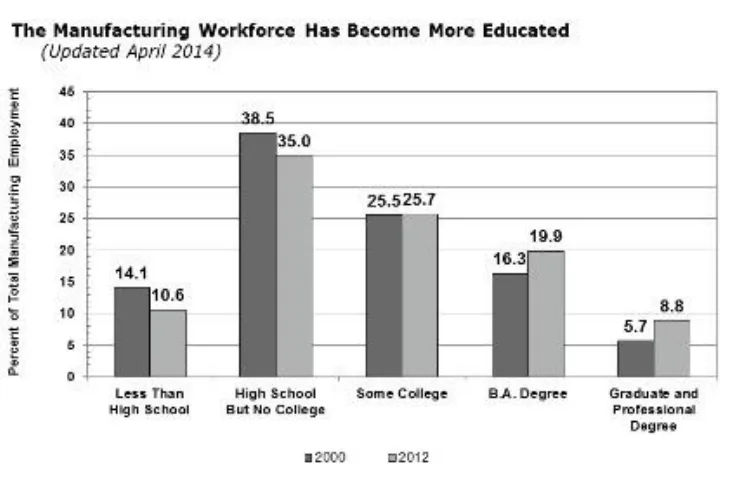
landscape of the manufacturing environment has evolved as well. Figure 8 presents the
trend of how the manufacturing industry is becoming more educated, however,
continuous progress must continue to advance. On September 1, 2016 the president of
The National Association of Manufacturers (NAM) stated, “manufacturers are dealing
with the most dramatic workforce crisis in U.S. history. Eighty percent of manufactures
report shortages of qualified workers. While manufacturing provides good,
family-supporting jobs with the highest average salary among all business sectors, young people,
their parents and teachers don’t know about manufacturing’s promising career
opportunities. The education and business communities must work more closely together
to align educational programs with the academic and occupational skills necessary for
Figure 8 Manufacturing Workforce Becoming More Educated
Given the importance to this industry setting and the rising levels of education it
would be wise to know how the leaders of tomorrow’s manufacturing workforce can
IV CHAPTER 4: METHODOLOGY
Previous studies have shown the rigor and importance of the MLQ by measuring
the dependent variables (outcomes) of employee extra effort, effectiveness, and
satisfaction. This dissertation adds to the important body of research that has been
previously done and suggests there is room for additional research. As the previous
section made clear, multiple studies have been conducted within alternative environments
while an U.S. industrial environment could benefit with additional research and focus,
which was the goal of this dissertation.
IV.1 Multifactor Leadership Questionnaire
The Multifactor Leadership Questionnaire (MLQ) has been the standard
framework to measure leadership styles for nearly thirty years. Yukl (1994) stated,
“Most of the research…has involved the use of a questionnaire called the Multifactor
Leadership Questionnaire to measure various aspects of transformational and
transactional leadership.”
IV.2 Instrumentation
Each item on the MLQ is answered using a 5-point Likert scale with anchor
points of “Not at all” and “Frequently, if not always.” The MLQ5x consist of 45 items,
36 of which produce information dealing with nine leadership factors and three outcomes
dealing with leadership. Three leadership outcome effects are derived from the
remaining 9 items. This study did not use the non-leadership items classified as
Lasissez-faire due to the focus of this study being between transformational leadership and
transactional leadership as well as emphasizing the results of the leadership outcomes of
Table 7 depicts the MLQ leadership constructs (Weinberger, 2004; Avolio, Bass, & Jung,
1995; Bass & Avolio, 2000).
Table 7 Constructs, Factors, and Scales of the MLQ5x
Leadership Construct Leadership Factor Scale (Number of items / Scale)
Transactional Leadership Contingent Reward
Management-by Exception
Contingent Reward (4) Management-by Exception (Active) (4) Management-by-Exception (Passive)(4) Transformational Leadership Intellectual Stimulation Individualized Consideration Charisma Inspirational Motivation
Intellectual Stimulation (4) Individualized Consideration (4) Idealized Influence (Behavior) (4) Idealized Influence (Attributed) (4)
Inspirational Motivation (4) Leadership Outcomes Satisfaction
Extra Effort Effectiveness
Satisfaction (2) Extra Effort (3) Effectiveness (4) Adapted from (Weinberger, 2004; Avolio, Bass, & Jung, 1995; Bass & Avolio, 2000).
To better understand the constructs, factors and scales of the MLQ, Table 8 provides the leadership factors and the corresponding leadership behavior by outlining
[image:39.612.82.529.151.402.2]Table 8 Leadership Factor Definitions
Leadership Factor Leadership Behavior
Contingent Reward The leader gives followers a clear understanding of what needs to be done and/or what is expected of them, then arranges to exchange rewards in the form of praise, pay increase, bonuses, and commendations.
Management-by-Exception (Active & Passive)
When it is active, the leader monitors the followers’ performance and takes
corrective action when mistakes or failures are detected. When it is passive, the leader intervenes only if standards are not met or if something goes wrong.
Idealized Influence (Attributed)
The leader has the followers’ respect, faith, and trust. The followers want to identify with the leader. The leader shows determination and conviction. Idealized Influence
(Behavior)
The leader shared a vision and sense of mission with the followers. Radical, innovative solutions to critical problems are proposed for handling followers’ problems.
Inspirational Motivation The leader increases the optimism and enthusiasm of followers. The leader
communicates with fluency and confidence using simple language and appealing symbols and metaphors.
Intellectual Stimulation The leader encourages new ways of looking at old methods and problems. The leader emphasizes the use of intelligence and creativity. The leader provokes rethinking and reexamination of assumptions on which possibilities, capabilities, and strategies are based. Individualized Consideration The leader gives personal attention to
followers and makes each feel valued and important. The leader coaches and advises each follower for the followers’ personal development.
IV.3 Validity of the Multifactor Leadership Questionnaire
As previously mentioned the MLQ is one of the most widely used instruments to
gauge the transactional or transformational leadership style of leaders while achieving the
dependent variable outcomes of extra effort, effectiveness, and satisfaction of the
individual being led. However, the validity of this survey is not based on its expansive
use alone.
MLQ validity was significantly substantiated by Antonakis et al. (2003). The
study tested two massive samples of size 3368 (N=3368) and 6525 (N=6525). Multiple
studies show (Antonakis et al., 2003) “the predictive validity of the theory has been the
focus of dozens of studies” (Avolio, 1999; Bass 1998). Studies include, “four
meta-analyses (DeGroot, Kiker, & Cross, 2000; Dumdum, Lowe, & Avolio, 2002; Gasper,
1992; Lowe et al., 1996) that have provided substantial support for the predicted
relationships using both subjective and objective measures of performance. To our
knowledge, there has been little or no controversy surrounding the predictive nature of
the theory.” Given the validity utilizing the MLQ, this study built upon the previous
research by investigating leadership in small U.S. industrial machining and fabricating
V CHAPTER 5: SAMPLES, DATA COLLECTION, ANALYSIS & RESULTS
V.1 Samples
This dissertation utilized the data of three corporations all within the United States
and all categorized as small U.S. machining or fabrication companies within the
manufacturing sector. Each company was geographically located within the Southeast.
Each participating corporation’s employees completed the MLQ rater form evaluation
and the direct leader of the employees completed the leader form as well. Table 9 depicts
each of the company participants, description, location, and pertinent information as well
[image:42.612.84.546.343.469.2]as each company’s specific industrial environment that they represent.
Table 9 Participants Organizational Structure, Size, & Characteristics
Company Name Description of Operation Number of Potential Raters Number of Leader(s) Location of Operation Location of Customer Base
Manufacturer #1 High Tech
Machining Company
2 1 Southeast Continental U.S.
Manufacturer #2 Precision Machining Company
8 1 Southeast Continental U.S.
Manufacturer #3 Custom Machining and Fabrication Company
9 1 Southeast Continental U.S.
V.2 Data Collection & Analysis
Data analysis focused on the distribution, implementation, results and analysis of
the MLQ. Focus was also on the individual MLQ results of each company by reviewing
and analyzing the scores of each organization compared to their corresponding leader.
Additionally, comparison to the MLQ Normative Samples supplied by Mind Garden is
reviewed. Mind Garden Inc. is the official organization that authorizes the use of the
Quantitative data from the MLQ was entered into SPSS 22.0 for statistical
analysis. The data was checked for accuracy, missing cases, and the presence of outliers.
The presence of outliers was examined by computing standardized values for each
dependent variable (i.e., extra effort, effectiveness, and satisfaction).
Descriptive statistics were computed and reported for each of the study variables.
Means and standard deviations were computed for continuous variables. Frequencies and
percentages were computed for categorical variables.
First, the manufacturers MLQ scores will be showcased and reviewed by
comparing the subordinates score to their direct leaders self-rated score. Additionally, a
percent deviation is provided to underscore the level of variation there was between the
leader and the subordinates. Second, a Pearson correlation is conducted to show the
relationship between transformational leadership and transactional leadership (see figure
1). A Pearson correlation analysis was selected because one of the aims of the study is to
assess the relationships between variables. When the researcher wants to determine the
strength and direction of the relationship between two variables, a Pearson correlation
analysis is appropriate. Third, three fixed effect regressions were completed to help
support and validate the forth and final results of the multiple linear regressions. Fixed
effect regression analysis and multiple linear regression analysis were selected because
the research involves assessing the predictive relationship between multiple independent
variables and a dependent variable. Specifically, fixed effect regression analysis is
appropriate when the researcher wants to examine the relationships between multiple
independent variables and a dependent variable while controlling for a categorical
relationships between transformational and transactional leadership scores and extra
effort, effectiveness, and satisfaction, while controlling for company. Then, multiple
linear regressions were conducted to assess the nature of these relationships regardless of
company.
V.3 Results
V.3.1 Manufacturer’s MLQ Scores
Manufacturer # 1
The organization was founded in 1995 and has continued to grow in size, sales,
and customer base since its inception. They provide solid carbide products and tools,
solid carbide blanks, and different levels of grinding services sold direct to the customer.
The organization currently has four full time employees while their high-tech production
equipment list continues to increase in volume as well as sophistication.
The organization was the smallest organization researched in terms of amount of
employees; however, the product that they produce is utilized by the most advanced
organizations in aerospace and medical equipment. Due to the customers that they
support the manufacturing environment is highly organized and clean. The
organization’s leader promotes an open door policy to each of the employees. If any of
the employees are having issues either personal or professional, the leader promotes that
they share and helps to find any possible solution. The environment on the floor is that of
individuals working on individual tasks but the sense of a collective team is present,
striving to accomplish the production requirements for their customers. Each of the
employees is highly trained and skilled to operate the required machines to produce the
leader answered. In Manufacturer #1 in almost very category the leader scored higher
than the employee’s both in transformational and transactional. In this aspect it would be
suggested that given the micro size of the organization that the leader views himself more
as a father figure rather than an employer. To this end, he views his leadership style
more as situational and utilizes both but at a more concentrated level than the employees
[image:45.612.86.527.261.717.2]concur.
Table 10 MLQ scores of Manufacturer # 1
Manufacturer # 1
Characteristic Scale Name Subordinate Scores Leader Score MLQ Scale % Deviation Transformational Idealized Attributes
or Idealized Influences (Attributes)
3.000 3.250 4.00 7.6%
(Leader Higher)
Transformational Idealized Behaviors or Idealized Influences (Behaviors)
2.125 3.000 4.00 29.17%
(Leader Higher)
Transformational Inspirational Motivation
3.250 3.500 4.00 7.14%
(Leader Higher) Transformational Intellectual
Stimulation
2.250 2.500 4.00 10.00%
(Leader Higher) Transformational Individual
Consideration
2.125 3.250 4.00 34.62%
(Leader Higher) Transactional Contingent Reward 2.000 2.500 4.00 20.00% (Leader Higher) Transactional Mgmt by
Exception (Active)
2.250 1.750 4.00 28.57%
(Leader Lower)
Outcomes Extra Effort 2.500 3.333 4.00 25.00%
(Leader Higher)
Outcomes Effectiveness 3.286 3.500 4.00 6.12%
(Leader Higher)
Outcomes Satisfaction 3.250 4.000 4.00 18.75%
Higher)
Manufacturer # 2
Production began in 2001 after the owner saw a need in this industry having had
previous experience since 1979. The organization provides precision milling, drilling,
welding, and fabrication. In 2012, the company achieved ISO 9001-2008 Quality
Control and was featured in Manufacturing News ™. The organization currently employs seven to nine full-time machinists.
This organization was the middle sized small company in relation to the
organizations that were studied. The organization focuses on high-tech machining of all
types of alloy steels, which requires skilled machinists to operate the organizations
machines. The environment within the organization is similar to a high-tech racecar
garage. The floors are all glossy epoxy and clean. All of the tools are neatly organized
and accounted for. Each of the team members have company issued uniforms that have
their name and company logo on each shirt. The leader provided the perception of more
of a hands-off leadership style and allowed for the team to make decisions about the daily
requirements to achieve the production goals. Table 11 presents the MLQ scores that the
Table 11 MLQ scores of Manufacturer # 2
Manufacturer # 2
Characteristic Scale Name Subordinate Scores Leader Score MLQ Scale % Deviation Transformational Idealized Attributes
or Idealized Influences (Attributes)
2.000 2.000 4.00 0.0%
(Same)
Transformational Idealized Behaviors or Idealized Influences (Behaviors)
1.906 3.250 4.00 41.35%
(Leader Higher)
Transformational Inspirational Motivation
1.844 2.750 4.00 32.95%
(Leader Higher) Transformational Intellectual
Stimulation
2.000 2.250 4.00 11.11%
(Leader Higher) Transformational Individual
Consideration
1.563 3.250 4.00 51.92%
(Leader Higher) Transactional Contingent Reward 2.063 3.500 4.00 41.07% (Leader Higher) Transactional Mgmt by
Exception (Active)
2.267 1.250 4.00 81.33%
(Leader Lower)
Outcomes Extra Effort 2.125 2.333 4.00 8.93%
(Leader Higher)
Outcomes Effectiveness 2.133 3.250 4.00 34.36%
(Leader Higher)
Outcomes Satisfaction 2.188 3.000 4.00 27.08%
(Leader Higher)
Manufacturer # 3
Fabrication and production started in 1975 and has since successfully progressed
into a second-generation company in 1990. The company provides state-of-the-art steel
approximately 22 total employees including both the manufacturing and the
administrative personnel.
This organization was the largest organization that participated in this study. The
manufacturing environment was more in line with a foundry or stamping company. The
concrete floors were clean but not epoxied. The environment was the most industrial of
the three organizations studied. There was the smell of welded steel along with a hazy
cloud of dust and smoke. All of the employees were quickly moving from one location
to another getting each task accomplished that was required. It resembled a human
version of an ant colony. The leader came and went from his office, helping his team on
the latest product that was required to be shipped. He embodied the personality of a
captain of a ship or the quarterback of a football team. Table 12 represents the MLQ
Table 12 MLQ scores of Manufacturer # 3
Manufacturer # 3
Characteristic Scale Name Subordinate Scores Leader Score MLQ Scale % Deviation Transformational Idealized Attributes
or Idealized Influences (Attributes)
2.778 2.500 4.00 11.11%
(Leader Lower)
Transformational Idealized Behaviors or Idealized Influences (Behaviors)
2.424 2.500 4.00 3.03%
(Leader Higher)
Transformational Inspirational Motivation
2.500 3.250 4.00 23.08%
(Leader Higher) Transformational Intellectual
Stimulation
2.333 3.000 4.00 22.22%
(Leader Higher) Transformational Individual
Consideration
2.486 3.750 4.00 33.71%
(Leader Higher) Transactional Contingent Reward 2.500 4.000 4.00 37.50% (Leader Higher) Transactional Mgmt by
Exception (Active)
2.361 2.250 4.00 4.94%
(Leader Lower)
Outcomes Extra Effort 2.481 2.667 4.00 6.94%
(Leader Higher)
Outcomes Effectiveness 3.028 3.750 4.00 19.26%
(Leader Higher)
Outcomes Satisfaction 3.500 3.500 4.00 0.00%
(Same)
V.3.2 Summary of MLQ Scores and Profile
The first manufacturer leader scored higher self-ratings on each characteristic
other than management by exception, which was the same outcome of manufacturer leader #2. However, in the case of manufacturer # 3, the leader scored lower in
idealized attributes. Overall, each of the leaders that participated in this research self-rated themselves as being more transformational than their subordinates substantiated.
V.3.3 Pearson Correlation & Fixed Effect Regressions
A Pearson correlation was conducted to determine the bivariate relationship
between transformational leadership scores and transactional leadership scores for the
employee sample. This analysis was conducted to assess the strength and direction of the
relationship between transformational leadership scores and transactional leadership
scores. The correlation coefficient was significant (r = .66, p = .005), indicating that transformational leadership scores were positively related to transactional leadership
scores.
Next, three fixed effect regressions were conducted to supplement the results of
the multiple linear regressions that will be shown in detail later in this chapter. These
fixed effect regressions are reported to demonstrate the relationships between
transformational and transactional leadership scores and extra effort, effectiveness, and
satisfaction, while controlling for company. In this analysis, the independent variables
were transactional and transformational leadership scores from the employee self-reports.
Additionally, company was included as a fixed effect in these regressions. Company was
entered as a dummy-coded variable with Company 1 serving as the reference group. The
dependent variables were employee extra effort, effectiveness, and satisfaction from the
employee self-reports. A separate regression was conducted for each dependent variable.
The results for the fixed effect regression model predicting extra effort were
significant (F(4, 11) = 7.45, p = .004, R2 = .73, n = 16), indicating that the set of
leadership) significantly predicted extra effort. The R2 value indicates that the independent variables accounted for 73% of the variability in extra effort.
Transformational leadership was significantly positively related to extra effort (B = 1.98,
t = 5.02, p < .001), meaning that as transformational leadership scores increased, extra effort also tended to increase. Transactional leadership was significantly negatively
related to extra effort (B = -0.86, t = -2.23, p = .048), meaning that as transactional leadership scores increased, extra effort tended to decrease. Table 13 displays the results
[image:51.612.86.529.316.419.2]of the regression predicting extra effort.
Table 13 Fixed Effect Regression Predicting Extra Effort
Independent Variable B Std. Error Beta t Sig.
Company 2* 1.10 0.59 0.56 1.86 .090
Company 3* 0.30 0.49 0.16 0.60 .559
Transformational 1.98 0.40 1.35 5.02 < .001
Transactional -0.86 0.39 -0.49 -2.23 .048
Note.F(4, 11) = 7.45, p = .004, R2 = .73. *Company 1 is the reference group.
The results for the fixed effect regression model predicting effectiveness were
significant (F(4, 9) = 7.86, p = .005, R2 = .78, n = 14), indicating that the set of
independent variables (i.e., the aggregate scores for transformational and transactional
leadership) significantly predicted effectiveness. The R2 value indicates that the independent variables accounted for 78% of the variability in effectiveness.
Transformational leadership was significantly positively related to effectiveness (B = 1.37, t = 3.51, p = .007), meaning that as transformational leadership scores increased, effectiveness also tended to increase. Transactional leadership was not significantly
leadership scores increased, effectiveness did not increase or decrease. Table 14 displays
[image:52.612.82.534.151.250.2]the results of the regression predicting effectiveness.
Table 14 Fixed Effect Regression Predicting Effectiveness
Independent Variable B Std. Error Beta t Sig.
Company 2* 0.00 0.73 0.00 -0.01 .996
Company 3* 0.33 0.59 0.18 0.55 .594
Transformational 1.37 0.39 0.95 3.51 .007
Transactional -0.44 0.36 -0.27 -1.23 .251
Note.F(4, 9) = 7.86, p = .005, R2 = .78. *Company 1 is the reference group.
The results for the fixed effect regression model predicting satisfaction were
significant (F(4, 11) = 5.42, p = .012, R2 = .66, n = 16), indicating that the set of
independent variables (i.e., the aggregate scores for transformational and transactional
leadership) significantly predicted satisfaction. The R2 value indicates that the independent variables accounted for 66% of the variability in satisfaction.
Transformational leadership was not significantly related to satisfaction (B = 1.01, t = 2.18, p = .052), meaning that as transformational leadership scores increased, satisfaction did not increase or decrease. Transactional leadership was not significantly related to
satisfaction (B = -0.33, t = -0.72, p = .487), meaning that as transactional leadership scores increased, satisfaction did not increase or decrease. Table 15 displays the results
of the regression predicting satisfaction.
Table 15 Fixed Effect Regression Predicting Satisfaction
Independent Variable B Std. Error Beta t Sig.
Company 2* -0.36 0.69 -0.18 -0.52 .613
Company 3* 0.41 0.58 0.20 0.71 .494
Transformational 1.01 0.46 0.65 2.18 .052
Transactional -0.33 0.45 -0.18 -0.72 .487
[image:52.612.86.531.602.699.2]V.3.4 Multiple Linear Regressions
Three multiple linear regressions were estimated. Multiple linear regressions are
an appropriate statistical analysis when the goal of the research is to assess the
relationship between a continuous dependent variable (outcome) and multiple
independent variables (predictors). Specifically, these multiple linear regressions were
conducted to demonstrate the relationships between transformational and transactional
leadership scores and extra effort, effectiveness, and satisfaction, regardless of company.
In this analysis, the independent variables were transactional and transformational
leadership scores. The dependent variables were employee extra effort, effectiveness,
and satisfaction. A separate regression was conducted for each dependent variable. The
standard method of multiple linear regressions was used, meaning that all independent
variables were entered into the model at the same time.
The assumptions of multiple linear regressions were tested. These assumptions
include normality, homoscedasticity, and absence of multicollinearity. The assumption
of normality was tested by examination of a normal P-P plot. The assumption of
homoscedasticity was tested by examination of a scatterplot. Finally, multicollinearity
was tested using Variance Inflation Factors (VIF). Stevens (2009) suggests that VIF
values greater than 10 indicate the presence of multicollinearity.
In this analysis, the independent variables were transactional and transformational
leadership scores from the employee self-reports. The dependent variables were
employee extra effort, effectiveness, and satisfaction from the employee self-reports. A
separate regression was conducted for each dependent variable. The standard method of
into the model at the same time. Each regression may be represented by the following
equation:
y = x0 + x1B1 + x2B2
In the above equation, y represents the dependent variable (i.e., extra effort,
effectiveness, or satisfaction), x0 represents the y-intercept, x1 represents transformational
leadership score, B1 represents the B coefficient for transformational leadership score, x2
represents transactional leadership score, and B2 represents the B coefficient for
transactional leadership score.
Prior to conducting the multiple linear regressions for extra effort, the
assumptions of normality, homoscedasticity, and absence of multicollinearity were tested.
The assumption of normality was tested by examination of a normal P-P plot (see Figure
9). The data did not strongly deviate from the normal line, so this assumption was met.
The assumption of homoscedasticity was tested by examination of a scatterplot (see
Figure 10). The data were equally distributed around zero, so this assumption was met.
Finally, multicollinearity was tested using Variance Inflation Factors (VIF). Stevens
(2009) suggests that VIF values greater than 10 indicate the presence of multicollinearity.
Figure 9 Normal P-P Plot for Extra Effort
[image:55.612.174.442.448.649.2]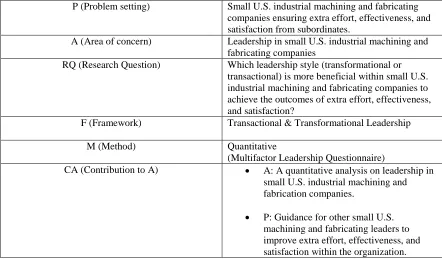

![Figure 6 Food & Beverage [Only] Leads Manufacturing in Terms of Employment](https://thumb-us.123doks.com/thumbv2/123dok_us/9107886.984216/24.612.103.445.428.668/figure-food-beverage-leads-manufacturing-terms-employment.webp)