International Journal of Emerging Technology and Advanced Engineering
Website: www.ijetae.com (ISSN 2250-2459,ISO 9001:2008 Certified Journal, Volume 3, Issue 10, October 2013)
581
The Performance Evaluation of the Breast Mass Classification
CAD System Based
on DWT, SNE AND SVM
S Mohan Kumar
1, Dr. G. Balakrishnan
21
Research Scholar, Karpagam University, Coimbatore, Tamil Nadu, India
2Director, Indra Ganesan College of Engineering, Trichy, Tamil Nadu, India Abstract- Mammogram is measured the most consistent
method for early detection of breast cancer. Computer-aided diagnosis system is also able to support radiologist to detect abnormalities earlier and more rapidly. In this paper the performance evaluation of the computer aided diagnostic system for the classification of mass classification in digital mammogram based on Discrete Wavelet Transform (DWT), Stochastic Neighbor Embedding (SNE) and the Support Vector Machine (SVM) is presented in this paper. This system classifies the mammogram images into normal or abnormal, and the abnormal severity into benign or malignant. Mammography Image Analysis society (MIAS) database is used to evaluate the proposed system. The average classification rate achieved is very satisfied.
Keywords-- Discrete Wavelet Transform, Stochastic Neighbor Embedding, Digital mammograms, Mass classification
I. INTRODUCTION
Breast cancer is the most extensive cancerous pathology among women. It is also an important public health problem in the world. As causes of its onset are still unknown, there are no efficient ways to avoid breast cancer. For this reason, an efficient diagnosis in its early stage can give women a better chance of full healing and survival. Therefore, early detection of breast cancer is the key for reducing the associated morbidity and death rates.
To study the human breast, Mammography is widely used as a diagnostic and a screening tool that uses X-rays. The objective of mammography is the premature revealing of breast cancer, usually through detection of characteristic microcalcifications and/or masses. Mammography is the only effective and viable technique to detect breast cancer in particular in the case of minimal tumors. Computer aided diagnosis system is also able to support radiologist to detect abnormalities earlier and faster. Mammography is believed to decrease mortality from breast cancer. This research work deals with classification of mass classification in digital mammograms based on Discrete Wavelet Transform (DWT) and Stochastic Neighborhood Embedding (SNE).
II. METHODOLOGY
The proposed system for the classification of microcalcification in digital mammograms is built based on DWT, SNE and by applying KNN and SVM for building the classifiers. In this following section the theoretical background of all the approaches are introduced.
A. Discrete Wavelet Transform
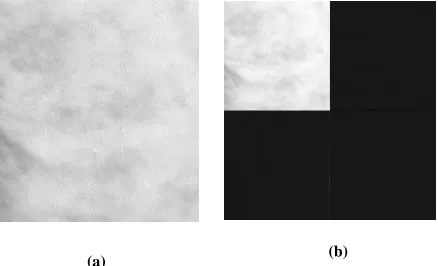
Nowadays, wavelets have been used quite frequently in image processing and used for feature extraction, denoising, compression, face recognition, and image super-resolution. The decomposition of images into different frequency ranges permits the isolation of the frequency components introduced by “intrinsic deformations” or “extrinsic factors” into certain sub-bands. This process results in isolating small changes in an image mainly in high frequency sub-band images.
[image:1.612.336.555.435.568.2](a) (b)
Figure 2.1: (a) Sample mammogram image (b) 2-D Wavelet decomposition
International Journal of Emerging Technology and Advanced Engineering
Website: www.ijetae.com (ISSN 2250-2459,ISO 9001:2008 Certified Journal, Volume 3, Issue 10, October 2013)
582
B. Stochastic Neighbor Embedding
SNE is a probabilistic approach to the task of placing objects, described by high-dimensional vectors or by pair-wise dissimilarities in a low-dimensional space in a way that preserves neighbor identities. A Gaussian is centered on each object in the high-dimensional space and the densities under this Gaussian (or the given dissimilarities) are used to define a probability distribution over all the potential neighbors of the object.
C. Support Vector Machine
Support vector machines (SVMs) are a set of related supervised learning methods that analyze data and recognize patterns, used for classification and regression analysis. The standard SVM is a non-probabilistic binary linear classifier, i.e. it predicts, for each given input, which of two possible classes the input is a member of. A classification task usually involves with training and testing data which consists of some data instances. Each instance in the training set contains one “target value” (class labels) and several “attributes” (features) . SVM has an extra advantage of automatic model selection in the sense that both the optimal number and locations of the basic functions are automatically obtained during training. The performance of SVM largely depends on the kernel.
In this research, two techniques for building a computer aided diagnostic system for the classification of microcalcification in digital mammograms based on DWT and SNE are presented. The SNE applied to wavelet transformed image and also applied on sub-bands of wavelet transformed image individually. SNE is essentially used for reducing high dimensionality data into relatively low dimensional data, efficiently. Then classifier system based on Support Vector Machine (SVM) is constructed and the same is compared with the results of the KNN Classifier. Experiments are conducted on Mammography Image Analysis society (MIAS) database.
This system classifies the mammogram images into normal or abnormal, and the abnormal severity into benign or malignant. The proposed methods are implemented in MATLAB and the performances of these methods are also analyzed productively. Finally, in order to serve the cancer patients with due diagnosis, the classification accuracy rate is sensibly derived from our proposed system.
III. EXPERIMENTAL RESULT AND DISCUSSION
In this section, many computer simulations are run based on the proposed classification system explained in chapter 2. To assess the performance of the proposed system, experiments with MIAS database images are performed. The performance of the proposed system is carried on 99 normal images and 25 microcalcification images. Among the 25 abnormal images, there are 12 benign and 13 malignant images available. All the images are considered for the classification test. The wavelet decomposition levels are varied from 2 to 6 and for each level the performance of the proposed techniques are evaluated.
The performance evaluation of the proposed mass classification system is carried on using MIAS database images. In this study, 99 normal mammograms are selected randomly for training and testing the classifier and all the mass images are considered for the performance study. The KNN and SVM classifiers are used to classify the normal image and also the abnormal severity into benign and malignant.
International Journal of Emerging Technology and Advanced Engineering
Website: www.ijetae.com (ISSN 2250-2459,ISO 9001:2008 Certified Journal, Volume 3, Issue 10, October 2013)
[image:3.612.205.407.135.285.2]583
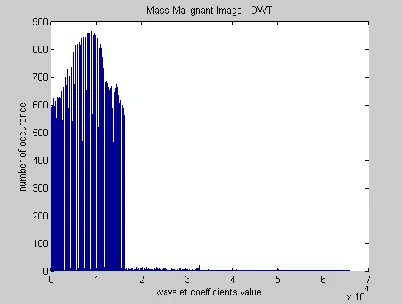
[image:3.612.207.410.310.463.2]Figure 3.1 Histogram plot of 2-level wavelet coefficients of a mass benign image
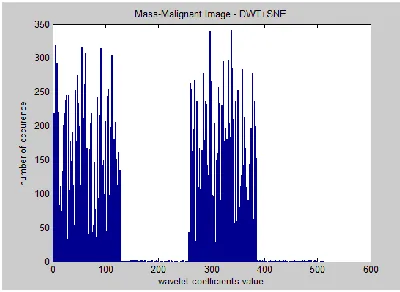
Figure 3.2 Histogram plot of reduced 2-level wavelet coefficients of a mass- benign image by SNE
[image:3.612.206.407.487.639.2]International Journal of Emerging Technology and Advanced Engineering
Website: www.ijetae.com (ISSN 2250-2459,ISO 9001:2008 Certified Journal, Volume 3, Issue 10, October 2013)
[image:4.612.205.405.134.280.2]584
Figure 3.4 Histogram plot of reduced 2-level wavelet coefficients of a mass- malignant image by SNE
The histogram plots shows the variation in the extracted features. Hence the SNE based reduced DWT coefficients are used in the proposed approach as features and fed into the classifier for further classification.
The number of samples used for training the SVM classifier and testing images for classification is given in Table I.
Table I.
Number of Training and Testing samples for microcalcification classification
Category No. of Training Set No. of testing Set
Normal 66 99
Abnormal 37 56
Masses(Benign) 25 37
Masses(Malignant) 13 19
To analyze the performance of the SNE, the proposed system is tested with the state of art technique Principal Component Analysis (PCA) using KNN classifier.
Initially the dimension of the feature is reduced for the wavelet transformed image. The classification accuracy obtained by the proposed system using KNN classifier for first stage and final stage are show in Table II and III.
Table II.
Classification accuracy of initial stage using KNN classifier based on wavelet
Level of decomposition
Wavelet + PCA + KNN
Wavelet + SNE + KNN Normal
(%)
Abnormal (%)
Normal (%)
Abnormal (%)
2 89.90 89.29 95.96 83.93
3 91.91 87.50 94.94 85.72
4 88.89 83.93 91.92 91.07
5 91.92 89.29 95.96 78.57
6 89.90 91.07 95.96 83.92
The initial stage classifier classifies the given unknown mammogram into normal or abnormal image. The above table shows the classification accuracy by varying the decomposition level from 2 to 6. The Bold values indicate the higher classification accuracy achieved by the proposed approach.
International Journal of Emerging Technology and Advanced Engineering
Website: www.ijetae.com (ISSN 2250-2459,ISO 9001:2008 Certified Journal, Volume 3, Issue 10, October 2013)
585
Table III.Classification accuracy of final stage using KNN classifier based on wavelet
Level of decomposition
Wavelet + PCA + KNN
Wavelet + SNE + KNN Benign
(%)
Malignant (%)
Benign (%)
Malignant (%)
2 94.60 78.95 100 68.43
3 83.78 73.68 97.30 78.95
4 91.89 68.42 100 78.95
5 91.89 68.42 97.30 78.95
6 91.89 73.68 100 78.95
It is concluded from the output of the final stage classifier using KNN classifier; the benign cases are classified with no error. However, performance against malignant cases needs to be improved.
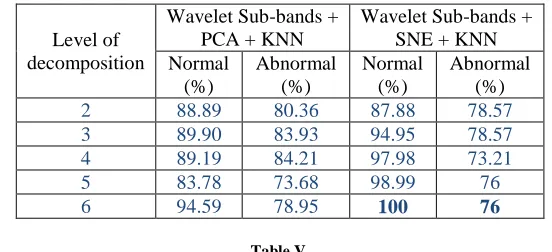
[image:5.612.166.442.367.493.2]To improve the accuracy, the proposed approach is tested by applying the SNE and PCA to all the wavelet sub-bands separately. Table IV. and Table V. show the classification accuracy of the proposed system for first and final stage respectively using wavelet sub-bands reduction.
Table IV.
Classification accuracy of initial stage using KNN classifier based on wavelet sub-bands
Level of decomposition
Wavelet Sub-bands + PCA + KNN
Wavelet Sub-bands + SNE + KNN Normal
(%)
Abnormal (%)
Normal (%)
Abnormal (%)
2 88.89 80.36 87.88 78.57
3 89.90 83.93 94.95 78.57
4 89.19 84.21 97.98 73.21
5 83.78 73.68 98.99 76
6 94.59 78.95 100 76
Table V.
Classification accuracy of final stage using KNN classifier based on wavelet sub-bands
Level of decomposition
Wavelet Sub-bands + PCA + KNN
Wavelet Sub-bands + SNE + KNN Benign
(%)
Malignant (%)
Benign (%)
Malignant (%)
2 86.49 73.68 91.89 84.21
3 100 78.95 97.30 89.47
4 92.93 85.71 91.89 84.21
5 95.96 80 91.89 94.74
6 93.94 76 89.19 94.74
The variation in the average classification accuracy of initial stage is not much more while using the PCA or SNE in the wavelet decomposed image as well as the wavelet bands. However, dimension reduction in wavelet sub-bands produces higher average classification accuracy of 91.67% in the final stage classifier.
International Journal of Emerging Technology and Advanced Engineering
Website: www.ijetae.com (ISSN 2250-2459,ISO 9001:2008 Certified Journal, Volume 3, Issue 10, October 2013)
586
Table VI.Classification accuracy of initial stage using SVM classifier based on wavelet
Level of decomposition
Wavelet + PCA + SVM
Wavelet + SNE + SVM Normal
(%)
Abnormal (%)
Normal (%)
Abnormal (%)
2 90.91 85.71 95.96 85.71
3 89.90 87.50 94.95 87.50
4 90.91 89.29 95.96 83.93
5 86.87 83.93 94.95 82.14
[image:6.612.172.442.159.290.2]6 90.91 85.71 97.30 89.47
Table VII.
Classification accuracy of final stage using SVM classifier based on wavelet
Level of decomposition
Wavelet + PCA + SVM
Wavelet + SNE + SVM Benign
(%)
Malignant (%)
Benign (%)
Malignant (%)
2 86.49 89.47 97.30 78.95
3 89.19 68.42 100 84.21
4 91.89 78.95 97.30 84.21
5 89.19 84.21 100 84.21
6 89.19 78.98 95.96 85.70
From the above two tables, 5.12 and 5.13, the maximum average classification accuracy of 93.39% and 92.10% is achieved by SNE at initial and final stage respectively.
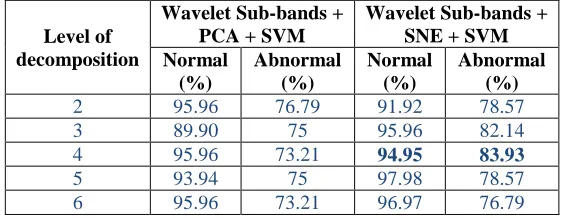
The classification accuracy of initial stage while using the SVM classifier is show from Table VIII. to Table IX.
Table VIII.
Classification accuracy of initial stage using SVM classifier based on wavelet sub-bands
Level of decomposition
Wavelet Sub-bands + PCA + SVM
Wavelet Sub-bands + SNE + SVM Normal
(%)
Abnormal (%)
Normal (%)
Abnormal (%)
2 95.96 76.79 91.92 78.57
3 89.90 75 95.96 82.14
4 95.96 73.21 94.95 83.93
5 93.94 75 97.98 78.57
6 95.96 73.21 96.97 76.79
From the Table 5.14, it is clearly observed that abnormal cases are classified correctly by SNE compared to PCA reduction technique. The SNE classified the abnormal images more than 10% than PCA reduction technique.
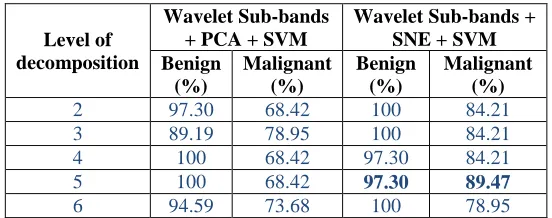
[image:6.612.165.449.487.596.2]International Journal of Emerging Technology and Advanced Engineering
Website: www.ijetae.com (ISSN 2250-2459,ISO 9001:2008 Certified Journal, Volume 3, Issue 10, October 2013)
[image:7.612.168.444.158.267.2]587
Table IX.Classification accuracy of final stage using SVM classifier based on wavelet sub-bands
Level of decomposition
Wavelet Sub-bands + PCA + SVM
Wavelet Sub-bands + SNE + SVM Benign
(%)
Malignant (%)
Benign (%)
Malignant (%)
2 97.30 68.42 100 84.21
3 89.19 78.95 100 84.21
4 100 68.42 97.30 84.21
5 100 68.42 97.30 89.47
6 94.59 73.68 100 78.95
From the tables VI. to IX, it is clearly found that the proposed SNE based method outperforms the PCA method in all aspect. As the decomposition level increases, the average classification accuracy increases for both the approaches.
IV. CONCLUSION
In this paper, two techniques for building a computer aided diagnostic system for the classification of mass classification in digital mammogram based on DWT are proposed. SNE is directly applied to wavelet transformed image in the first technique and the second technique is applied on sub-bands of wavelet transformed image. The high dimensional data from the mammogram image is relatively reduced into low dimensional data set by using the SNE. The reduced data set is used as features to classify the given mammogram images into normal or abnormal as well as benign or malignant. The proposed classification scheme is carried on MIAS database image. Experimental results show that . As the decomposition level increases, the average classification accuracy increases for both the approaches and also the classification rate of the proposed two techniques is satisfied.
REFERENCES
[1] Pelin Gorgel, Ahmet Sertbas, Niyazi Kilic, Osman N. Ucan and Onur Osman, “Mammographic Mass Classification Using Wavelet Based Support Vector Machine”, Journal of Electrical & Electronics Engineering, Vol. No 9(1), 2009, pp 867-875
[2] S. Baeg and N. Kehtarnavaz, “Texture Based Classification of Mass Abnormalities in Mammograms”, Proceedings of 13th IEEE Symposium on Computer-Based Medical Systems, 2000
[3] Yuan Chen and Chein I Chang, “New Texture Shape Feature Coding-Based Computer Aide Diagnostic Methods for Classification of Masses on Mammograms”, Proceedings of the 26th Annual International Conference of the IEEE, September 2004
[4] Maurice Samulski, Nico Karssemeijer, Peter Lucas and Perry Groot, “Classification of mammographic masses using support vector machines and Bayesian networks”, Proceedings of SPIE on Medical Imaging, 2007
[5] Matteo Masotti, “Exploring Rank lets Performances in Mammographic Mass Classification Using Recursive Feature Elimination”, Proceedings of the 16th IEEE Signal Processing Society Workshop on machine learning for signal processing, 2006 pp 265-269
[6] Mohammed J. Islam, Majid Ahmad and Maher A. Sid-Ahmed, “An Efficient Automatic Mass Classification Method in Digitized Mammograms Using Artificial Neural Network”, International Journal of Artificial Intelligence & Applications (IJAIA), Vol. No 1(3), July 2010
[7] Mohamed Meselhy Eltoukhy and Ibrahima Faye, “Curvelet Based Feature Extraction Method for Breast Cancer Diagnosis in Digital Mammogram”, IEEE International Conference on Intelligent and Advanced Systems, June 2010, pp 1-5.
[8] H.D. Cheng, X.J. Shi, R. Min, L.M. Hu, X.P. Cai, H.N. Du (2006) “Approaches for automated detection and classification of masses in mammograms”, Pattern Recognition, Vol. No 39, pp 646-668. [9] B. Sahiner, N. Petrick, H.P. Chan (2001) “Computer-aided
characterization of mammographic masses: accuracy of mass segmentation and its effects on characterization”, IEEE Transactions on Medical Imaging, Vol. No 20(12), pp 1275–1284
[10] J.L. Viton, M. Rasigni, G. Rasigni, A. Liebaria (1996) “Method for characterizing masses in digital mammograms”, Journal of Optical Engineering, Vol. No 35(12), pp 3453–3459
[11] G. Hinton and S. Roweis, “Stochastic neighbor embedding,” in Advances in Neural Information Processing Systems, vol. 15, MIT Press 2003, pp 833-840.
[12] J.S.Leena Jasmine,S.Baskaran,A Govardhan “ An automated Mass classification system in Digital Mammograms using Contourlet Transform and Support Vector Machine”, International Journal of Computer Applications, Vol No. 31 Issue No 9,October 2011. [13] Smola A. J., Scholkopf B., and Muller K. R., “The connection