An improved moth flame optimization
algorithm based on rough sets for tomato
diseases detection
Hassanien, AE, Gaber, T, Mokhtar, U and Hefny, H
http://dx.doi.org/10.1016/j.compag.2017.02.026
Title
An improved moth flame optimization algorithm based on rough sets for
tomato diseases detection
Authors
Hassanien, AE, Gaber, T, Mokhtar, U and Hefny, H
Type
Article
URL
This version is available at: http://usir.salford.ac.uk/id/eprint/52072/
Published Date
2017
USIR is a digital collection of the research output of the University of Salford. Where copyright
permits, full text material held in the repository is made freely available online and can be read,
downloaded and copied for noncommercial private study or research purposes. Please check the
manuscript for any further copyright restrictions.
An Improved Moth Flame Optimization Algorithm based
on Rough Sets for Tomato Diseases Detection
Aboul Ella Hassanienc,a, Tarek Gaberb,c,1,∗, Usama Mokhtarc,d, Hesham Hefnye
aFaculty of Computers and Information, Cairo University, Egypt bFaculty of Computers and Informatics, Suez Canal University, Ismailia, Egypt
cScientic Research Group in Egypt (SRGE), http://www.egyptscience.net dInst. of Stat. Studies and Res., Cairo University, Egypt
eInst. of Stat. Studies and Res.,Cairo University, Egypt
Abstract
Plant diseases is one of the major bottlenecks in agricultural production that
1
have bad eects on the economic of any country. Automatic detection of such
2
disease could minimize these eects. Features selection is a usual pre-processing
3
step used for automatic disease detection systems. It is an important process
4
for detecting and eliminating noisy, irrelevant, and redundant data. Thus, it
5
could lead to improve the detection performance. In this paper, an improved
6
moth-ame approach to automatically detect tomato diseases was proposed.
7
The moth-ame tness function depends on the rough sets dependency degree
8
and it takes into a consideration the number of selected features. The proposed
9
algorithm used both of the power of exploration of the moth ame and the
10
high performance of rough sets for the feature selection task to nd the set of
11
features maximizing the classication accuracy which was evaluated using the
12
support vector machine (SVM). The performance of the MFORSFS algorithm
13
was evaluated using many benchmark datasets taken from UCI machine learning
14
data repository and then compared with feature selection approaches based on
15
Particle Swarm Optimization (PSO) and Genetic Algorithms (GA) with rough
16
sets. The proposed algorithm was then used in a real-life problem, detecting
17
tomato diseases (Powdery mildew and early blight) where a real dataset of
18
tomato disease were manually built and a tomato disease detection approach
19
was proposed and evaluated using this dataset. The experimental results showed
20
∗Corresponding author
Email addresses: [email protected] ( Aboul Ella Hassanien), [email protected] (Tarek Gaber ), [email protected] (Usama Mokhtar), [email protected] (Hesham Hefny)
that the proposed algorithm was ecient in terms of Recall, Precision, Accuracy
21
and F-Score, as long as feature size reduction and execution time.
22
Keywords: moth ame optimization, rough set theory, particle swarm optimization (PSO) and genetic algorithms (GA), tomato's disease
1. Introduction
23
Plants are very crucial source of food and energy for humankind. Plant
24
diseases can cause major economical, and ecological losses as well as reduction
25
in both quantity and quality of agricultural products. Therefore, diagnosing and
26
detecting plant diseases in a timely an accurate way is very important. Usually,
27
the observation of experts using their naked eyes is the traditional approach
28
followed in practice for the diagnosing and detection of plant diseases. Moreover,
29
in some developing countries, small farmers could nd diculties to get experts
30
making consulting these experts very expensive and time consuming. This could
31
lead to the spreading of the disease into all crops. Thus,
automatic/computer-32
based plant diseased detection approaches are of high importance.
33
The automatic detection system usually consists of two main phases. Firstly,
34
the plant leaf image is captured using a digital camera. Secondly, the detection
35
and classication of leaf diseases can be achieved through dierent steps:
ex-36
tracting the infected region, computing some features representing each disease
37
and they classify these features to identify the diseases. The importance of
au-38
tomatic diagnosing and detection of plant diseases emerges as it could support
39
benets in monitoring big elds of crops, hence provide automatic detection of
40
diseases based on the symptoms which appear on the plant leaves (24).
41
In last years, automatic detection of plant diseases attracts many researchers
42
in dierent elds. Bauer et. al., (8), proposed an approach for the automatic
43
classication of leaf (i.e.,sugar beet) diseases using high resolution multi-spectral
44
and stereo images. In (36), Weizheng et al., introduced a new fast and accurate
45
approach for grading plant diseases using computer image processing technique.
46
They rst used Otsu method to extract the leaf region, and then used Sobel
operator to detect edges of the diseased spot. Finally, plant diseases are graded
48
through the information of the quotient of disease spot and leaf areas as
in-49
dicator. In another study (25), Naidu et al. suggested a method to identify
50
virus infected grapevine using the discriminant analysis and they obtained a
51
maximum accuracy of 81% of the classication results. Also, cotton diseases
52
(10) were automatically identied using preprocessing operation and the use
53
of SVM classier to identify visual symptoms of cotton diseases. Moreover, in
54
(20) a new method for wheat disease identication using image recognition was
55
proposed. In this method, after computing features of diseased region of leaf
56
images, samples are trained and recognized using the RBF-SVM classier. In
57
(29) to classify the leaf brown spot and the leaf blast diseases of rice plant, an
58
automated system has been developed. This system is based on the
morpho-59
logical changes of the plants caused by the diseases and used the Bayes and
60
SVM classiers in the disease identication. Also an approach to detect the
61
symptoms of nutrient diseases (4) was suggested and it is based on the vision
62
system and pattern recognition.
63 64
The feature selection process is one of the most important tasks for pattern
65
recognition and classication systems, e.g. plant disease detection system. The
66
main goal of this process is to nd a minimal feature subset from a problem
67
domain such that to give a high accuracy in representing the original features
68
(12). It improves the predictive accuracy of algorithms by reducing the number
69
of features, removing irrelevant, noisy and redundant features. It is also helps in
70
the improvement of the classication performance. The feature selection
mech-71
anism has been successfully employed to eectively solve classication problem
72
in various areas, such as bioinformatics (32), image processing (31), data mining
73
(22), pattern recognition (34), medical diagnosis (2;33).
74
Dierent techniques were used to achieve feature selection. This includes
75
the rough set theory (28) and bio-inspired techniques. The basic idea of using
76
rough set-based for feature selection is to generate all possible feature
reduc-77
tions and then choose the one with minimal cardinality (19). The rough set
has already used to accomplish a features selection task in dierent area such
79
as: (13; 38; 6). Also, many bio-inspired methods have been used for feature
80
selection process and thes include genetic algorithm (GA) (21; 27), ant colony
81
optimization (ACO) (7; 1), Bat Algorithm (BA) (26;30) and Grey Wolf
Opti-82
mizer (GWO) (14).
83
Eorts have been targeted to combine the RS approach with bio-inspired
84
algorithms to improve the performance. Bello et al. (9) proposed an feature
85
selection approach which integrates Ant Colony System with rough set. The
86
approach rstly generates a number of ants which are placed randomly on the
87
graph and then they traverse edges probabilistically until a traversal stopping
88
criterion is satised to output the best rough set reduct. This method achieved
89
a high ratio in features reduction but the classication accuracy and execution
90
time are not good enough. Similar to the Bello's approach (9), Wang et al., (35)
91
introduced an approach integrating between rough set and the particle swarm
92
optimization (PSO)to achieve the feature selection task. They followed the same
93
idea but only applied PSO instead of ACS. Wang's approach was able to nd the
94
optimal reducts on most of the used datasets and minimizing the execution time.
95
In another eort, Guo et al., (18) proposed an approach combining between
96
Genetic Algorithm, GA, and rough set for the feature selection. Firstly, rough
97
set was used to carry out the feature selection, then to nd the optimal subset
98
in the remaining feature subset, they used the GA improved with Population
99
Clustering. The SVM (Support Vector Machines) was then applied to evaluate
100
the eectiveness of the selected feature subset.
101
In this paper we proposed a Moth-Flame Optimization (MFO) and rough
102
set (MFORSFS) approach for automatically detecting some kinds of tomato
103
disease. The tomato was chosen to be the application of the automatic
dis-104
ease detection in this study because of its importance. It is ranked number one
105
among 40 vegetables/fruits in terms of "relative contribution to human
nutri-106
tion" and contains a high nutrition value. To achieve tomato disease detection,
107
feature selection is a important phase. Thus, we rst have introduced a new
108
feature selection technique based on MFO and Rough Set called MFORSFS.
This MFORSFS was evaluated to prove its robustness and then we have used in
110
the detection of the tomato diseases. The proposed MFORSFS algorithm was
111
compared against using (1) Particle Swarm Optimization (PSO) and (2) Genetic
112
Algorithm (GA) with the rough sets. The results showed that the MFORSFS
113
gave a higher accuracy of classication results while preserve low number of
114
features compared to the other two optimization algorithms.
115
The rest of this paper is organized as follows: Section 2 gives an overview
116
of the moth ame optimization and rough sets. Section 3 presents the details
117
of the proposed system. In Section 4, experimental results and discussion are
118
given. Finally in Section5, conclusions and future work are presented.
119
2. Preliminaries
120
2.1. Gabor Features
121
Gabor lter-base method is an eective method for extracting texture
fea-122
ture. It has been used in many applications such as biometrics and
segmen-123
tation. Gabor lters are known as convolution kernel, the product of a cosine
124
and Gaussian functions. It enjoys the characteristic of specied orientation and
125
spatial frequency. The 2-D Gabor lter is like a local band-pass lter with
126
some localization properties in the spatial and frequency domain. Gabor lter
127
is proved his eciency in characterizing texture features (17), like in our case:
128
extracting texture features from tomato's leaves.
129
A 2D Gabor functiong(x, y)is dened as follows:
130
g(x, y) = 1 2πσxσy
exp
−1
2 x2
σ2
x
+y
2 σ2
y
+ 2πjW x
(1)
where σx and σy characterize the spatial extent and frequency bandwidth
131
of the Gabor lter, andW represents the frequency of the lter. Let g(x, y)be
132
the mother generating function for the Gabor lter family. A set of dierent
133
Gabor functionsgm,n(x, y)can be generated by rotating and scalingg(x, y)to
134
form an almost complete and non-orthogonal basis set, that is,
135
Where x´ =a−m(xcosθn+ysinθn),y´=a−m(−xsinθn+ycosθn) , a > 1,
136
θn =nπ/K, m= 0,1, . . . , S−1, andn = 0,1, . . . , K−1. Parameter S is the
137
total number of scales, and parameterK is the total number of orientations.
138
So,S andKrepresents the total number of generated functions.
139
Given an imageI(x, y), its Gabor-ltered images are
140
Gm,n(x, y) =
X
x1
X
y1
I(x1, y1)gm,n(x−x1, y−y1)) (3)
2.2. Feature Selection Overview
141
In the past few decades, classication problems resolved using machine
learn-142
ing techniques usually contains high dimensional of data. Such high
dimension-143
ality lead to challenges such as the curse of dimensionality or a large number of
144
features. These challenges tends to overt problem which results in performance
145
degeneration. To address this problem, feature selection has been introduced.
146
The main purpose of feature selection is to determine a minimal feature subset
147
of a problem domain such that retaining a suitably high accuracy in representing
148
the original features (12).
149
According to using labeled or unlabeled training set, feature selection
tech-150
niques can be classied into unsupervised (10), supervised (? ), and
semi-151
supervised feature selection (? ). The supervised methods could be further
152
categorized into wrapper-based methods, lter-based methods, and
embedded-153
based methods. The wrapper-based methods, e.g., WLD (? ), makes use of
154
the predictive accuracy of a given learning algorithm to evaluate the quality of
155
selected features. The lter-based methods, e.g. (11) depend on using some
156
measures representing the general characteristics of given training data such as
157
consistency, distance, dependency, and correlation. The embedded-based
meth-158
ods are a combination between the lter-based and wrapper-based methods.
159
They rstly involve the statistical criteria, like the case of lter-based methods,
160
to select a number of candidate features subsets having a particular
cardinal-161
ity. The embedded-based methods then choose the subset having the highest
162
classication accuracy (? ).
2.3. Rough set basics
164
Rough set theory (37) is a mathematical approach to imprecision,
vague-165
ness and uncertainty. Rough Set Attribute Reduction (RSAR) (11) provides a
166
lter-based tool for extracting feature from a domain in a concise way whilst
167
reducing the amount of knowledge involved. To formalize the rough set,
con-168
siderI= (U,A)is an information system, whereUis a non-empty set of nite
169
objects (the universe) and A is a non-empty nite set of attributes such that
170
for∀a∈A determines a functionfa:U →Va. With any P ⊆A, there is an
171
associated equivalence relation IND(P):
172
IND(P)={(x, y)∈U ×U | ∀a∈P, fa(x) =fa(y)} (4)
The partition of U, generated byIND(P), is denoted U/P. The equivalence
173
classes of theP-indiscernibility relation are denoted [x]p. The indiscernibility
174
relation is the mathematical basis of rough set theory.
175
Let X ⊆U , theP-lower approximation PX and P-upper approximation
176
PX of set Xcan be dened as:
177
PX ={x∈U |[x]P ⊆X} (5)
178
PX ={x∈U |[x]P∩X 6=φ} (6)
Let P,Q ⊆A be equivalence relations overU, then the positive, negative
179
and boundary regions can be dened as:
180
POSP(Q) =
[
X∈U/Q
PX (7)
181
NEGP(Q) =U −
[
X∈U/Q
PX (8)
182
BNDP(Q) =
[
X∈U/Q
PX− [
X∈U/Q
PX (9)
The positive region of the partitionU/Qwith respect toP(POSP(Q)), is the
183
set of all objects ofUthat can be certainly classied into blocks of the partition.
184
An important issue in attribute reduction is discovering dependencies between
185
attributes. U/Qby means ofP
For P,Q ⊆ A, we say that Q depends on P in a degree k (0 ≤ K ≤ 1)
187
denoted P⇒k Q , if
188
k=γp(Q) =
|POSp(Q|)
|U| (10)
If k = 1,Q depends totally onP, if0 < k <1, Q depends partially (in a
189
degreek) onP, and ifk= 0thenQdoes not depend onP.
190
In a decision system, an attribute set includes two sets: decision attribute
191
set D and condition attribute set C, i.e. A=C⊂D. The degree of dependency
192
between these two sets,γC(D), which is known as the quality of approximation
193
of classication, is induced by the decision attributes set (37) .
194
When P is a set of condition attributes and Q is the decision, γp(Q) is
195
the quality of classication (37). The goal of attribute reduction is to remove
196
redundant attributes so that the reduced set provides the same quality of
clas-197
sication as the original. A reduct is dened as a subset Rof the conditional
198
attribute setCsuch that γR(D)=γC(D). The set of all reducts is dened as:
199
Red={R⊆C|γR(D) =γC(D),∀B⊆R, γB(D)6=γC(D)} (11)
In rough set attribute reduction, a reduct with minimal cardinality is the one
be-200
ing searched for. To locate a single element of the minimal reduct set Redmin ⊆
201
Red, the following equation is used :
202
Red =R∈Red|∀R0∈Red,|R| ≤ |R0 (12)
The intersection of all reducts is called the core, the elements of which are those
203
attributes that cannot be eliminated. The core is dened as:
204
Core(C) =∩Red (13)
205
2.4. Moth Flame Optimization
206
Moth-Flame Optimization (MFO) is a new optimization algorithm which
207
simulate the moths navigation manner in nature. The main inspiration of this
optimizer is the navigation method of moths in nature called transverse
orien-209
tation (23). It is a population-based evolutionary computation search technique
210
which mimics the behavior of moths in their special navigation methods at night.
211
The idea of the MFO is based on a mechanism called transverse orientation for
212
navigation in night throw the moon light. Using this mechanism, moth ies with
213
a xed angle with respect to the moon. When moths see a human-made
arti-214
cial light, they try to maintain a similar angle with the light to y in straight
215
line. Since such a light is extremely close compared to the moon, maintaining
216
a similar angle to the light source causes a useless or deadly spiral y path for
217
moths (15).
218
The mathematical model for the MFO is based on two components, moth
219
and ame. The moths are actual search for agents that move around the search
220
space, whereas ames are the best position of moths that obtains so far. As
221
mentioned above the inspiration of this algorithm is the transverse orientation.
222
In order to mathematically model this behaviour, the position of each moth is
223
updated with respect to a ame using the following equation:
224
Mi=S(Mi,Fj) (14)
where Mi indicates the i-th moth, Fj refers to the j-th ame, and S is the
225
spiral function. The logarithmic spiral for the MFO algorithm is defended as
226
follows:
227
S(Mi,Fj) =Di·ebt·cos(2πt) +Fj (15)
Where Di indicates the distance of the i-th moth for the j-th ame and is
228
as dened in16, b is a constant for dening the shape of the logarithmic spiral,
229
and t is a random number in [ -1, 1]. Dis calculated as follows:
230
Di=|Fj−Mi| (16)
WhereMi indicates the i-th moth, Fi denotes the j-th ame and Di refer to
231
the distance betweenMi andFi.
232
The t parameter in the spiral equation 15 controls the direction of moth
233
navigation around the ame. (t = -1 is the closest position to the ame, while t
= 1 shows the farthest) The spiral equation allows a moth to y around a ame
235
and not necessarily in the space between them. Therefore, the exploration and
236
exploitation of the search space can be guaranteed.
237
In order to further emphasize exploitation, t is dened as random number
238
in [r, 1] where r is linearly decreased from -1 to -2 over the course of iteration.
239
According to equation15,each moth is restricted to move towards a ame that
240
may lead to local optimum stagnation. In order to prevent this, at each iteration,
241
a list of ames must be updated and sorted based on their tness values. The
242
moths then update their positions with respect to their corresponding ames.
243
Since the position updating of moths with respect to n dierent locations in
244
the search space may degrade the exploitation of the best promising solutions,
245
an adaptive mechanism for the number of ames has been proposed as in the
246
following formula:
247
ame no=round
N −l∗ N −1
T
(17)
where l is the current number of iteration, N is the maximum number of
248
ames, and T indicates the maximum number of iterations.
249
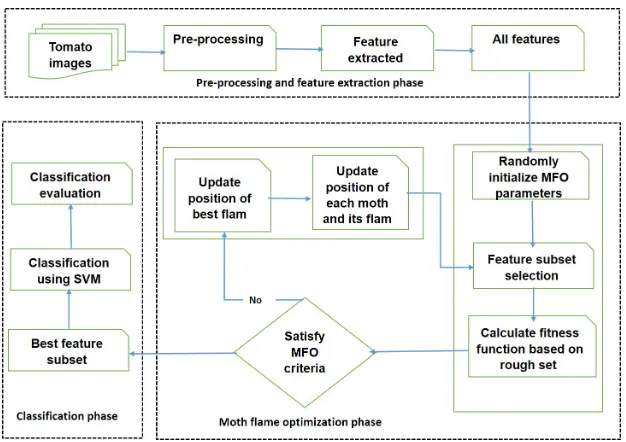
3. The proposed MFO-based rough set tomato diseases detection
ap-250
proach
251
The proposed MFO-based rough set tomato diseases detection approach is
252
comprised of ve fundamental phases: image acquisition, pre-processing,
fea-253
ture extraction, feature selection and nally classication. These phases are
254
described in details below. The overall architecture of the proposed system is
255
illustrated in Figure1.
256
3.1. Image acquisition phase
257
The rst phase of the proposed MFO-based rough tomato diseases detection
258
approach is the image acquisition phase. This phase plays an important role in
259
any image classication system. These images must select carefully to achieve
Figure 1: Layout structure of the proposed MFO-based rough set approach
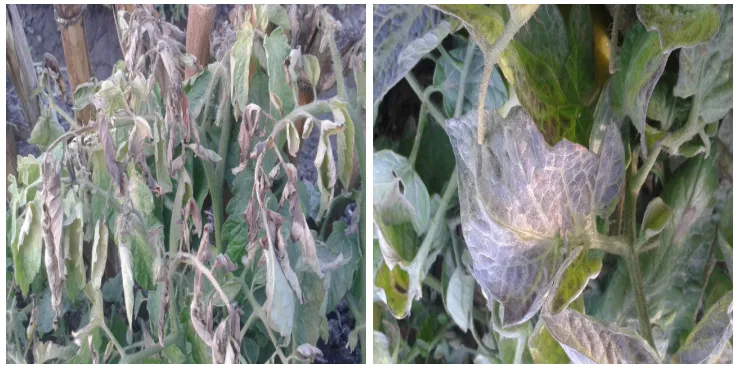
the intended task. The datasets used for experiments were constructed based on
261
real sample images of tomato leaves infected with two types of tomato diseases
262
including Powdery mildew and early blight. this dataset were collected from
dif-263
ferent farms using sonny digital camera with 14 MP resolution, at temperature
264
between 16 and 20 degree. Fig. 2illustrates some examples of these dataset.
265
3.2. Pre-processing Phase
266
In this phase, after collecting the dataset, the images were enhanced by
re-267
moving noise that caused by defects of camera ash or hight lights to increase
268
the eciency of classication and prediction process. Firstly, every leaf was
269
isolate and extract in single image. Secondly, captured images were resized to
270
512 x 512 resolution, thus minimizing the storage capacity and reduce the
com-271
putational time in the post-processing. Finally, the background of each image
272
was removed using background subtraction technique with some morphological
273
operations. Gaussian Mixture-based Background/Foreground Segmentation
Al-274
gorithm (39) was used to subtract the background and morphological techniques
Figure 2: Samples of infected tomato using in this work
(dilation followed by erosion) to remove noise.
276
3.3. Feature extraction phase
277
In this phase, Gabor transform was used to describe the textural pattern of
278
diseased tomato leaves. The total number of extracted features are 402. For
279
more details of this phase reader can refer to (24).Each of used Gabor lters
280
was implemented as a 8 x 8 convolution mask for each of its real and imaginary
281
components. The acquired images were converted to HSV color space and 6
282
components of the image (R,G,B,H,S,V) have been extracted. To construct
283
feature vector of each image components; a vector of 64 length was obtained
284
from the average output for everyithlter. Vector of 3 length consisted of: cost
285
function J(i), maximum average output Dmaxi and minimum average output
286
Di
min. At the end of this step feature vector of (64+3) x 6 = 402 length that
287
describe the image has been obtained.
288
3.4. Moth ame based features selection phase
289
As it was mentioned above, the output of the feature extraction phase is
290
402 features. Such large number of features usually contains irrelevant and
redundant features. To achieve the feature selection phase, the MFO algorithm
292
was employed through using both of rough set and SVM classier as a tness
293
function for the MFO to evaluate the best set of features helping achieving
294
the highest accuracy. The MFO algorithm was adopted in this paper for the
295
following reasons. Firstly, in the original paper introducing the MFO (23), it is
296
reported that the MFO algorithm has advantages on other related algorithms
297
such as PSO, GA, and GSA in the context of optimization problems. Secondly,
298
it is proved that MFO has the ability to solve real problem such as marine
299
propeller design (so it could be useful algorithm in our case too (the detection
300
of tomatoâs diseases). Thirdly, the MFO convergence is guaranteed since
301
the moths always have the habit of updating their positions according to ames
302
which are the most promising solutions.
303
The overall proposed MFO based rough set feature selection algorithm is
304
described in Algorithm1.
305
In the MOF-rough-set feature selection approach, the solution space
repre-306
sents all possible selections of features selection. Each moth position represents
307
binary selection of feature sets of length N , where N is the total number of
308
attributes. Every bit represents an attribute where the value `1' means that the
309
corresponding attribute is selected while `0' means it is not selected. Each
posi-310
tion is an attribute subset. The frequency of a position updating for each moth
311
is represented as a positive integer, varying between 1 and max-update. It
im-312
plies how many of the moth's bits (features) should be changed, at a particular
313
moment in time.
314
The maximum range of position updating serves is a constraint to control
315
the global exploration ability of a moth. After many tests, it was found that
316
an appropriate maximum of position updating of each moth value is (1/3)*N .
317
Also, this maximum range was proven to achieve good results as reported in
318
(35). Figure 1 illustrates the Layout structure of the proposed MFO-based
319
rough set approach.
320
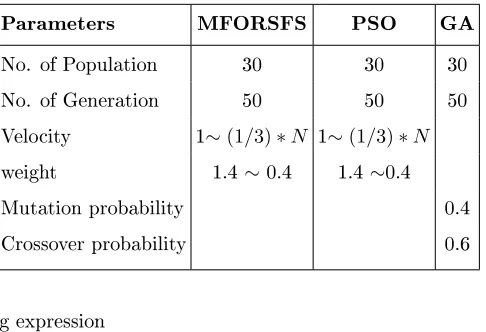
It is important to highlight the used parameters in the feature selection
321
approach, as given in Table1. The parameters in this table are selected based
Algorithm 1 MFO based rough set feature selection algorithm
1: Initialize MFO parameters 2: for (i=1 : No. of moth) do
3: Initialize the population of solutions by formula (18) 4: Evaluate the tness of each moth by formula (19) 5: end for
6: Sort the rst population of moths
7: Update the position of best ame obtained so far
8: while (Iter < MaxIter and GFlamFit < MaxFit) do
9: Update ame number by formula17
10: Sort moths according their tness values and assign the values of the
rst value (highest accuracy results)
11: Update ames positions according to the moth 12: Decrease the parameter a from -1 to -2
13: for (i=1 : No. of moth) do
14: Update position of each moth (feature set) restricted into the region
[1,N/3] by formula. 15
15: Update position of each ame with respected to the best moth
16: end for
17: Evaluate the tness of each moth by using the following formula: (19)
Rough−sets−f itness−f unction=α∗γR(D) +β∗
|C|−|R| |C|
18: iter = iter + 1; 19: end while
20: Produce the best ame position
on the ones in [PSO-Rough Set] where our method is very close to it and it is
323
also compared with our proposed method and below.
324
For the population initialization: The population initialization
mecha-325
nism was used in the proposed algorithm and in all PSO and GA based ones
326
using in the experimental evaluation, see Section 4. When population is
ran-327
domly initialized, a feature subset (solution) should be produced randomly by
Table 1: Parameters values used in experiments
Parameters MFORSFS PSO GA
No. of Population 30 30 30
No. of Generation 50 50 50
Velocity 1∼(1/3)∗N 1∼(1/3)∗N
weight 1.4∼0.4 1.4∼0.4
Mutation probability 0.4
Crossover probability 0.6
the following expression
329
Xij =
1 rand()>1
0 otherwise
(18)
Wherei∈ {1,2, ....P N}andj∈ {1,2, ...F N}, whereP N is population size and
330
F N is number of feature.
331
For the tness function: it was a measure to determine the goodness or
332
quality of a single solution in a population. At the end of each iteration, tness
333
value is calculated of each agent for evaluating quality search. In this paper,
334
classication accuracy was adopted as tness function and the Support vector
335
machine SVM classier was used to evaluate the performance of each solution.
336
The classication accuracy obtained was based on the average of the 10-fold
337
cross validation method. Since we must take into account two important issues,
338
the classication quality and feature subset length. So, the tness function is
339
calculated according to the following equation:
340
Rough−sets−f itness−f unction=
α
∗
γ
R(D) +β
∗
|C| − |R|
|C| (19)
Where
γ
R is the classication quality of condition attribute setR relative341
to decision D, |R| refer to the length of elected attribute subset. |C| is the
342
total number of features.
α
andβ
are two parameters corresponding to theimportance of classication quality and subset length,
α
∈[0,1] andβ
= 1−344
α
. We adopt this approach based on the work done in (35), they states that345
classication quality is more signicance than the size of subset, as a result both
346
parameters have been set as follow:
α
= 0.9,β
= 0.1.347
3.5. SVM-based classication phase
348
In the classication phase, the SVM was employed to assess whether features
349
selected using MFORSFS method can help in detecting infecting tomato leaves.
350
The inputs of this phase are trained feature vectors, whereas the outputs are the
351
decision of whether the tomatoâs leaf is infected or not and if it is infected,
352
it determines the type of disease (Powdery mildew and early blight). It is worth
353
to mention that the SVM was used in two dierent phases. In the feature
354
selection, it was used as a tness function to evaluate which set of features is
355
best to represent the leaf (infected or healthy). In the classication phase, the
356
SVM was also used to classify between the infected and healthy leaves.
357
To evaluate the performance of a classication system, the k-cross-validation,
358
a common method to deal with small training sets in machine learning (3), was
359
used. Cross-validation is a method to evaluate classier or predictive models.
360
In this method, the original sample is partitioned into two sets: a training set
361
to train a given model, and another test set to evaluate this model. The general
362
type of this method is k-fold cross-validation in which the original sample is
363
divided randomly intoksubsamples of equal size. From all theseksubsamples,
364
one subsample is used as the validation data to test the model while the
re-365
mainingk−1 subsamples are used as training data. The process of the k-fold
366
cross-validation is repeated k folds (times) where each k subsamples is used
367
as the validation data only one time. The main advantage of this validation
368
method is that all samples are used for both training and validation, and each
369
samples is used for validation exactly once.
4. Experimental Results and Discussion
371
To evaluate the proposed approach, two main scenarios were designed and
372
tested. The rst scenario was for the evaluation of the MFO-Rough-Set based
373
feature selection approach using benchmark datasets. Also, in this scenario, to
374
make the MOF+rough set feature selection approach comparable with related
375
work, PSO and GA were also combined with the rough sets to achieve the
fea-376
ture selection. The three proposed features selection algorithms (MOF+rough
377
set, PSO+rough sets, and GA+rough sets) were compared with each other to
378
select the best one to choose a suitable combination of features in wrapper
379
mode for maximizing classication performance and minimizing the data
di-380
mensionality. To make the results of the three algorithms are comparable, it
381
was important to unify bases for all adopted bio-inspired algorithms. Thus,
382
Population Initialization, Fitness Function are setup as described in Section3.4
383
and the other parameters given in1. All adopted bio-inspired algorithms were
384
initialized identically and the used tness function was the same.
385
In the second scenario, the performance of the overall MFO-rough-set based
386
tomato diseases detection approach was investigated. Three sub-scenarios were
387
also designed here. Firstly, a simple classier, KNN, was used a tness function
388
of MFO and its results were compared to the SVM-based ones. Secondly, a
tra-389
ditional feature selection, i.e., mRMR, was used to select the best features and
390
the classication results were reported and compared with our proposed method.
391
Thirdly, three features selection algorithms (MOF+rough set, PSO+rough sets,
392
and GA+rough sets) were applied in the feature selection phase to choose the
393
best one. All algorithms were implemented using MatLab R2014b and all
exper-394
iments were run under a computer with Intel(R) Core (TM) i7 CPU [email protected]
395
GHZ and 8 GB memory and the system is Windows 8 Professional.
396
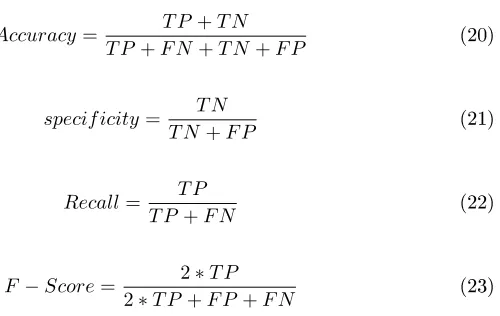
To evaluate the results in both the mentioned scenarios, several
measure-397
ments were used. These measurements are Accuracy, specicity, Recall and
398
F-Score. They are dened mathematically at Equations (20), (21),(22) and
399
(23) respectively (16). Using multi-level confusion matrix, each measure were
calculated for each class, then the overall value were calculated on average of
401
all classes.
402
Accuracy= T P +T N
T P +F N+T N+F P (20)
specif icity= T N
T N+F P (21)
Recall= T P
T P+F N (22)
F−Score= 2∗T P
2∗T P +F P +F N (23)
4.1. Evaluating the proposed MFO-Rough-Set feature selection approach
403
To test our proposed feature selection approach, dataset from the UCI data
404
repository (5) was used, Table 2 summarizes the 6 used data set for further
405
[image:19.612.230.480.168.326.2]experiments.
Table 2: Description of the data sets used in experiments
Dataset No. of samples No. of features No. of classes
Adult 20 4 2
Iris 150 4 3
Zoo 101 16 7
Soybean-small 47 35 4
Lung 32 56 3
heart-scale 270 13 2
Monks 432 6 2
406
To evaluate the proposed MFO-Rough-Set selection algorithm, the average
407
classication accuracy of the selected feature subsets was used and it was
mea-408
sured using the 10-fold cross-validation method was used. This means that
409
all values were veried ten times to ensure the reliability of the experiment.
The dataset was randomly separated into 10 segments. In each iteration, one
411
segment was selected as test data (nonrepetitively) and the others were used
412
as training data. To obtain a value of classication accuracy, the average of
413
the results in each iteration was calculated. All of the experimental results are
414
averaged over the 10 runs of 10-fold Cross-Validation.
415
In this experiment, all of MFO-Rough-Set, PSO-Rough-set, and
GA-Rough-416
Set were tested on the 6 datasets mention above for selecting the best subset
417
of features that eectively describe the dataset. As we mention before, several
418
measurements are used to evaluate the performance of the proposed features
419
selection algorithms. Table 3 shows the number of features selected in the
420
best solution obtained for each optimization technique. As it can be observed
421
from this table, the best obtained results produced from the new MFO feature
422
selection algorithm that for most of the used dataset. Also the number of
423
features resulted after using the new MFO feature selection algorithm always
424
smaller than (or equal in some cases) other algorithms.
[image:20.612.114.479.126.414.2]425
Table 3: Number of features selected for each optimization technique
Dataset MFORSFS PSO GA
Adult 2 2 2
Iris 1 1 1
Zoo 4 5 4
Soybean-small 2 2 5
Lung 14 30 20
Monks 3 3 3
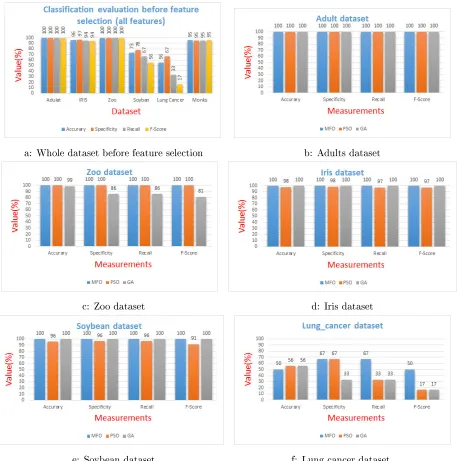
Also in terms of the classication accuracy, Figure (3:a) the accuracy results
426
before applying any feature selection (i.e. using all features) for all datasets.
427
While gures (3:b-f) demonstrates the comparison, in terms of Accuracy,
Re-428
call, Precision and F-Score, results of classication evaluation after using the
429
three feature selection algorithms. From these results, it can be seen that the
430
classication evaluation results of the Monks dataset are the same as the Adult
[image:20.612.216.393.424.560.2]a: Whole dataset before feature selection b: Adults dataset
c: Zoo dataset d: Iris dataset
[image:21.612.79.536.133.594.2]e: Soybean dataset f: Lung cancer dataset
dataset. As it can be observed from gures (3), the best obtained results
pro-432
duced from the new MFO feature selection algorithm that for most of the used
433
dataset Table4listed computational time in seconds regarding the optimization
434
algorithms for the feature selection task.
[image:22.612.206.405.240.378.2]435
Table 4: computational time in seconds regarding the optimization algorithms for the feature selection task
Dataset MFORSFS PSO GA
Adult 45 19 81
Iris 173 52 271
Zoo 76 29 160
Soybean-small 52 18 105
Lung 56 24 103
Monks 1.6383e3 945 4.5012e3
4.2. Evaluating MFO-based tomato Diseases Detection Approach
436
To assess the performance of the proposed MFO-based tomato diseases
de-437
tection approach, rstly a real dataset of diseased tomato leaves were collected.
438
Then, a set of features describing the diseased tomato leaves were extracted.
439
These features were in am×nmatrix, wherem= 200 is the number of used
440
leaves and n = 402 is the number of features that describe each leaf. Three
441
sub-scenarios were also designed here. Firstly, a simple classier, KNN, was
442
used a tness function of MFO and its results were compared to the SVM-based
443
ones. Secondly, a traditional feature selection, i.e., mRMR, was used to select
444
the best features and the classication results were reported and compared with
445
our proposed method. Thirdly, three features selection algorithms (MOF+rough
446
set, PSO+rough sets, and GA+rough sets) were applied in the feature selection
447
phase to choose the best one.
4.2.1. SVM-based vs KNN-based Fitness Function
449
Both of the SVM and KNN classiers were used in the evaluation of the
450
quality of the MFORSFS methods. Two kernel functions (RBF, and
Polyno-451
mial) of the SVM were used and KNN with k=1,3,5, and 7 were also used. A
452
comparison were also conducted between the two classiers and the results are
453
summarized in Table (5), and (6).
454
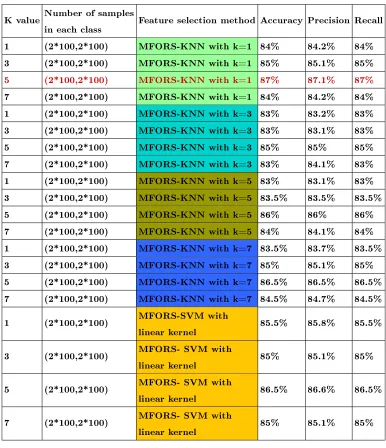
From Table (5), it can be noticed that when using the KNN as a classier
455
with k=5, the highest results 87%, in terms of accuracy, precision and recall, was
456
obtained from features were selected using with MFORS when its parameters
457
are KNN with k= 5
458
Table (5), it could be seen that the highest results, 91.5%, in terms of
accu-459
racy, precision and recall, was obtained using: SVM-Polynomial as a classier
460
from the feature selected by MFORSFS method with KNN is a tness function
461
andk= 5.
462
From Table (6) and (5), it can be noticed that SVM-based classication,
463
applied to the MFORSFS-based features with KNN as tness function, gave
464
better results than that of the KNN-based ones. Where latter gave accuracy at
465
90.5% while the latter gave accuracy at 87
466
4.2.2. MFORSFS-based features vs mRMR-based features
467
A traditional feature selection, i.e., mRMR, was used to select the best
fea-468
tures and the classication results were reported and compared with our
pro-469
posed method. The mRMR experiments, four sets of features (rst 50,100,150,
470
200) were evaluated and the results are summarized in Table (7). From this
471
table, it can be noticed that the highest accuracy results 90.5%, was obtained
472
from using the rst 200 features ranked by mRMR when classied by the
SVM-473
Polynomial.
474
Based on the obtained results and the results of our method in ), it can be
475
noticed that our method is better than mRMR-based results.
476
From Table (Table (5) and (Table (7), it can be noticed that the
MFORS-477
based classication results (91.5%) is better than that of the mRMR-based
[image:23.612.112.484.115.673.2]Table 5: Classication results using KNN classier when the KNN (with dierentkvalues)
and SVM-linear-Kernel were used as tness function in the features selection phase
K value Number of samples
in each class Feature selection method Accuracy Precision Recall 1 (2*100,2*100) MFORS-KNN with k=1 84% 84.2% 84% 3 (2*100,2*100) MFORS-KNN with k=1 85% 85.1% 85%
5 (2*100,2*100) MFORS-KNN with k=1 87% 87.1% 87%
7 (2*100,2*100) MFORS-KNN with k=1 84% 84.2% 84% 1 (2*100,2*100) MFORS-KNN with k=3 83% 83.2% 83% 3 (2*100,2*100) MFORS-KNN with k=3 83% 83.1% 83% 5 (2*100,2*100) MFORS-KNN with k=3 85% 85% 85% 7 (2*100,2*100) MFORS-KNN with k=3 83% 84.1% 83% 1 (2*100,2*100) MFORS-KNN with k=5 83% 83.1% 83% 3 (2*100,2*100) MFORS-KNN with k=5 83.5% 83.5% 83.5% 5 (2*100,2*100) MFORS-KNN with k=5 86% 86% 86% 7 (2*100,2*100) MFORS-KNN with k=5 84% 84.1% 84% 1 (2*100,2*100) MFORS-KNN with k=7 83.5% 83.7% 83.5% 3 (2*100,2*100) MFORS-KNN with k=7 85% 85.1% 85% 5 (2*100,2*100) MFORS-KNN with k=7 86.5% 86.5% 86.5% 7 (2*100,2*100) MFORS-KNN with k=7 84.5% 84.7% 84.5%
1 (2*100,2*100) MFORS-SVM with
linear kernel 85.5% 85.8% 85.5%
3 (2*100,2*100) MFORS- SVM with
linear kernel 85% 85.1% 85%
5 (2*100,2*100) MFORS- SVM with
linear kernel 86.5% 86.6% 86.5%
7 (2*100,2*100) MFORS- SVM with
linear kernel 85% 85.1% 85%
results (90.5%, the highest results in (Table (7). Both these results are obtained
479
using the same kernel functions (polynomial) of the SVM classier. So, it could
480
be claimed that our proposed method is better than the mRMR, the traditional
Table 6: Classication results using SVM classier when KNN (with dierent k values) and SVM-linear-Kernel were used as tness function in the features selection phase.
SVM kernel function
Number of samples
in each class Feature selection method Accuracy Precision Recall RBF (2*100,2*100) MFORS-KNN with K=1 82.5 84.7 82.5 polynomial (2*100,2*100) MFORS KNN with K=1 89 89 89
RBF (2*100,2*100) MFORS-KNN with K=3 82.5 84.7 82.5 polynomial (2*100,2*100) MFORS KNN with K=3 90 90 90
RBF (2*100,2*100) MFORS-KNN with K=5 83 85.8 83 polynomial (2*100,2*100) MFORS KNN with K=5 91.5 91.5 91.5
RBF (2*100,2*100) MFORS-KNN with K=7 83 85 83 polynomial (2*100,2*100) MFORS KNN with K=7 91 91.1 91
RBF (2*100,2*100) MFORS-SVM with
linear function 81.5 83.3 81.5
polynomial (2*100,2*100) MFORS-SVM with
linear function 90.5 90.5 90.5
feature selection method.
482
4.2.3. MFO-Rough-Set vs PSO-Rough-set vs GA-Rough-Set
483
PSO-Rough-set, GA-Rough-Set, The MFO-Rough-Set (our proposed method)
484
feature selection algorithms were applied to select a number of features and to
485
produce classication accuracy. This was done to compare the performance of
486
our method in comparison with the related methods. Figure4 illustrates this
487
comparison between these algorithms in terms of Accuracy, Precision, Recall
488
and F-Score. Figures (4: a) and (4: b) summarize the comparison results before
489
and after employing the three features selection algorithms to original tomato's
490
features (i.e., the 402 Gabor features). Also, gures (4: c) and (4: d)
Table 7: Classication Results Using SVM classier when using mRMR features (rst 50, 100,150, and 200 features)
SVM kernel function
Number of samples
in each class Feature selection method Accuracy Precision Recall RBF (2*100,2*100) mRMR (rst 50 features) 86 87.2 86 polynomial (2*100,2*100) mRMR (rst 50 features) 85 85.1 85
RBF (2*100,2*100) mRMR (rst 100 features) 84.5 85.5 84.5 polynomial (2*100,2*100) mRMR (rst 100 features) 89.5 89.5 89.5
RBF (2*100,2*100) mRMR (rst 150 features) 83 84.7 83 polynomial (2*100,2*100) mRMR (rst 150 features) 89.5 89.5 89.5
RBF (2*100,2*100) mRMR (rst 200 features) 83.5 85.5 83.5 polynomial (2*100,2*100) mRMR (rst 200 features) 90.5 90.5 textbf90.5
strates a comparison between the three methods in terms of the nal reduct size
492
and execution time, respectively.
493
From, Figure 4, it can be noticed that the MFO-based selection algorithm
494
gave the best results for the classication evaluation, and in the execution time.
495
Although, MFO-based method came the second in the reduct size (after the
GA-496
based one), it gave the best in the classication performance and this is the most
497
important in our case. The good performance of the MFO-based approach could
498
be explained by the exploration power of the MFO and the the high performance
499
of rough sets for the feature selection. Where the MFO algorithm uses the t
500
parameter of the spiral equation15. This parameter controls the direction of
501
moth navigation around the ame, thus allowing each moth to y around ame
502
sand not necessarily in the space between them. Consequently, the exploration
503
and exploitation of the search space can be guaranteed.
504
Although the database was manually built in this study, an automatic
pro-505
cess could be achieved as in the following scenario. A mobile app could be
a: Classication accuracy before feature selection b: Classication accuracy after feature selection
[image:27.612.79.558.121.442.2]c: No. of best features d: Computational time in seconds
Figure 4: Visualization for the results of MFORSFS-based tomato diseases detection approach
volved and deployed to trained farmers who can take picture of infected tomato
507
leaf and send it to a server. On this server, the proposed algorithm could be
508
implemented to achieve the disease detection task and then reply to the mobile
509
app (i.e., to the farmer) with the disease name/type or no disease
510
5. Conclusions and Future Work
511
In this paper, a new approach for tomato diseases detection called
MFO-512
based rough set tomato diseases detection approach was introduced. In this
513
approach, a now algorithm for feature selection (i.e. MFORSFS) was proposed,
514
implementedm, and evaluated. This approach is a combination of the MFO
and the rough set and used in the dimension reduction phase of the tomato
516
diseases detection approach. Firstly, the MFORSFS was tested on well dened
517
6 datasets obtained from the UCI machine learning data repository and it was
518
found that MFO-based approach outperformed PSO and GA-based ones. The
519
MFORSFS was then employed the tomato disease detection approach to reduce
520
the number of features to the ones that can eectively describe each leaf of the
521
diseased tomatoes. The MFORSFS algorithm was compared against feature
522
selection based on PSO and GA. It was found that MFORSFS gave much better
523
performance, robustness and faster convergence. In the future, our approach
524
could be improved by applying other parameters selection algorithms for best
525
parameter values selection.
526
References
527
[1] Aghdam, M., Ghasem-Aghaee, N., 2008. Application of ant colony
opti-528
mization for feature selection in text categorization. 2008 IEEE Congress.
529
URL http://ieeexplore.ieee.org/xpls/abs{_}all.jsp?arnumber=
530
4631182
531
[2] Ali, A., Couceiro, M., Anter, A., 2014. Evaluating an evolutionary particle
532
swarm optimization for fast fuzzy c-means clustering on liver ct images.
533
Computer Vision and.
534
URL https://www.google.com/books?hl=en{&}lr={&}id=
535
NBKXBQAAQBAJ{&}oi=fnd{&}pg=PA1{&}dq=evaluating+an+
536
evolutionary+particle+swarm+optimization+for+fast+fuzzy+
537
c-means+Clustering+on+Liver+CT+Images{&}ots=ThKHdrFeyB{&}sig=
538
IqzUnQ25BuIQOo9fb5M8WKlGIVc
539
[3] Arlot, S., Celisse, A., 2010. A survey of cross-validation procedures for
540
model selection. Statistics surveys 4, 4079.
541
URLhttp://projecteuclid.org/euclid.ssu/1268143839
542
[4] Asraf, H. M., Nooritawati, M., Rizam, M. S., 2012. A Comparative Study in
Kernel-Based Support Vector Machine of Oil Palm Leaves Nutrient Disease.
544
Procedia Engineering 41, 13531359.
545
[5] Asuncion, A., Newman, D., 2007. UCI machine learning repository.
546
URLhttps://ergodicity.net/2013/07/
547
[6] Aziz, M. A. E., Hassanien, A. E., jul 2016. Modied cuckoo search algorithm
548
with rough sets for feature selection. Neural Computing and Applications,
549
110.
550
URLhttp://link.springer.com/10.1007/s00521-016-2473-7
551
[7] Basiri, M., Ghasem-Aghaee, N., Aghdam, M., 2008. Using ant colony
552
optimization-based selected features for predicting post-synaptic activity
553
in proteins. European Conference on.
554
URLhttp://link.springer.com/10.1007/978-3-540-78757-0{_}2
555
[8] Bauer, S., Korc, F., Förstner, W., 2009. Investigation into the classication
556
of diseases of sugar beet leaves using multispectral images. EJ van Henten,
557
D. 9, 229-238.
558
URL http://www.wageningenacademic.com/doi/pdf/10.3920/
559
978-90-8686-664-9{#}page=230
560
[9] Bello, R., Nowe, A., Caballero, Y., Gómez, Y., Vrancx, P., 2005. A model
561
based on ant colony system and rough set theory to feature selection. In:
562
Proceedings of the 2005 conference on Genetic and evolutionary
computa-563
tion - GECCO '05. ACM Press, New York, New York, USA, p. 275.
564
URLhttp://portal.acm.org/citation.cfm?doid=1068009.1068053
565
[10] Camargo, A., Smith, J., 2009. An image-processing based algorithm to
au-566
tomatically identify plant disease visual symptoms. Biosystems Engineering
567
102 (1), 921.
568
[11] Chouchoulas, A., Shen, Q., oct 2001. Rough set-aided keyword reduction
569
for text categorization. Applied Articial Intelligence 15 (9), 843873.
URL http://www.tandfonline.com/doi/abs/10.1080/
571
088395101753210773
572
[12] Dash, M., Liu, H., 1997. Feature Selection for Classication. Intelligent
573
Data Analysis 1 (3), 131156.
574
[13] Emary, E., Yamany, W., Hassanien, A. E., dec 2014. New approach for
575
feature selection based on rough set and bat algorithm. In: 2014 9th
576
International Conference on Computer Engineering & Systems (ICCES).
577
IEEE, pp. 346353.
578
URL http://ieeexplore.ieee.org/lpdocs/epic03/wrapper.htm?
579
arnumber=7030984
580
[14] Emary, E., Zawbaa, H. M., Grosan, C., Hassenian, A. E., 2015. Feature
581
Subset Selection Approach by Gray-Wolf Optimization. Springer
Interna-582
tional Publishing, pp. 113.
583
URLhttp://link.springer.com/10.1007/978-3-319-13572-4{_}1
584
[15] Frank, K., Rich, C., Longcore, T., 2006. Eects of articial night lighting
585
on moths. Ecological consequences of.
586
URL https://www.google.com/books?hl=en{&}lr={&}id=
587
dEEGtAtR1NcC{&}oi=fnd{&}pg=PA305{&}dq=++++++Effects+of+
588
artificial+night+lighting+on+moths.{%}5Crq{%}5Crq{~}+++
589
+{&}ots=83{_}ad6b9eM{&}sig=cFViFOg4kNnN3QbTDgH8Ak2d2ps
590
[16] Geyer, L. H., DeWald, C. G., oct 1973. Feature lists and confusion matrices.
591
Perception & Psychophysics 14 (3), 471482.
592
URLhttp://www.springerlink.com/index/10.3758/BF03211185
593
[17] Grigorescu, S. E., Petkov, N., Kruizinga, P., 2002. Comparison of texture
594
features based on gabor lters. IEEE Transactions on Image processing
595
11 (10), 11601167.
596
[18] Guo, Y., Wang, B., Zhao, X., Xie, X., Lin, L., Zhou, Q., aug 2010. Feature
597
selection based on Rough set and modied genetic algorithm for intrusion
detection. In: 2010 5th International Conference on Computer Science &
599
Education. IEEE, pp. 14411446.
600
URL http://ieeexplore.ieee.org/lpdocs/epic03/wrapper.htm?
601
arnumber=5593765
602
[19] Komorowski, J., Øhrn, A., 1999. Modelling prognostic power of cardiac
603
tests using rough sets. Articial Intelligence in Medicine 15 (2), 167191.
604
[20] Liu, L., Zhang, W., Shu, S., Jin, X., 2013. Image recognition of wheat
605
disease based on rbf support vector machine. In: Proceedings of
Interna-606
tional Conference on Advanced Computer Science and Electronics
Informa-607
tion (ICACSEI 2013), Supported by the Key Technology Projects of Anhui
608
Province, China. No. 1201a0301008.
609
[21] Lu, J., Zhao, T., Zhang, Y., 2008. Feature selection based-on genetic
610
algorithm for image annotation. Knowledge-Based Systems.
611
URL http://www.sciencedirect.com/science/article/pii/
612
S095070510800097X
613
[22] Lutu, P., Engelbrecht, A., 2010. A decision rule-based method for feature
614
selection in predictive data mining. Expert Systems with Applications.
615
URL http://www.sciencedirect.com/science/article/pii/
616
S0957417409005831
617
[23] Mirjalili, S., 2015. Moth-ame optimization algorithm: A novel
nature-618
inspired heuristic paradigm. Knowledge-Based Systems 89, 228249.
619
[24] Mokhtar, U., Ali, M. A. S., Hassenian, A. E., Hefny, H., dec 2015. Tomato
620
leaves diseases detection approach based on Support Vector Machines. In:
621
2015 11th International Computer Engineering Conference (ICENCO).
622
IEEE, pp. 246250.
623
URL http://ieeexplore.ieee.org/lpdocs/epic03/wrapper.htm?
624
arnumber=7416356
[25] Naidu, R. A., Perry, E. M., Pierce, F. J., Mekuria, T., 2009. The potential
626
of spectral reectance technique for the detection of Grapevine
leafroll-627
associated virus-3 in two red-berried wine grape cultivars. Computers and
628
Electronics in Agriculture 66 (1), 3845.
629
[26] Nakamura, R. Y. M., Pereira, L. A. M., Costa, K. A., Rodrigues, D., Papa,
630
J. P., Yang, X.-S., aug 2012. BBA: A Binary Bat Algorithm for Feature
631
Selection. In: 2012 25th SIBGRAPI Conference on Graphics, Patterns and
632
Images. IEEE, pp. 291297.
633
URL http://ieeexplore.ieee.org/lpdocs/epic03/wrapper.htm?
634
arnumber=6382769
635
[27] Oliveira, L. S., Sabourin, R., Bortolozzi, F., Suen, C. Y., sep 2003. A
636
Methodology for Feature Selection Using Multiobjective Genetic
Algo-637
rithms for Handwritten Digit String Recognition. International Journal of
638
Pattern Recognition and Articial Intelligence 17 (06), 903929.
639
URL http://www.worldscientific.com/doi/abs/10.1142/
640
S021800140300271X
641
[28] Pawlak, Z., oct 1982. Rough sets. International Journal of Computer &
642
Information Sciences 11 (5), 341356.
643
URLhttp://link.springer.com/10.1007/BF01001956
644
[29] Phadikar, S., Sil, J., Das, A., 2012. Classication of Rice Leaf Diseases
645
Based onMorphological Changes. International Journal of Information
646
2 (3), 460.
647
URL http://search.proquest.com/openview/
648
72e1db851a71867d848c4f03e5dbaa2b/1?pq-origsite=gscholar
649
[30] Rodrigues, D., Pereira, L. A., Nakamura, R. Y., Costa, K. A., Yang, X.-S.,
650
Souza, A. N., Papa, J. P., 2014. A wrapper approach for feature selection
651
based on Bat Algorithm and Optimum-Path Forest. Expert Systems with
652
Applications 41 (5), 22502258.
[31] Salama, M. A., Hassanien, A. E., Fahmy, A. A., Kim, T.-h., 2011. Heart
654
Sound Feature Reduction Approach for Improving the Heart Valve Diseases
655
Identication. Springer Berlin Heidelberg, pp. 280290.
656
URLhttp://link.springer.com/10.1007/978-3-642-27183-0{_}30
657
[32] Salama, M. A., Hassanien, A. E., Mostafa, A., dec 2016. The prediction of
658
virus mutation using neural networks and rough set techniques. EURASIP
659
Journal on Bioinformatics and Systems Biology 2016 (1), 10.
660
URL http://bsb.eurasipjournals.springeropen.com/articles/10.
661
1186/s13637-016-0042-0
662
[33] Sayed, G. I., Soliman, M., Hassanien, A. E., 2016. Bio-inspired Swarm
663
Techniques for Thermogram Breast Cancer Detection. Springer
Interna-664
tional Publishing, pp. 487506.
665
URLhttp://link.springer.com/10.1007/978-3-319-33793-7{_}21
666
[34] Sweidan, A., El-Bendary, N., Hassanien, A., 2015. Water Quality
Clas-667
sication Approach based on Bio-inspired Gray Wolf Optimization. In
668
7th IEEE International Conference of Soft Computing and Pattern
669
Recognition, 13 15.
670
URL http://scholar.cu.edu.eg/sites/default/files/abo/files/
671
water{_}quality{_}classification{_}approach{_}based{_}on{_}bio-inspired{_}gray{_}wolf{_}optimization.
672
673
[35] Wang, X., Yang, J., Teng, X., Xia, W., Jensen, R., 2007. Feature selection
674
based on rough sets and particle swarm optimization.
675
[36] Weizheng, S., Yachun, W., Zhanliang, C., Hongda, W., 2008. Grading
676
Method of Leaf Spot Disease Based on Image Processing. In: 2008
677
International Conference on Computer Science and Software Engineering.
678
IEEE, pp. 491494.
679
URL http://ieeexplore.ieee.org/lpdocs/epic03/wrapper.htm?
680
arnumber=4723305
[37] Z., P., S., R., 1991. Theoretical aspects of reasoning about data. Nonvell,
682
MA: Kluwer.
683
[38] Zawbaa, H. M., Hassanien, A. E., Emary, E., Yamany, W., Parv, B.,
684
dec 2015. Hybrid ower pollination algorithm with rough sets for feature
685
selection. In: 2015 11th International Computer Engineering Conference
686
(ICENCO). IEEE, pp. 278283.
687
URL http://ieeexplore.ieee.org/lpdocs/epic03/wrapper.htm?
688
arnumber=7416362
689
[39] Zivkovic, Z., van der Heijden, F., 2006. Ecient adaptive density estimation
690
per image pixel for the task of background subtraction. Pattern recognition
691
letters 27 (7), 773780.