International Journal of Emerging Technology and Advanced Engineering
Website: www.ijetae.com (ISSN 2250-2459,ISO 9001:2008 Certified Journal, Volume 5, Issue 7, July 2015)
476
Image Based Hand Gesture Recognition using Statistical
Features and Soft Computing Techniques
S. Nagarajan
1, T. S. Subashini
21Assistant Professor, 2Associate Professor, Department of CSE, Annamalai University, Tamilnadu, India
Abstract—In automatic hand gesture recognition system, hand shape localization, feature extraction and the recognition of gestures are the challenging issues. In this paper, we propose an image based automated hand gesture recognition system for American Sign Language (ASL) numbers. Some statistical features are extracted from the segmented images during training and testing and these features are given as the input to Support vector machine (SVM), k-Nearest Neighbour (k-NN) and Back propagation neural network (BPNN) classifiers for classification and recognition of the hand gestures. The proposed system is able to recognize 10 different gestures with an accuracy of 98.4% on the ASL dataset using SVM.
Keywords—Computer vision, Hand gesture recognition, Image processing, Statistical Features, Pattern recognition.
I. INTRODUCTION
Vision based hand gesture recognition [1] is one of the hot research topics in human computer interaction and image processing. Several researchers have contributed in this field for the past decades. However, most of the findings still encourage the researchers to work further in hand gesture recognition for the benefit of hard of hearing community. Computer vision is employed not only in laboratories but also in our daily lives. The hearing impaired people use gestures to communicate with others in day to day life. Hence, the design of an intelligent human-computer interface [2] through hand gestures is mandatory. Gesture is a movement of our body part, especially hand or head to express some meaningful information or feeling. There are two approaches used in gesture recognition, data glove based and vision based. Data glove is a sensor which provides the information of movement of hands. These information are collected from the sensors and processed further to recognize the gestures. The data glove based approach is time consuming and expensive in which the user has to wear the sophisticated hardware. Therefore, the vision based approach is widely used nowadays. The main objective of static hand gesture recognition is to identify the various kinds of hand postures which remain still over a period of time in videos. The interpretation of user's gestures in real time environment and complex background is an important research.
In this paper, an automatic hand gesture recognition system is implemented using computer vision for identifying the different hand poses from static images which are captured under a uniform background. In this research, we have attempted to recognize single handed American sign language (ASL) gestures which represent the numbers from zero to nine using different pattern classification models.
II. RELATED WORK
An automatic recognition system [3] is presented by Ali Karami et.al to recognize the alphabets of Persian Sign Language (PSL) using Discrete Wavelet Transform and multi layer perceptron neural network. This system detects the static gestures from bare hand images and achieves the classification accuracy of 94.06%. Sole et.al introduced Extreme Learning Machine based system [4] for South African Sign Language (SASL) recognition which yields an accuracy of 95%. A data glove based approach was developed by Liang et.al [5] for Taiwanese Sign Language in which the isolated words were recognized using two HMM models. This work reported the recognition rates of 84% and 70% for 71 words and 250 words respectively. A real time continuous Chinese Sign Language (CSL) recognition system was designed by Jiyong and Wen [6] using the raw data collected from the signer with the help of a pair of data gloves and a 3D tracker. Bowden et.al presented a British Sign Language (BSL) recognition system [7] by extracting the position, movement and hand shape features from the input hand images. In [8], the numbers of American Sign Language (ASL) are recognized using combined DCT-DWT features and different pattern classification models. P.Subha Rajam et.al [9] proposed a novel system to recognize the native Tamil Sign alphabets using 32 combinations of finger positions and binary to decimal conversion algorithm.
III. PROPOSED METHODOLOGY
International Journal of Emerging Technology and Advanced Engineering
Website: www.ijetae.com (ISSN 2250-2459,ISO 9001:2008 Certified Journal, Volume 5, Issue 7, July 2015)
477
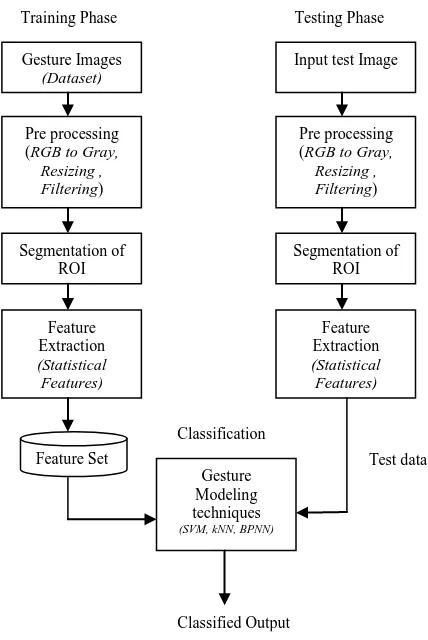
[image:2.612.55.269.255.575.2]The proposed system consists of four modules such as pre-processing, segmentation of region of interest (ROI), feature extraction and recognition of gestures. The pre processing steps and localization of ROI are discussed in this section. The ASL dataset [10] used in this research work consists of 10 classes of images for the ASL numbers 0-9, each class having 70 images with solid background collected from five different subjects. Totally there are 700 images in the dataset. The schematic block diagram of the proposed system is shown in Fig. 1.
Fig. 1. Block diagram of the proposed system
All the images in the dataset are stored in PNG format. During image acquisition,, unwanted noise will be present in the image due to imaging devices. Therefore, it is necessary to pre process the input images before feature extraction. Because, the recognition results depend on the extracted features.
A. Preprocessing and Segmentation of ROI
The input images are first converted from RGB into gray scale. Processing of background pixels in the image results in higher computational time.
Therefore, only the region of interest (ROI) i.e. hand is segmented and processed. Since the gray scale images have 256 gray levels, every pixel in the image is assigned a decimal number ranging from 0 to 255. To crop the ROI, the average intensity value 'S' is calculated from the image matrix. If I is the image of size of r x c, then the average intensity value is calculated as follows:
∑ ∑ ( ) ( )
Where r and c are the number of rows and columns of the image I respectively. If the intensity value of a pixel is less than S, then zero is assigned to that pixel. Thus, the image is cropped in four corners by eliminating the rows and columns whose intensity value is zero. The image cropping process is shown in Fig. 2.
Fig. 2. Image cropping process
In, Fig. 2, 'A' represents the gray intensity of a pixel which is greater than or equal to the average value S. In the above figure, The segmented and cropped images for all the classes are shown in Fig. 3.
0 1 2 3 4
Gesture Images
(Dataset)
(Pre processing (RGB to Gray, Resizing , Filtering)
(Segmentation of ROI
( Feature Extraction
(Statistical Features)
(
Feature Set
Input test Image
(
Pre processing (RGB to Gray, Resizing , Filtering)
(Segmentation of ROI
( Feature Extraction
(Statistical Features)
( Gesture Modeling techniques (SVM, kNN, BPNN)
(
Classification
Classified Output
Test data
[image:2.612.372.530.333.563.2]International Journal of Emerging Technology and Advanced Engineering
Website: www.ijetae.com (ISSN 2250-2459,ISO 9001:2008 Certified Journal, Volume 5, Issue 7, July 2015)
478
[image:3.612.50.276.320.466.2]
. 5 6 7 8 9
Fig. 3. Segmented images
B. Feature Extraction
After segmentation, the next important stage is feature extraction. Feature extraction is the efficient transformation of image characteristics into a compact feature vector which represents the information needed for classification. The following five statistical features are extracted from each segmented image.
∑ ( ) ( ) ( )
∑
( )
( ) ( )
√∑( ) ̅̅̅ ( )
∑ ( )̅̅̅ ⁄ ( )
[image:3.612.318.571.449.660.2]After feature extraction, the features are saved as a feature vector and the dimension of the input feature vectors is 400x5. From the ASL dataset, 400 images are used for training and 300 images which are not included in the training dataset are used for testing. Table 1 gives the extracted features of a training and testing sample.
Table I
Extracted Features For A Training And Test Sample
Statistical Feature
Train Sample Test Sample
Mean 63.1898 56.9987
Standard
Deviation 13.1480 14.5143 Entropy 4.1796 4.5353 Skewness 1.4095 1.3808 Kurtosis 150.9555 76.2918
IV. GESTURE RECOGNITION USING SVM
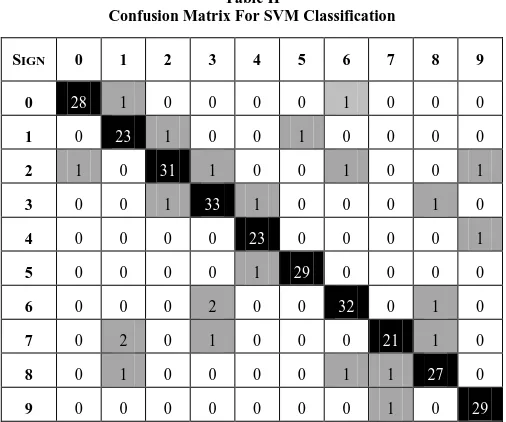
The classification of hand gesture images is performed using the SVM classifier by employing one-against-all (OAA) approach. Support Vector Machine is a powerful machine learning technique for classification and regression. It is a supervised learning machine where its support vectors and kernels are employed for many learning tasks. By choosing the appropriate kernel functions, different tasks could be performed in various domains. A support vector machine constructs a separating hyper plane in a high dimensional space. SVM is used to classify the group of test data as one of the ten gestures, depending upon the feature values. In this research, classification is done for ten categories of gesture images. Therefore, ten binary SVM models are created where each SVM model is trained to distinguish one class of images from the remaining nine classes. For example, the SVM classifier for class one data (number zero) is assigned +1 and the remaining nine classes (numbers one, two, three, four, five, six, seven, eight, nine) are assigned as -1. Other SVM classifiers are constructed on the same way. Ten SVMs are trained independently for classifying ten classes of hand gestures. When the test or query image is given, it is classified based on the trained SVM models. The confusion matrix of SVM for unequal dataset is shown in Table 2.
Table II
Confusion Matrix For SVM Classification
SIGN 0 1 2 3 4 5 6 7 8 9
0 28 1 0 0 0 0 1 0 0 0
1 0 23 1 0 0 1 0 0 0 0
2 1 0 31 1 0 0 1 0 0 1
3 0 0 1 33 1 0 0 0 1 0
4 0 0 0 0 23 0 0 0 0 1
5 0 0 0 0 1 29 0 0 0 0
6 0 0 0 2 0 0 32 0 1 0
7 0 2 0 1 0 0 0 21 1 0
8 0 1 0 0 0 0 1 1 27 0
[image:3.612.53.283.552.718.2]International Journal of Emerging Technology and Advanced Engineering
Website: www.ijetae.com (ISSN 2250-2459,ISO 9001:2008 Certified Journal, Volume 5, Issue 7, July 2015)
[image:4.612.46.289.156.232.2]479
Table IIIMetrics For Evaluation Of Classifier Performance
Measure Formula
Accuracy (TP+TN) / (TP+TN+FP+FN)
Sensitivity/Recall TP/(TP+FN)
Specificity TN(TN+FP)
Precision TP/(TP+FP)
F-Score 2 *(Precision*Recall) / (Precision+Recall)
From the confusion matrix given in Table 2, the overall accuracy, sensitivity and specificity of the SVM model are calculated. The performance of the classifier is evaluated using the various measures as shown in Table 3. The accuracy, specificity and sensitivity of SVM for individual class are calculated and tabulated in Table 4.
TableIV
Performance Measures OfSVM
Class Accuracy (%)
Specificity (%)
Sensitivity (%)
Zero 99.00 99.62 93.33
One 98.00 98.54 92.00
Two 98.00 99.24 88.57
Three 97.66 98.49 91.66
Four 99.00 99.27 95.83
Five 99.30 99.62 96.67
Six 98.00 98.86 91.42
Seven 98.00 99.27 84.00
Eight 98.00 98.88 90.00
Nine 99.00 99.25 96.67
TableV
Precision, Recall & F-Score OfSVM
Class Precision (%)
Recall (%)
F-Score (%)
Zero 96.55 93.33 94.91
One 85.18 92.00 88.45
Two 93.93 88.57 91.17
Three 89.19 91.66 90.40
Four 92.00 95.83 93.87
Five 96.67 96.67 96.67
Six 91.42 91.42 91.42
Seven 91.30 84.00 87.49
Eight 90.00 90.00 90.00
Nine 93.54 96.67 95.07
Table 5 shows the precision and recall values calculated for each class.
V. GESTURE RECOGNITION USING KNN
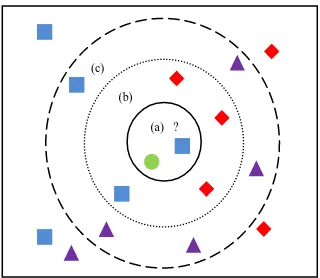
KNN algorithm is used for classification in this research because it is the simplest machine learning algorithm and it is very easy to implement. It is a technique based on the closest training samples in the feature space. When the test sample is given, the distance between the test sample and all the training samples are first calculated using Euclidean distance. Then, the 'k' nearest neighbours which have minimum distance are determined. Once the nearest neighbours are found, the test sample is classified according to the majority votes of the nearest neighbours. k-NN Training involves storing the input feature vectors and their corresponding labels. In the testing phase, the unlabelled query image is simply assigned to the label of its k nearest neighbours. The k-NN classification process is shown in Fig. 4. for different values of k.
Fig. 4 k-NN Classification for k=1, 5 or 10. (a) Test data is a rectangle (b) a diamond (c) a triangle.
Typically, the test data is classified based on the majority labels of its k nearest neighbours. For k=1, the class label of test image is assigned as the class of its nearest object If there are only two classes, k must be an odd integer. For multiclass classification, ties occur even though k is an odd integer. The Euclidean distance 'd' between the training feature vector X=(x1,x2, ……xn) and the test feature vector Y= (y1,y2,…..yn) of fixed length is calculated using the following equation.
√( ) ( ) ( ) (7)
The accuracy of k-NN classifier is found by choosing different values of k. We obtained the better classification accuracy of 96% at k=5. If the value of k is increased further, there is no significant improvement in the performance.
(c)
(b)
[image:4.612.46.292.323.651.2] [image:4.612.361.521.327.466.2]International Journal of Emerging Technology and Advanced Engineering
Website: www.ijetae.com (ISSN 2250-2459,ISO 9001:2008 Certified Journal, Volume 5, Issue 7, July 2015)
480
VI. GESTURE RECOGNITION USING BPNN
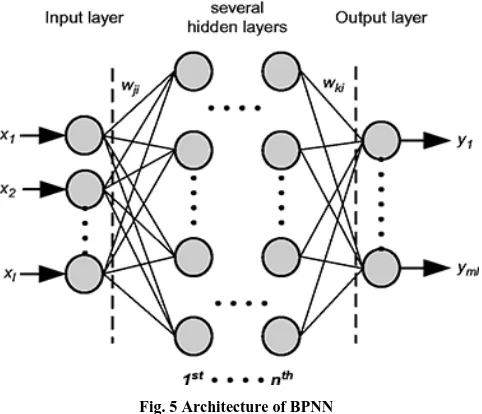
[image:5.612.334.559.139.296.2]The application of neural network in pattern classification has two advantages: Accurate classification and code simplification Fig. 5 shows the feed forward architecture of Back Propagation Neural Network.
Fig. 5 Architecture of BPNN
A feed forward back propagation neural network is a supervised machine learning technique where each input vector requires a corresponding target vector. It consists of one input layer, no. of hidden layers, and an output layer. Here, sigmoid is used as the activation function. The input vector and target vector are used to train the BPNN. The gradient descent learning function 'traingdx' is used during training. The actual output is compared with the target output and an error signal is generated. This error signal propagates backward to adjust the weights between the layers. This process continues in an iterative way until the actual output matches the target output. BPNN algorithm consists of initialization weights, feed forward and back propagation of error. Once the weights of the neurons are adjusted in the training phase, their values are fixed and the unknown input images are classified by the ANN. Fig. 6. shows the training performance of the neural network.
Fig. 6 Training Performance of BPNN showing the Mean squared error Vs number of Epochs
The true positives, true negatives, false positives and false negatives for all the classes in SVM, KNN and BPNN classification are shown in Table 6. Based on the confusion matrix, the accuracy, specificity, sensitivity and F-Score of the classifiers are calculated and given in Table 7.
TableVI
Overall Confusion Matrix Of Classifiers
Classifier TP TN FN FP
SVM 276 2676 24 24
KNN 265 2615 35 85
BPNN 280 2510 20 190
TableVII
Classification Results ofSVM,KNN&BPNN
Classifier Accuracy Sensitivity Specificity F-Score
SVM 98.40 92.00 99.11 92.00
KNN 96.00 88.33 96.85 81.53
BPNN 93.01 93.33 92.96 72.72
[image:5.612.50.291.201.408.2] [image:5.612.318.570.407.560.2]International Journal of Emerging Technology and Advanced Engineering
Website: www.ijetae.com (ISSN 2250-2459,ISO 9001:2008 Certified Journal, Volume 5, Issue 7, July 2015)
481
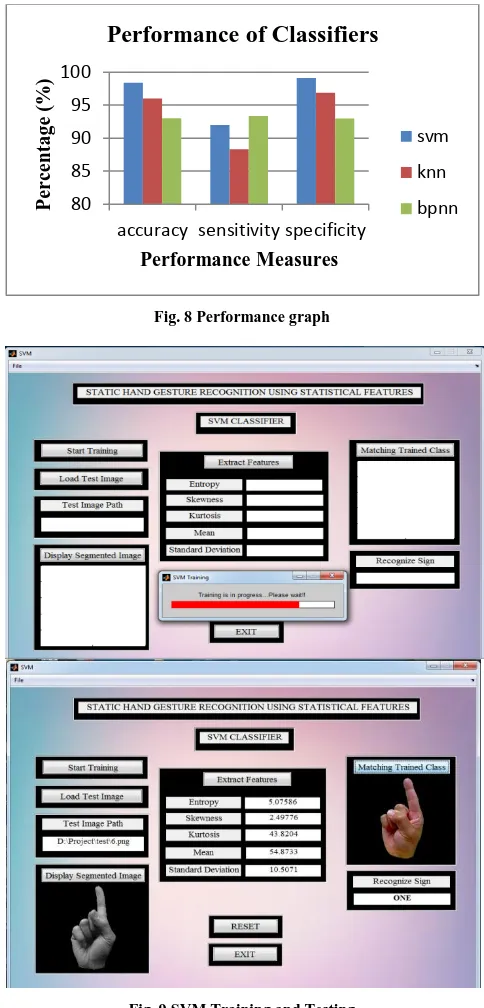
[image:6.612.323.565.184.688.2]ROC curve below the diagonal line indicates the poor classification. The ROC curve of the proposed system which is obtained by plotting the sensitivity and specificity is shown in Fig. 7. The comparison between the proposed method and the existing methods in recognition of ASL gestures is given in Table 8. The performance graph is shown in Fig. 8.
Fig. 7 ROC Curve
TableVIII
Comparison Between Proposed Work And Existing Works
S.No. Features Extracted
Type of Classifier
Accuracy Ref.
1. Linguistic
Features HMM 84% [5]
2. DWT MLP 99.04% [3]
3.
Location, Motion and Shape
Markov chains + ICA
97.67% [7]
4. Combined
DCT+DWT SVM 98.0% [8]
5. Fingertip positions
Angular
analysis 99.35% [9]
6. Statistical Features
SVM KNN BPNN
98.4% 96.0% 93.01%
Proposed Method
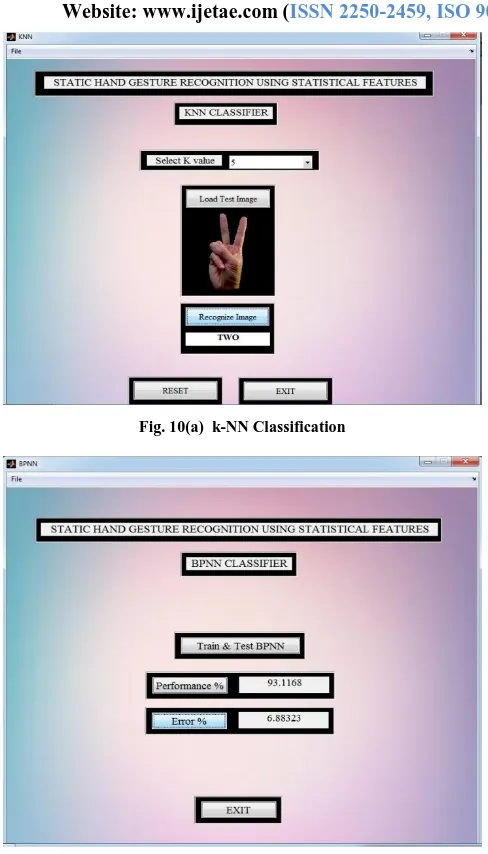
The performance graph of the classifiers is shown in Fig. 8. The snapshots of the GUI for classification of gestures using SVM, k-NN and BPNN are depicted in Fig. 9 & Fig.10(a) and 10(b).
Fig. 8 Performance graph
Fig. 9 SVM Training and Testing 80
85 90 95 100
accuracy sensitivity specificity
P
er
ce
nta
g
e
(%)
Performance Measures
Performance of Classifiers
svm
knn
[image:6.612.60.271.227.430.2] [image:6.612.47.286.446.679.2]International Journal of Emerging Technology and Advanced Engineering
Website: www.ijetae.com (ISSN 2250-2459,ISO 9001:2008 Certified Journal, Volume 5, Issue 7, July 2015)
482
Fig. 10(a) k-NN ClassificationFig. 10(b) BPNN Classification
VII. CONCLUSION
This paper proposed an automated system for classification and recognition of hand gestures which represent the ASL numbers. The input hand image is first converted into gray scale and the region of interest is cropped using a cropping algorithm.
The statistical features are extracted from the cropped image and the features are applied as the input to the supervised machine learning techniques such as SVM, k-NN and BPk-NN for classification of gestures. From the experimental results, it is observed that the SVM achieves the highest accuracy of 98.4% and it outperforms k-NN and BPNN for the given ASL dataset. This system is useful for the speech and hearing impaired people for communicating with others through hand gestures. This work can be extended further to recognize the dynamic gestures from real time video sequences which involves motion of hand so as to develop an efficient human computer interface.
REFERENCES
[1] Simion, G., Gui, V., and Otesteanu, M. 2012 "Vision Based Hand Gesture Recognition: A Review". International Journal of Circuits, Systems and Signal Processing. Vol. 6, Issue. 4, pp.275-282. [2] Elakkiya, R., Selvamani, K., Kanimozhi, S., Rao. Velumadhava.,
and Kannan, A. 2012. "Intelligent System for Human Computer Interface using Hand Gesture Recognition". International Conference on Modelling Optimization and Computing. Procedia Engineering, Science Direct. Vol.38, pp.3180-3191.
[3] Ali Karami, Bahman Zanj, Azadeh Kiani Sarkaleh. 2011 "Persian Sign Language (PSL) using Wavelet Transform and Neural Networks". Elsevier, Expert Systems with Applications. Vol. 38, pp. 2661 - 2667.
[4] Sole, M.M., Tsoeu, M.S. 2011 "Sign Language using the Extreme Learning Machine". Dept. of Electr. Eng., University of Cape Town (UCT), South Africa. AFRICON, 13-15, Sep.
[5] Rung-Huei Liang, Ming Ouhyoung. 1998 "A Real-Time continuous Gesture Recognition System for Sign Language". Proceedings of Third IEEE International Conference, Nara, Japan.
[6] Wen Gao, Jiyong Ma, Jiangqin Wu ChunliWang. 2001 "A continuous Chinese Sign Language Recognition System". Proceedings of International Conference on InfoTech and Infonet, Beijing, China. Vol. 3, pp.43-549.
[7] Richard Bowden, David Windridge, Timor Kadir, Andrew Zisserman and Michael Brady. 2004. "A linguistic feature vector for the visual interpretation of sign language". Computer Science Journal, Vol.3021, pp. 390-401.
[8] Nagarajan, S., Subashini, T.S., 2015 "Vision based Recognition of American Sign Language numbers using Combined DCT-DWT features and Machine Learning", Advances in Natural and Applied Sciences, Vol.9, Issue.6, pp.167-173.
[9] Subha Rajam, P., Balakrishnan, G. 2013. "Design and Development of Tamil Sign Alphabets using Image Processing with Right Hand Palm to aid Deaf-Dumb People". Taylor and Francis, IETE Journal of Research, Vol.59, Issue. 6, pp. 709-718.
[image:7.612.47.291.118.545.2]