ISSN: 1992-8645 www.jatit.org E-ISSN: 1817-3195
AN ANALYSIS OF IMAGE QUALITY ASSESSMENT
ALGORITHM TO DETECT THE PRESENCE OF
UNNATURAL CONTRAST ENHANCEMENT
1NUR HALILAH BINTI ISMAIL, 2SOONG-DER CHEN, 3LIANG SHING NG, 4ABD RAHMAN
RAMLI 1, 2
Department of Computer Science and Information Technology, University Tenaga Nasional 3
Department of Manufacturing Engineering, University Malaysia Pahang 4
Department of Computer and Communication Engineering, University Putra Malaysia
E-mail: [email protected] , [email protected] , [email protected] , 4
ABSTRACT
Image contrast enhancement purposely aim the visibility of image to be increased. Most of these problems may happen after contrast enhancement: amplification of noise artifacts, saturation-loss of details, excessive brightness change and unnatural contrast enhancement. The main objective of this paper is to present an extensive review on existing Image Quality Assessment Algorithm (IQA) in order to detect the presence of unnatural contrast enhancement. Basically, the IQA used produced quality rating of the image while consistently with human visual perception. Current IQA to detect presence of unnatural contrast enhancement: Lightness Order Error (LOE), Structure Measure Operator (SMO) and Statistical Naturalness Measure (SNM). However, result of current IQA evaluation shows it may not giving consistent quality rating with human visual perception. Among three IQAs, SNM demonstrate better performance compared to LOE and SMO. But, it suffers with consistent rating for different spatial image resolution in same image content. Thus, an improvement suggested in this paper to overcome such problem occurred.
Keywords: Contrast Enhancement, Unnatural Enhancement, Contrast Naturalness, Naturalness Quality
1. INTRODUCTION
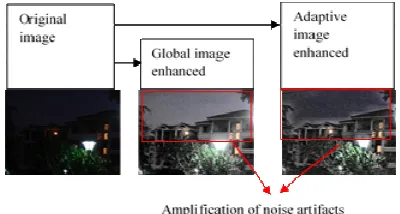
[image:1.612.321.521.497.604.2]Image enhancement plays important roles in order to produce a good quality of image in digital imaging area. It comprises image contrast enhancement, image sharpening and image smoothing [1]. The aim of image contrast enhancement is to ensure the visibility of image details increased [2]. Figure 1 illustrate process of contrast enhancement.
Figure 1. Process Of Contrast Enhancement
Most of these problems may happened after the contrast enhancement: amplification of noise artifacts, saturation-loss of details, excessive brightness change and unnatural contrast enhancement. Figure 2 until figure 5 illustrate
image which suffers with stated problems after using global and adaptive histogram equalization.
[image:1.612.100.289.589.656.2]ISSN: 1992-8645 www.jatit.org E-ISSN: 1817-3195
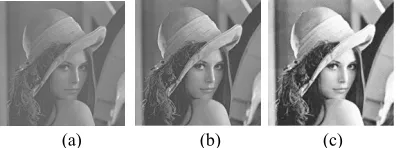
[image:2.612.90.296.86.487.2]Figure 3. Sample Of Saturation-Loss Of Details
Figure 4. Sample Of Excessive Brightness Change
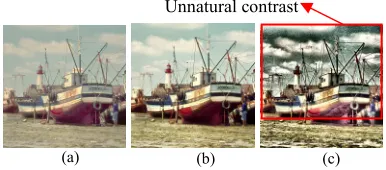
Figure 5. Sample Of Unnatural Contrast Enhancement
In order to overcome the problems, IQA is take place since it provides a feedback for the computation achieved the best settings for the contrast enhancement algorithm. Thus, this paper aim is to present an extensive review on existing IQA to detect presence of unnatural contrast enhancement.
2. EXTENSIVE REVIEW OF EXISTING IQA
2.1 Overview of IQA Algorithm
The main purpose of IQA is designed to automatically assess the quality of image with good agreement of human quality evaluation. The evaluation comprises subjective and objective evaluation. The subjective evaluation basically
required human as a subject to assess the quality of image. While the objective evaluation is to overcome the weaknesses consist in subjective evaluation since there are limitation of time consuming [3].
The IQA involve two main purposes, first, it is used to assess the optical image quality then automatically adjust the setting to gain the best quality. Second, the algorithm can be embedded into image processing in order to fully optimize the algorithm and achieve optimal design in preprocessing to give the best parameter setting [3].
Generally, IQA can be described into three methods called Full Reference (FR), Reduce Reference (RR) and No Reference (NR). Table 1 illustrate the description of each method.
Table 1: Description Of Iqa Methods.
IQA
methods Description
Full Reference
(FR)
The FR IQA required both reference and its processed image. this method commonly used but the limitation of FR IQA, it is not applicable when the reference image is not available due to reason such as transmission of compressed video/image since the receiver unable to assess the reference image [4].
Reduced Reference
(RR)
The RR IQA required to extract some features of reference image. Number of size used relatively small since it is transmitted together with compressed video/image without affecting the bandwidth [4].
No Reference
(NR)
The NR IQA required no reference image, only processed image. The method basically developed by taking some knowledge in order to estimate the quality of the image. This method most applicable but more complicated since it does not required any assessment to reference image [4].
2.2 Classification of IQAs
ISSN: 1992-8645 www.jatit.org E-ISSN: 1817-3195
Figure 6. Classification Of IQA
The research is focus on image, thus, 2D QA image quality most applicable to be used. There are two types of techniques under 2D QA image quality called fidelity based and non-fidelity based. The fidelity based consist of general IQA and distortion specific IQA. Most of existing IQA are fidelity based such as assessment of similarity between reference and distorted images. Example of IQA used fidelity based can be found here [5] – [20].
While non-fidelity consist of sharpness and contrast measure and distortion measure. As this research is focus to detect the presence of unnatural contrast enhancement, thus, the review is focus to identify the existence IQA which take non-fidelity based as basis of algorithm designed. The previous works of IQA of non-fidelity based can be found here [21] – [36]. However, existing non-fidelity based algorithm found also not addressing the unnatural enhancement issue.
3. CONTRAST ENHANCEMENT RELATED
IQAS
3.1 Contrast and Sharpness Measure Related
IQAs
The contrast measure basically used to evaluate the contrast enhanced quality. Table 2 present some of the contrast and sharpness measure.
Table 2: List Of Contrast And Sharpness Measure.
Author Year Method
E.H. Weber 1834 Weber Contrast [22]
Albert A.
Michelson 1927 Michelson Contrast [21]
S. S. Agaian, K. Panetta, and A. M. Grigoryan
2000
EMEE (Measure Of Enhancement By Entropy) [29]
S. S. Agaian, K.
Panetta, and A. 2001
EME (Measure Of Enhancement) [28]
Grigoryan
Rizzi et al 2004 RAMMG (based on pyramid
subsampling) [27]
E. Wharton, S. Agaian, and K Panetta
2006
LogAME (Logarithmic Michelson Contrast Measure) and LogAMEE (Logarithmic AME By Entropy) [36]
Rizzi et al 2008 RSC (combination of
RAMMG and D.O.G) [24]
Gabriele Simone, Marius Pedersen, Jon Yngve Hardeberg, and Alessandro Rizzi
2009
MLF (Multi Level Framework, based on RSC
neighbourhood computation)
[25]
Mohan Liu and Patrick Ndjiki-Nya
2012 HAID (Human Attention
And Image Dynamic) [26]
In order to demonstrate the weakness of previous contrast and sharpness measure, the comparison is performed. Figure 7 show image with poor and good contrast level. Result from the contrast measure obtained from [37] presented in Table 3.
[image:3.612.313.513.331.405.2]
Figure 7. (a) Very poor contrast (b) Slightly poor contrast (c) Good contrast
Table 3: The Comparison Between Contrast And Sharpness Measures.
METRICS CONTRAST QUALITY
(a) (b) (c) Michelson Contrast 0.432 0.432 0.439
Weber Contrast 0.101 0.085 0.06 EME (Measure of
Enhancement) 1.36 2.06 3.98 EMEE
(Measure of Enhancement By
Entropy)
0.08 0.13 0.35
AME (Logarithmic Michelson Contrast
Measure)
76.17 68.45 57.31
AMEE (Logarithmic
AME By Entropy) 0.10 0.13 0.18
From the result presented in Table 3, the quality rating keep increasing as long as the contrast level is increase like presented by Michelson, EME, EMEE and AMEE. While some of the quality rating keep decreasing as the contrast level is increase like presented by Weber and AME. Based on this result obtained at here [37], this
[image:3.612.92.296.645.738.2]ISSN: 1992-8645 www.jatit.org E-ISSN: 1817-3195 shows that the contrast and sharpness measure applicable
to evaluate the changes of contrast only.
3.2 IQAs Related to the Problem of Contrast
Enhancement
Existing IQA to detect common problem after the contrast enhancement effectively measure by proposed method such as Absolute Mean Brightness Error (AMBE), Entropy and Edge-Based IQA [38]. The AMBE designed to detect changes of overall brightness by taking the absolute difference between average brightness between reference and processed image.
While Entropy, purposely design to measure the uncertainty based on the random variable. Both AMBE and Entropy focus to detect the presence of poor noise and saturation problems in the image. Whereas, the Edge-based aim to detect the presence of annoying distortion by extracting features by using edge detection.
4. IQAS RELATED TO NATURALNESS
AND THEIR WEAKNESSES
4.1 Lightness Order Error (LOE)
The LOE is proposed by [39] to design an algorithm based on the relative lightness order. The LOE claimed to measure the naturalness by taking the light source direction and lightness variation. The changes of lightness order between original and its enhanced image indicate the naturalness level. Rating of LOE is high when the lightness order is high, thus high potential for the enhanced image suffer with unnatural contrast enhancement. Figure 8 and Figure 9 show sample of test image tested with LOE.
Figure 8 (a) Original image. (b) Good contrast enhancement (LOE = 0.1306). (c) Unnatural contrast enhancement (LOE = 0.1944).
Figure 9 (A) Original Image. (B) Good Contrast Enhancement (LOE = 0.0026). (C) Unnatural Contrast
Enhancement (LOE = 0.102).
Notice that, Figure 8 (b) is a well enhanced contrast image has LOE = 0.1306 while Figure 9 (c) is suffers from unnatural contrast enhancement has LOE = 0.102. From the result shown, the result given by LOE unable to tell if an image has been well enhanced or unnaturally enhanced. Due to the result obtained, high order change is supposed to give higher rate. The LOE quality is defined as:
Equation (1) compute the maximum of color channel to find the lightness of imageL(x,y).
Equation (2) compute the relative order between original image (I) and enhanced version (Ie) to find the lightness difference for each pixel (x,y). The m and n indicate as height and width of the image. While U(x,y) is the step function to compute the exclusive or operator. The truth table XOR as below:
A B OUTPUT
0 0 0
0 1 1
1 0 1
1 1 0
Equation (3) is the last stage of LOE computation to produced final rating.
4.2 Structure Measure Operator (SMO)
The SMO is proposed by [40] to design an algorithm based on the structure difference (SD) Unnatural contrast
(a) (b) (c)
Unnatural contrast
(a) (b) (c)
(1)
(2)
[image:4.612.329.520.87.205.2] [image:4.612.98.291.521.606.2] [image:4.612.363.517.568.666.2]ISSN: 1992-8645 www.jatit.org E-ISSN: 1817-3195 between original and enhanced image. The SMO
claimed to detect the over enhancement by detecting the changes of structure after he over enhancement based on the non-homogeneity of the image. Rating of SMO is high when the structural change is high, thus high potential for the enhanced image suffer with unnatural contrast enhancement. Figure 10 and Figure 11 show sample of test image tested with SMO.
Figure 10 (A) Original Image. (B) Good Contrast Enhancement (SMO = 0.9436). (C) Unnatural Contrast
Enhancement (1.515).
Figure 11 (A) Original Image. (B) Good Contrast Enhancement (SMO = 1.6391). (C) Unnatural Contrast
Enhancement (SMO = 2.1496).
The examples in Figure 10 and Figure 11 show that SMO is unable to indicate if the image has been well enhanced or unnaturally enhanced. Notice that the SMO of Figure 11(b) is a well enhanced contrast image has SMO = 1.6391 while Figure 10(c) is suffers from unnatural contrast enhancement has SMO = 1.515. Due to the result obtained, high structural change is supposed to give higher rate. The SMO quality is defined as:
Equation (4) compute the edge based on the Sobel Operator where S1 and S2 is the row and column mask.
Equation (6) compute the standard deviation of image by taking the value of mean intensity, is computed as in (5).
Equation (7) compute the entropy of image pixel. Where I represent the index of the intensity level, p denotes the probability of the ith intensity, and n is the number of intensity levels in the window.
Equation (8) compute the non-homogeneity value of pixel (i,j).
Equation (9) compute the structure difference (SD) between the original and enhanced version.
Equation (10) compute the relative structure change of the enhanced image to the original image, SMO.
4.3 Statistical Naturalness Measure (SNM)
The SNM is proposed by [41] to design an algorithm based on the contrast and intensity attribute. The SMO claimed to measure the naturalness by taking the distribution of contrast and intensity based on the collection of 3,000 of 8bits/pixel grayscale image with different types of natural scenery. Rating of SNM is in bound between 0 and 1, where 0 indicate low naturalness and 1 indicate high naturalness level. For SNM evaluation, only result from contrast take into consideration. Figure 12 and Figure 13 show sample of test image tested with SNM.
Figure 12 (A) Original Image (Pd = 0.7512). (B) Good
Contrast Enhancement (Pd = 0.8597). (C) Unnatural
Contrast Enhancement (Pd = 0.0052).
Unnatural contrast
(a) (b) (c)
Unnatural contrast
(a) (b) (c)
(4)
(5)
(6)
(7)
(8)
(9)
(10)
Unnatural contrast
ISSN: 1992-8645 www.jatit.org E-ISSN: 1817-3195
Figure 13 (A) Original Image (Pd = 0.5337). (B) Good
Contrast Enhancement (Pd = 0.8252). (C) Unnatural
Contrast Enhancement (Pd = 0.2017).
Since the objective of this paper is to detect the presence of unnatural contrast in enhanced image, thus, for SNM, the evaluation is focus to collect the rating given by contrast distribution only. The contrast quality denote as, Pd is chosen in order to identify either the contrast quality able have good correlation with human visual perception. About 100 test images consist of three contrast level (poor, good and unnatural contrast) were used to test the contrast quality, Pd. result obtained shows that most of good contrast image always give highest rating compared to rating for poor and unnatural contrast image. Sample of result shown in Figure 12(b) where the contrast quality, Pd = 0.8597 and Figure 13 (b) with contrast quality, Pd = 0.8252. However, the problem detected when same image content with different spatial resolution tested as shown in Figure 14.
[image:6.612.99.284.93.217.2]
Figure 14 Image Of Good Contrast With Different
Spatial Resolution. (A) Low Resolution (Pd = 0.9980)
And High Resolution (Pd = 0.5302). (B) Low Resolution
(Pd = 0.5859) And High Resolution (Pd = 0.9308).
5. CONCLUSION
Contrast enhancement may cause problems, such as noise artifacts, loss of details, excessive brightness change and unnatural enhancement. IQA is one of the solution to be able design an algorithm to measure the annoyance of the distortion consistent with human visual perception. With that, the contrast enhancement
algorithm can automatically assess the image by finding parameter to achieve best result. Existing IQA to overcome mentioned problem after contrast enhancement are Edge-Based, Entropy and AMBE respectively except for unnatural contrast enhancement. The preliminary findings to detect the presence of unnatural contrast enhancement shows that LOE and SMO may give inconsistent in the rating. While the contrast rating in SNM, almost give promising rating to solve the problem. However, notice there are some inconsistent rating given by contrast quality when applied on the different spatial resolution.
REFERENCES:
[1] Gonzales R.C. and R.E. Woods, “Digital Imaging Process”, Prentice Hall, New Jersey, 2002.
[2] Shapiro L.G. and C.G.Stockman, “Computer Vision” Prentice Hall, New Jersey, 2001. [3] Zhou Wang and Alan C. Bovik, “Why is Image
Quality Assessment so Difficult” Institute of Electrical and Electronics Engineers, 2002. [4] C.Sasi Varnan, A.Jagan, Jaspreet Kaur, Divya
Jyoti, Dr.D.S.Rao, “Image Quality Assessment Techniques on Spatial Domain” International
Journal Computer Science and Technology,
(Vol. 2, Issue 3), September 2011.
[5] Wang. Z., Simoncelli. E.P. and Bovik. A.C., “Multi-scale structural similarity for image quality assessment”, In: Proceedings of
Institute of Electrical and Electronics
Engineers Asilomar Conference on Signals, Systems, and Computers (Pacific Grove, CA), 2003,pp. 1398–1402.
[6] Z. Wang, A.C. Bovik, H.R. Sheikh, and E.P. Simoncelli, “Image quality assessment: From error visibility to structural similarity,”
Institute of Electrical and Electronics
EngineersTrans. Image Process,(Vol. 13, no. 4), pp. 600– 612, April 2004.
[7] H.R. Sheikh, A.C. Bovik, G. de Veciana, “An information fidelity criterion for image quality assessment using natural scene statistics”, 2005, pp. 2117–2128, .
[8] J. X. Pang, R. Zhang, H. Zhang, X. Huan and Z. K. Liu, “Image quality assessment metrics by using directional projection”, Chinese Optics Letters, 6 (7) 2008,491-494..
[9] Larson. E. C. and Chandler. D. M., “Most apparent distortion: full reference image quality assessment and the role of strategy”, J. Electron. Imaging, 19,2010,011006:1–21. Unnatural contrast
(a) (b) (c)
[image:6.612.99.289.490.568.2]ISSN: 1992-8645 www.jatit.org E-ISSN: 1817-3195 [10] Li. C. and Bovik. A. C., “Content partitioned
structural similarity index for image quality assessment”, 2011, 25, 517-526.
[11] Haddad, Zehira, Azeddine Beghdadi, Amina Serir, and Anissa Mokraoui. “Image quality assessment based on wave atoms transform”, In Image Processing (ICIP), 2010 17th IEEE International Conference,2010, pp. 305-308. [12] H.R. Sheikh, A.C. Bovik, G. de Veciana, “An
information fidelity criterion for image quality assessment using natural scene statistics”, IEEE Transaction Image Processing,14,2005, 2117–2128.
[13] Zhang. Lin., Zhang. Lei. Mou. X. and Zhang. D., “FSIM: A feature similarity index for image quality assessment”, IEEE Trans. Image
Process. 2011,20(8), 2378–2386.
[14] Nikvand. N and Wang. Z, “Image distortion analysis based on normalized perceptual information distance”, 2013, 7:403-410. [15] Gao, Xinbo, Wen Lu, Dacheng Tao, and
Xuelong Li. “Image quality assessment based on multiscale geometric analysis”, Image Processing, IEEE Transactions, Vol.7, 2009, 1409-1423.
[16] Tao, Dacheng, Xuelong Li, Wen Lu, and Xinbo Gao. “Reduced-reference IQA in contourlet domain”, Systems, Man, and Cybernetics, Part B: Cybernetics, IEEE Transactions, Vol. 6 ,2009, 1623-1627. [17] Constantin, Joseph, Samuel Delepoulle, Andre
Bigand, and Christophe Renaud. “Reduced reference quality assessment of computer-generated images based on RVM”, In Communications and Information Technology (ICCIT), 2013 Third International Conference, 2013, pp. 320-324.
[18] Anish Mittal, Rajiv Soundarajan and Alan C. Bovik. “Making a “Completely Blind” Image Quality Analyzer”, IEEE Signal Processing Letters, Vol. 29, No. 3, March 2013.
[19] Shen, Ji, Qin Li, and Gordon Erlebacher. “Curvelet based no-reference objective image Quality Assessment”, In Picture Coding Symposium, 2009, pp. 1-4.
[20] Gaata, Methaq, Sattar Sadkhn, and Saad Hasson. “No-reference quality metric based on fuzzy neural network for subjective image watermarking evaluation”, In Imaging Systems and Techniques (IST), 2012 IEEE International Conference ,2012,, pp. 315-320.
[21] A. A. Michelson, “Studies in Optics”, Chicago, IL: Univ. Chicago Press, 1927
[22] J. Tang, E. Peli, and S. Acton, “Image enhancement using a contrast measure in the compressed domain,” IEEE Signal Process. Lett., (Vol. 10, no. 10),Oct 2003, pp. 289–292. [23] Pelli, D. G., & Farell, B. “Why use noise?”,
Journal of the Optical Society of America A, 16, 647–653.
[24] Alessandro Rizzi, Gabriele Simone, Roberto Cordone. “A Modified Algorithm for Perceived Contrast Measure in Digital Images”
, CGIV 2008 and MCS’08, 2008
[25] Gabriele Simone, Marius Pedersen, Jon Yngve Hardeberg and Alessandro Rizzi. “Measuring Perceptual Contrast in a Multi-level Framework”, Electronic Imaging, 2009. [26] Mohan Liu and Patrick Ndjiki-Nya. “New
Perceptual-Based No-Reference Contrast Metric For Natural Images Based On Human Attention And Image Dynamic”, QoMEX, 2012.
[27] A. Rizzi, T. Algeri, G. Medeghini, and D. Marini “A proposal for contrast measure in digital images”, In CGIV 2004 – Second European Conference on Color in Graphics, Imaging and Vision, 2004.
[28] S. S. Agaian, K. Panetta, and A. Grigoryan, “Transform-based image enhancement algorithms with performance measure,” IEEE Transaction Image Processing, (Vol. 10, no. 3), March 2001,pp. 367–382.
[29] S. S. Agaian, K. Panetta, and A. M. Grigoryan, “A new measure of image enhancement,”,
IASTED Int. Conf. Signal Processing
Communication, Marbella, Spain, 2000.
[30] Karen A. Panetta, Fellow, IEEE, Eric J. Wharton, “Human Visual System-Based Image Enhancement and Logarithmic Contrast Measure”,IEEE Transaction on System, Man And Cybernetics-Part B : Cybernetics,2008 (Vol. 38, No.1).
[31] Michele A. Saad, Alan C. Bovik and Christophe charrierieee, “A DCT Statistics-Based Blind Image Quality Index”, Signal Processing letters,2010, (Vol. 17, no. 6). [32] Saad, Michele A., Alan C. Bovik, and
Christophe Charrier. “DCT statistics model-based blind image quality assessment”, In Image Processing (ICIP), 2011 18th IEEE International Conference , 2011, pp. 3093-3096.
ISSN: 1992-8645 www.jatit.org E-ISSN: 1817-3195 [34] Zhu, Xiang, and Peyman Milanfar “A
no-reference image content metric and its application to denoising”, In Image Processing
(ICIP), 2010 17th IEEE International
Conference, 2010, pp. 1145-1148.
[35] R. Eslami and H. Radha, “New image transforms using hybrid wavelets and directional filter banks: Analysis and design,” Proc. IEEE Int. Conf. Image Processing, Genova, Italy, 2005, pp. 11–14.
[36] E. Wharton, S. Agaian, K Panetta, “Comparative Study of Logarithmic Enhancement Algorithms with Performance Measure,” ,2006, San Jose, 17 January 2006. [37] Jaya V.L. and R. Gopikakumari, “
International Journal of Computer
Applications (Vol. 79), October, 2013.
[38] S.-D. Chen, “A new image quality measure for assessment of histogram equalization-based contrast enhancement techniques”, Digital Signal Process, 2012.
[39] Shuhang Wang, Jin Zheng, Hai-Miao Hu, And Bo Li, “Naturalness Preserved Enhancement Algorithm For Non-Uniform Illumination Images”, IEEE Transaction Image Processing, (Vol.22), 2013.
[40] H. D. Cheng and Yingtao Zhang, “Detecting of Contrast Over Enhancement ”, ICIP 2012 [41] Hojatollah Yeganeh, and Zhou Wang,