International Journal of Emerging Technology and Advanced Engineering
Website: www.ijetae.com (ISSN 2250-2459,ISO 9001:2008 Certified Journal, Volume 3, Issue 9, September 2013)
24
Mathematical Modeling and Digital Simulation of PV Solar
Panel using MATLAB Software
MBOUMBOUE Edouard
1, Donatien NJOMO
21,2Environmental Energy Technologies Laboratory (EETL)/Department of Physics/Faculty of Science/University of Yaounde
1/ P.O. Box 812 Yaounde-Cameroon
Abstract— Global warming, exhaustion and high cost of
fossil fuels dictates the exploitation of alternative sources of energy such as wind and solar energies. In addition, knowledge of the characteristic of photovoltaic (PV) panel is a prerequisite for designing and dimensioning a PV power supply. This is the reason for the development of PV panel models useful for electrical applications. This approach allows the development of new high-performances conversion systems balancing system-components and permitting the evaluation of the behavior of the entire system in various scenarios. In this paper we propose a simple method of modeling and simulation of photovoltaic panels using MATLAB software package. The method is used to determine the characteristic of PV panel and to study the influence of different values of solar radiation at different temperatures concerning performance of PV cells. Taking the effect of irradiance and temperature into consideration, the output current and power characteristic of photovoltaic module are simulated using the proposed model. Detailed modeling procedure for the circuit model is presented. The proposed model was found to be better and accurate for any irradiance and temperature variations. The proposed model can be very useful for PV Engineers, researchers and experts who require a simple, fast and accurate PV simulator to design their systems.
Keywords— Digital simulation, Electrical characteristics, Mathematical modeling, MATLAB software, PV cell/panel, Renewable energy.
I. INTRODUCTION
Energy is an essential ingredient for socio-economic development and economic growth. Energy is critical to achieving virtually all the Millennium Development Goals [1]. Whether it is electricity for schools or clinics, energy for the delivery of health, education and sanitation, services, clean fuel to reduce indoor pollution, energy for pumping water or heat for cooking food and boiling water, energy in all its forms will be required to achieve these ends. Currently a high proportion of the world‘s total energy output is generated from fossil fuels such as oil and coal.
In general, the quest for an option to conventional power schemes for extension to remote and rural locations of developing countries arises from the high costs associated with the extensions, as well as the maintenance of the power grid system to rural areas. The costs of grid extensions will vary widely from country to country and will be heavily dependent on the system used, the length of connection required the type of topography, the usage pattern and the load factor of the supply point [11].
The dispersed character of rural populations and their low commercial energy consumption result in poor capacity utilization efficiency for transmission and distribution systems and other energy infrastructure [5]. More specifically, the close relationship between the proximity of energy resources to the potential users coupled with the high cost of conventional energy sources have led to a considerable interest in the development and application of renewable energy resources. Although research and development activities are still being seriously undertaken in various aspects of renewable energy utilizations, a number of the technologies have since been shown to be feasible and ready, for adoption into the economy [15]. Globally, current patterns of energy consumption are polluting and unsustainable, and are characterized by inequity in consumption and access [12]. With world economic development and growing demand for energy, the conventional energy sources have become increasingly unable to meet the world demand for the energy [15]. Finding appropriate energy solutions that will fuel economic growth and increase social equity is essential.
International Journal of Emerging Technology and Advanced Engineering
Website: www.ijetae.com (ISSN 2250-2459,ISO 9001:2008 Certified Journal, Volume 3, Issue 9, September 2013)
25
Photovoltaic energy system has gained wide popularity in the past decade as one of the renewable energy sources due to the possibility of depletion of conventional energy sources and its high cost as well as its negative effects on the environment. Solar energy is a source of interesting energy; it is renewable, inexhaustible and non-polluting and it is more and more intensively used as energy sources in various applications such as water pumping, street lighting in rural town, battery charging and grid connected PV systems [2, 3, 15].
Therefore, solar energy could be one of the significant sources as an alternative energy for the future. In regard to endless importance of solar energy, it is worth saying that photovoltaic energy is a best prospective solution for energy crisis.
However, key issues like intermittency in supply, resource location and cost of renewable energy materials are the main roadblocks preventing it from entering the mainstream energy. At this level, producers, policy makers and governments have an important role to play in addressing the challenges associated with the development of renewable energy.
Our work is structured around three main parts. Firstly, an overview of PV systems is summarized. In the second part, the mathematical model suggested is presented. Finally in section three, we present and discuss the results obtained by simulation using MATLAB software.
II. PHOTOVOLTAIC SYSTEM OVERVIEW
The word ‗photovoltaic‘ consists of the two words, photo and Volta. Photo stands for light (Greek phõs, photós: light) and Volta (Count Volta, 1745–1827, Italian physicist) is the unit of the electrical voltage. In other words, photovoltaic means the direct conversion of sunlight to electricity. The common abbreviation for photovoltaic is PV. The history of photovoltaic goes back to the year 1839, when Becquerel discovered the photo effect, but in that century the technology was not available to exploit this discovery [6, 8].
II.1. Photovoltaic cell
PV cells have been made with silicon (Si), gallium arsenide (GaAs), copper indium diselenide (CIS), cadmium telluride (CdTe), and a few other materials. The common denominator of PV cells is that a p–n junction, or the equivalent, such as a Schottky junction, is needed to enable the photovoltaic effect [15]. Understanding the p–n junction is thus at the heart of understanding how a PV cell converts sunlight into electricity.
[image:2.612.327.562.276.404.2]Photons of light with energy higher than the band-gap energy of PV material can make electrons in the material break free from atoms that hold them and create hole-electron pairs, as shown in Figure (1). These hole-electrons, however, will soon fall back into holes causing charge carriers to disappear. If a nearby electric field is provided, those in the conduction band can be continuously swept away from holes toward a metallic contact where they will emerge as an electric current. The electric field within the semiconductor itself at the junction between two regions of crystals of different type, called a p-n junction [4, 8].
Fig. 1: Illustration of the p-n junction of PV cell [4, 8]
The PV cell has electrical contacts on its top and bottom to capture the electrons, as shown in Figure (2). When the PV cell delivers power to the load, the electrons flow out of the n-side into the connecting wire, through the load, and back to the p-side where they recombine with holes [13]. Note that conventional current flows in the opposite direction from electrons.
Fig.2: Illustrated side view of solar cell and the conducting current [4, 8]
II.2. Photovoltaic module/array
[image:2.612.324.561.517.643.2]International Journal of Emerging Technology and Advanced Engineering
Website: www.ijetae.com (ISSN 2250-2459,ISO 9001:2008 Certified Journal, Volume 3, Issue 9, September 2013)
26
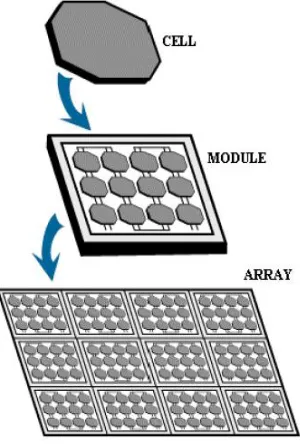
[image:3.612.333.564.144.287.2]The power produced by a single module is seldom enough for commercial use, so modules are connected to form array to supply the load. The connection of the modules in an array is same as that of cells in a module. Modules can also be connected in series to get an increased voltage or in parallel to get an increased current.
Fig.3: Photovoltaic Hierarchy [16]
III. MATHEMATICAL MODELING OF PV MODULE
[image:3.612.94.244.214.437.2]A solar cell is the building block of a solar panel. A photovoltaic module is formed by connecting many solar cells in series and parallel. Considering only a single solar cell; it can be modeled by utilizing a current source, a diode and two resistors. This model is known as a single diode model of solar cell. Two diode models are also available but only single diode model is considered here [4, 7, 9, 13, 18, 19, 21, 30]. The same modeling technique is also applicable for modeling a PV module. The equivalent electric circuit diagram of PV cell is shown in Fig. 4, which consists of a photocurrent source, a diode, a parallel resistor also called shunt resistor (Rsh) expressing a leakage current and a series resistor (Rs) describing internal resistance to the current flow [20-21].
Fig. 4: General model of PV cell in a single diode model
The PV cell‘s electrical characteristic under solar irradiance (S) is given in terms of PV cell output current (I) and PV cell voltage (V). Refers to figure 4 and based on the first law of Kirchhoff, the basic equations which describing electrical characteristics of the PV cell model, can be elaborated through the following set equations [2, 19, 21, 22, 23, 24, 25, 31]:
III.1. Ideal solar cell model
An ideal solar cell can be represented by a current source connected in parallel with a rectifying diode, as shown in the equivalent circuit of Figure 4. The corresponding I-V characteristic is described by the Shockley solar cell equation [2]:
(
) (1)
III.2. Solar cell characteristics in practice
The I-V characteristic of a solar cell in practice usually differs to some extent from the ideal characteristic (1). The solar cell (or circuit) may also contain series (Rs) and parallel (or shunt, Rsh) resistances, leading to a characteristic of the form:
(2)
Where:
[ ( )] ( ) (3)
International Journal of Emerging Technology and Advanced Engineering
Website: www.ijetae.com (ISSN 2250-2459,ISO 9001:2008 Certified Journal, Volume 3, Issue 9, September 2013)
27
( ) *
( )+ (5)
(6)
(7)
( ) (8)
and (9)
(10)
Then; * ( ) + (11)
III.3. PV module and array model Practically speaking, the output power of single solar cell is not strong enough to apply for almost any application. So in order to increase the capability of overall PV systems, the cells should be configured in series and parallel features. If we consider Np as the number of cells connected in parallel and Ns as the number of cells connected in series, the relationship between the output current and voltage is given by [21, 25]: (12)
(13)
(14)
(15)
Equation (11) can be express as bellow: { [ ( ) ( ) ] } (16)
{ [ ( ) ( ) ] } (17)
This expression describes the electrical behavior and determines the relationship between voltage and current supplied by a photovoltaic module. It is a non-linear mathematical equation whose parameters are defined bellow. For ideal condition, Rs is very small (Rs = 0) and Rsh is very large (Rsh = ∞) [21], therefore: , * ( ) ( )+ - (18)
[image:4.612.48.248.135.333.2]The equivalent circuit for the solar module arranged in Np parallel and Ns series is shown in Figure 5.
Fig. 5: Equivalent circuit model of generalized PV [22-23]
[image:4.612.329.568.206.337.2]The ideality factor (n) is dependent on PV technology and is listed in Table 1.
Table 1
Factor n dependence on PV technology [22-23]
Technology n
Si-mono 1.2
Si-poly 1.3
a-Si:H 1.8
a-Si:H tandem 3.3
a-Si:H triple 5
CdTe 1.5
CIS 1.5
[image:4.612.333.556.388.577.2]AsGa 1.3
Table 2
The parameters Eg0, α and β in Equation (6), [2]
Eg(T=0K), eV α x 10-4, eV/K2 β, K
Si 1.17 4.730 636
AsGa 1.52 5.405 204
InP 1.42 4.906 327
IV. SIMULATION RESULTS AND DISCUSSION
International Journal of Emerging Technology and Advanced Engineering
Website: www.ijetae.com (ISSN 2250-2459,ISO 9001:2008 Certified Journal, Volume 3, Issue 9, September 2013)
28
[image:5.612.333.556.141.339.2]This information is enough to build a simple model of the PV module to test power converters, but for a more accurate model more information is required. The power delivered by a PV cell attains a maximum value at the points (Imp; Vmp). These remarkable points at STC (AM=1.5; T=25C; S=1000 W/m2) are shown in Figures (6, 7, 8).
[image:5.612.64.268.227.394.2]Fig. 6: I-V curve adjusted to three remarkable points at STC
Fig. 7: P-V curve adjusted to three remarkable points at STC
Fig. 8: P-I curve adjusted to three remarkable points at STC
IV.1. Effect of variation of solar irradiance
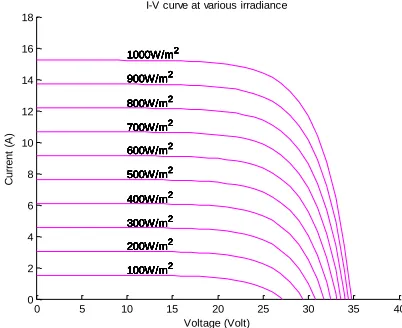
In this model, irradiance (S) in W/m2 is a vector of value [100 200 300 400 500 600 700 800 900 1000] at constant temperature (25C). It will be represented an I-V characteristic curve for each irradiance value in the same graph, as shown in Figure 9. The same goes for the P-V and P-I curves in Figure 10 and in Figure 11 respectively.
Fig. 9: I-V curve at various irradiance and constant temperature
0 5 10 15 20 25 30 35 40
0 2 4 6 8 10 12 14 16 18 20 Voltage (Volt) C u rr e n t (A )
Remarkable points of the I-V curve at STC
V: 0 I: 15 V: 28.2 I: 13.2 V: 35.2 I: 0 Isc (Vmp, Imp) Voc
0 5 10 15 20 25 30 35 40
0 50 100 150 200 250 300 350 400 V: 0 P: 0 Voltage (Volt) P o w e r (W )
Remarkable points of the P-V curve at STC
V: 28 P: 373 V: 35.2 P: 0 Pmp Voc
0 2 4 6 8 10 12 14 16 18 20
0 50 100 150 200 250 300 350 400 I: 0 P: 0 Current (A) P o w e r (W )
Remarkable points of the P-I curve at STC
I: 13.5 P: 373 I: 15 P: 0 Pmp Isc
0 5 10 15 20 25 30 35 40
0 2 4 6 8 10 12 14 16 18 Voltage (Volt) C u rr e n t (A )
I-V curve at various irradiance
[image:5.612.339.540.459.623.2]International Journal of Emerging Technology and Advanced Engineering
Website: www.ijetae.com (ISSN 2250-2459,ISO 9001:2008 Certified Journal, Volume 3, Issue 9, September 2013)
29
[image:6.612.61.279.348.529.2]Fig. 10: P-V curve at various irradiance and constant temperature
Fig. 11: P-I curve at various irradiance and constant temperature
Based on Figures (9, 10, 11), it‘s clear that the I-V, P-V and P-I characteristics of a solar cell/module are highly dependent on the solar irradiance values. At constant module temperature, we note that with increase of solar irradiance, the increase in short-circuit current and in maximum power output of the PV module is much larger than the increase in the open circuit voltage. The reason is that the open-circuit voltage (Voc) is logarithmically dependent on the solar irradiance, yet the short-circuit current (Isc) is a linear function of the illumination (equations 3 & 18), [30].
IV.2. Effect of variation of temperature
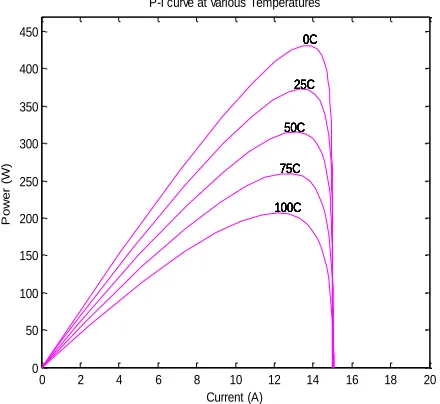
The temperature (T) in degree C is a vector of value [0 25 50 75 100] at constant irradiance value (1000 W/m2). It will be represented an I-V, P-V and P-I characteristic curves for each temperature value in the same graph, as shown in Figures (12- 14).
Fig. 12: I-V curve at various temperature and constant irradiance
Fig. 13: P-V curve at various temperature and constant irradiance
0 5 10 15 20 25 30 35 40
0 50 100 150 200 250 300 350 400 Voltage (Volt) P o w e r (W )
P-V curve at various irradiance
1000W/m2 900W/m2 800W/m2 700W/m2 600W/m2 500W/m2 400W/m2 300W/m2 200W/m2 100W/m2 1000W/m2 900W/m2 800W/m2 700W/m2 600W/m2 500W/m2 400W/m2 300W/m2 200W/m2 100W/m2 1000W/m2 900W/m2 800W/m2 700W/m2 600W/m2 500W/m2 400W/m2 300W/m2 200W/m2 100W/m2 1000W/m2 900W/m2 800W/m2 700W/m2 600W/m2 500W/m2 400W/m2 300W/m2 200W/m2 100W/m2 1000W/m2 900W/m2 800W/m2 700W/m2 600W/m2 500W/m2 400W/m2 300W/m2 200W/m2 100W/m2 1000W/m2 900W/m2 800W/m2 700W/m2 600W/m2 500W/m2 400W/m2 300W/m2 200W/m2 100W/m2 1000W/m2 900W/m2 800W/m2 700W/m2 600W/m2 500W/m2 400W/m2 300W/m2 200W/m2 100W/m2 1000W/m2 900W/m2 800W/m2 700W/m2 600W/m2 500W/m2 400W/m2 300W/m2 200W/m2 100W/m2 1000W/m2 900W/m2 800W/m2 700W/m2 600W/m2 500W/m2 400W/m2 300W/m2 200W/m2 100W/m2 1000W/m2 900W/m2 800W/m2 700W/m2 600W/m2 500W/m2 400W/m2 300W/m2 200W/m2 100W/m2
0 2 4 6 8 10 12 14 16 18 20
0 50 100 150 200 250 300 350 400 Current (A) P o w e r (W )
P-I curve at various irradiance
1000W/m2 900W/m2 800W/m2 700W/m2 600W/m2 500W/m2 400W/m2 300W/m2 200W/m2 100W/m2 1000W/m2 900W/m2 800W/m2 700W/m2 600W/m2 500W/m2 400W/m2 300W/m2 200W/m2 100W/m2 1000W/m2 900W/m2 800W/m2 700W/m2 600W/m2 500W/m2 400W/m2 300W/m2 200W/m2 100W/m2 1000W/m2 900W/m2 800W/m2 700W/m2 600W/m2 500W/m2 400W/m2 300W/m2 200W/m2 100W/m2 1000W/m2 900W/m2 800W/m2 700W/m2 600W/m2 500W/m2 400W/m2 300W/m2 200W/m2 100W/m2 1000W/m2 900W/m2 800W/m2 700W/m2 600W/m2 500W/m2 400W/m2 300W/m2 200W/m2 100W/m2 1000W/m2 900W/m2 800W/m2 700W/m2 600W/m2 500W/m2 400W/m2 300W/m2 200W/m2 100W/m2 1000W/m2 900W/m2 800W/m2 700W/m2 600W/m2 500W/m2 400W/m2 300W/m2 200W/m2 100W/m2 1000W/m2 900W/m2 800W/m2 700W/m2 600W/m2 500W/m2 400W/m2 300W/m2 200W/m2 100W/m2 1000W/m2 900W/m2 800W/m2 700W/m2 600W/m2 500W/m2 400W/m2 300W/m2 200W/m2 100W/m2
0 5 10 15 20 25 30 35 40
0 2 4 6 8 10 12 14 16 18 Voltage (Volt) C u rr e n t (A )
I-V curve at various Temperatures
0C 25C 50C 75C
100C 75C 50C 25C 0C 100C 75C 50C 25C 0C 100C 75C 50C 25C 0C 100C 75C 50C 25C 0C 100C
0 5 10 15 20 25 30 35 40
0 50 100 150 200 250 300 350 400 450 Voltage (Volt) P o w e r (W )
P-V curve at various Temperatures
International Journal of Emerging Technology and Advanced Engineering
Website: www.ijetae.com (ISSN 2250-2459,ISO 9001:2008 Certified Journal, Volume 3, Issue 9, September 2013)
[image:7.612.60.280.143.345.2]30
Fig. 14: P-I curve at various temperature and constant irradiance
Contrary to the influence of the solar irradiance, the increase in the temperature around the solar cell/module has a negative impact on the power generation capability. Increase in temperature at constant irradiance is accompanied by a decrease in the open circuit voltage value as shown in figures 12 & 13. In the same way we observe the significant reduction of the power output of the photovoltaic system. This relationship is clearly depicted in Figures (13 & 14) where the power is plotted as a function of voltage and current for five different temperature values. Increase in temperature causes increase in the band gap of the material and thus more energy is required to cross this barrier. Thus the efficiency of the solar cell is reduced [7, 18, 22]. Globally, these phenomena clearly illustrated that the output characteristics of a PV cell/module are non-linear and are crucially influenced by solar radiation S and operating cell temperature T.
V. CONCLUSION
Photovoltaic solar plays an important role in the renewable energy domain. With the growing PV sector, it has become crucial to focus on the power conditioning for PV solar. The power conditioning unit required for a PV solar system depends upon the scale of deployment, requirements such as efficiency, reliability, flexibility and control. A Matlab software model for the PV solar cell, module and array was developed and presented in this paper.
The proposed model takes sunlight irradiance and cell temperature as input parameters and outputs the current and the voltage under various conditions. This model is based on the fundamental circuit equations of a PV solar cell taking into account the effects of physical and environmental parameters such as the solar radiation and cell temperature. The electrical characteristics (I-V, P-V and P-I curves), we obtained from the simulation of PV cell/module designed in MATLAB environment explains clearly its dependence on the solar irradiance and operating cell temperature. This model can be used for the study in the field of photovoltaic solar system. This paper can thus, be very useful for researchers or PV Engineers to easily and quickly determine the performance of any photovoltaic systems.
NOMENCLATURE
AsGa: Gallium Arsenide; a-Si: Amorphous-Silicon; CdTe: Cadmium Telluride ; CIS: Copper indium diselenide ;
Eg: Band gap energy of the semiconductor (eV);
Eg0: Band gap energy at T=0K (eV);
I: Cell output current (A); I0,final: Final value of I0 (A);
I0: Dark saturation current (the diode leakage current
density in the absence of light) (A); Id: Diode current (A);
Imp: Current at the maximum-power point (A);
Io,r: Cell‘s short circuit current at STC (2.10-5 A);
Iph,final: Final value of Iph (A);
Iph: Light-generated current or photocurrent (A);
ISC: Short-circuit current (A);
Iscr: Short circuit current at reference temperature (3.75 A);
Ish: Current through the shunt resistance (A);
k: Boltzmann‘s constant (1.38 × 10⁻²³
J/K);
Ki : Cell‘s short-circuit current temperature coefficient
(A/K);
MATLAB : MATrix LABoratory;
n : Ideality factor (a number between 1 and 2 that typically increases as the current decreases);
nfinal: Final value of n;
Np: number of cells connected in parallel;
Ns: number of cells connected in series;
P: Power (W);
Pmp: Power at the maximum-power point (W);
PV: Photovoltaic;
q: Electron charge (1.602 × 10⁻¹⁹ C); Rs,final: Final value of Rs (Ω);
0 2 4 6 8 10 12 14 16 18 20
0 50 100 150 200 250 300 350 400 450
Current (A)
P
o
w
e
r
(W
)
P-I curve at various Temperatures
0C
25C
50C
75C
100C 0C
25C
50C
75C
100C 0C
25C
50C
75C
100C 0C
25C
50C
75C
100C 0C
25C
50C
75C
International Journal of Emerging Technology and Advanced Engineering
Website: www.ijetae.com (ISSN 2250-2459,ISO 9001:2008 Certified Journal, Volume 3, Issue 9, September 2013)
31
Rs: Series resistance of cell (Ω);
Rsh: Shunt resistance of cell (Ω);
S: Solar irradiance (W/m2); Si : Silicon;
Si-mono: Monocristalline-Silicon; Si-poly: Polycrystalline-Silicon;
Sr : Reference solar radiation (1000 W/m2);
STC: Standard Test Condition (AM=1.5; T=25C; S=1000 W/m2);
T: Cell working temperature (K);
Tr: Cell‘s reference temperature in degree k
Tr1: Cell‘s reference temperature in degree Fahrenheit (40);
V: Cell output voltage (Volt); Vd: Diode voltage (Volt);
Vmp: Voltage at the maximum-power point (Volt);
VOC: Open-circuit voltage (Volt);
Vt: Thermal junction voltage (mV);
α, β: Parameters which define Band gap energy of the semiconductor (eV/K2, K).
Acknowledgements
The authors would like to thank Dr. OBOUNOU Marcel and Mr. NGOUMBE Zacharie by the support of this work.
REFERENCES
[1] Brundtland, G. (1987), « Notre avenir à tous », Rapport Brundtland, Oxford University press, 1987.
[2] Markvart, T. and Castaner, L., (2003), "Practical Handbook of Photovoltaics, Fundamentals and Applications" Elsevier, 2003. [3] R. Messenger and J. Ventre, "Photovoltaic Systems Engineering",
Second Edition, CRC PRESS, 2005.
[4] Akihiro Oi, ―Design and simulation of photovoltaic water pumping system,‖ A thesis presented to the Faculty of California Polytechnic State University, San Luis Obispo, pp. 5-36, September, 2005. [5] Goldemberg, J. (2000). ―Rural Energy in Developing Countries
World Energy Assessment: Energy and the Challenges of Sustainability‖. World Bank, New York, 2000.
[6] Volker Quaschning, 2005, ―Understanding Renewable Energy Systems‖, Earthscan, 2005.
[7] Ramos Hernanz, J.A; Campayo Martin,J.J; Zamora Belver,I; Larranaga Lesaka, J.; Zulueta Guerrero,E; Puelles Perez, E ―Modeling of photovoltaic module‖ International Conference on renewable Energies and Power Quality (ICRERPQ‘10), Granada (Spain), 23th to 25th March, 2010.
[8] A.M.K. El-Ghonemy, 2012, ―Photovoltaic Solar Energy: Review‖, International Journal of Scientific & Engineering Research, Volume 3, Issue 11, ISSN 2229-5518, November-2012.
[9] S. Sheik Mohammed, (2011), ―Modeling and Simulation of Photovoltaic module using MATLAB/Simulink‖, International Journal of Chemical and Environmental Engineering, Volume 2, No.5, pp. 350-355, October 2011.
[10] Walker, Geoff R. ―Evaluating MPPT Converter Topologies Using a MATLAB PV Model‖, Australasian Universities Power Engineering Conference, AUPEC ‗00, Brisbane, 2000.
[11] Charters, W.W.S. (1985). Solar and Wind Power Technologies for Remote Applications. Technical Publication Services No. 187, Common Wealth Science Council, New York, 1985.
[12] NKUE et NJOMO (2009), « Analyse du système énergétique camerounais dans une perspective de développement soutenable », Revue de l‘énergie, vol. 588, pp. 102-116, Mars-Avril 2009. [13] Marcelo Gradella Villalva, Jonas Rafael Gazoli, and Ernesto Ruppert
Filho ―Modeling and circuit-based simulation of photovoltaic arrays‖ 10th Brazilian Power Electronics Conference (COBEP), 2009.
[14] G. Walker, ―Evaluating MPPT converter topologies using a Matlab PV model‖, Journal of Electrical & Electronics Engineering, Australia, Vol.21, No. 1, pp. 49-56, 2001.
[15] Frank kreith, D. Yogi Goswami, 2007, ―Handbook of Energy Efficiency and Renewable Energy‖, CRC Press, 2007.
[16] Mba E.F., Chukwuneke J.L., Achebe C.H., Okolie P.C., (2012), ―Modeling and Simulation of a Photovoltaic Powered Vapour Compression Refrigeration System‖, Journal of Information Engineering and Applications, ISSN 2224-5782 (print) ISSN 2225-0506 (online) Vol 2, No.10, 2012.
[17] Duffle, J.A., & Beckman, W.A. (1991), ―Solar Engineering of Thermal Processes‖, John Wiley & Sons, Inc, 1991.
[18] Saurav Satpathy, (2012), ―Photovoltaic power control using MPPT and boost converter‖, Bachelor Thesis of Technology in Electrical Engineering, National Institute of Technology, Rourkela, May 2012. [19] N. Pandiarajan and Ranganath Muthu, (2011), ―Mathematical Modeling of Photovoltaic Module with Simulink‖, International Conference on Electrical Energy Systems (ICEES 2011), pp. 314-319, 3-5 Jan 2011.
[20] WENHAM, S.R., GREEN, M.A., WATT, M.E., CORKISH, R., (2007), ―Applied photovoltaics‖. Earthscan, London, 2007. [21] Dani Rusirawan, (2012), ―Energetic modeling of photovoltaic
modules in grid-connected systems‖, Ph.D Dissertation, SZENT ISTVÁN UNIVERSITY, Gödöllő-Hungary, 2012.
[22] Huan-Liang Tsai, Ci-Siang Tu, and Yi-Jie Su, Member, IAENG, (2008) ―Development of Generalized Photovoltaic Model Using MATLAB/SIMULINK‖, Proceedings of the World Congress on Engineering and Computer Science, WCECS 2008, San Francisco-USA, pp. 1-6, October 22 - 24, 2008.
[23] Kinal Kachhiya, Makarand Lokhande, Mukesh Patel, (2011), ―MATLAB/Simulink Model of Solar PV Module and MPPT Algorithm‖, National Conference on Recent Trends in Engineering & Technology, B.V.M. Engineering College, V.V.Nagar,Gujarat-India, pp. 1-5, 13-14 May 2011.
[24] Olivier GERGAUD, (2002), « Modélisation énergétique et optimisation économique d'un système de production éolien et photovoltaïque couplé au réseau et associé à un accumulateur », Thèse de Doctorat, École Normale Supérieure de CACHAN, Décembre 2002.
[25] Mohamed Ansoumane CAMARA, (2011), « Modélisation du stockage de l‘énergie photovoltaïque par supercondensateurs », Thèse de Doctorat, Université Paris Est Créteil, Juillet 2011. [26] Andrew Knight, (2000), ―BASICS OF MATLAB and Beyond‖,
CRC Press LLC, 2000.
International Journal of Emerging Technology and Advanced Engineering
Website: www.ijetae.com (ISSN 2250-2459,ISO 9001:2008 Certified Journal, Volume 3, Issue 9, September 2013)
32
[28] The MathWorks, (2013), ―MATLAB® Graphics, R2013a‖, March
2013.
[29] Savita Nema, R.K.Nema, Gayatri Agnihotri, (2010), ―Matlab/simulink based study of photovoltaic cells/modules/array and their experimental verification‖, International Journal of Energy and Environment, Volume 1, Issue 3, pp.487-500, 2010.
[30] Nalika Ulapane, Sunil Abeyratne, Prabath Binduhewa, Chamari Dhanapala, Shyama Wickramasinghe, Nimal Rathnayake, (2012), ―A Simple Software Application for Simulating Commercially Available Solar Panels‖, International Journal of Soft Computing And Software Engineering (JSCSE), e-ISSN: 2251-7545, Vol.2,No.5, pp. 48-68, 2012.
![Fig. 1: Illustration of the p-n junction of PV cell [4, 8]](https://thumb-us.123doks.com/thumbv2/123dok_us/8725301.885261/2.612.324.561.517.643/fig-illustration-p-n-junction-pv-cell.webp)
![Fig. 5: Equivalent circuit model of generalized PV [22-23]](https://thumb-us.123doks.com/thumbv2/123dok_us/8725301.885261/4.612.48.248.135.333/fig-equivalent-circuit-model-generalized-pv.webp)