MAY-JUNE 2016, VOL-3/24 www.srjis.com Page 2391 A STUDY ON EMPLOYABILITY SKILLS AND WORK EFFICIENCY AMONG
SOFTWARE PROFESSIONALS IN CHENNAI
P. David Paul1 & M. V. Sudhakaran2, Ph. D. 1
Ph.D Research Scholar (Enrolment No. 7616), Manonmaniam Sundaranar University, Tirunelveli
2
Professor and Head, School of Social Sciences, Tamil Nadu Open University, Chennai
The present study on employability skills and work efficiency among software professionals in Chennai was conducted to probe the where the study variables viz., employability skills and work efficiency were related with each other or not. The study included a sample of 80 software professionals who were engineering graduates.The study showed a significant relationship the sub-dimensions of employability skills and the overall work efficiency scores. There was a significant relationship between the sub-dimensions of work efficiency with the overall score of employability skills. Significant relationship between the dimensions of work efficiency and the dimensions of employability skills were also established. The paper discusses the levels of employability skills and work efficiency of the respondents and the significant differences in the variables.
Introduction
Suitable employment commensurate with the individual’s skills and capabilities is a matter of
concern for the students, their parents, their educators as well as the government. What is
expected of the candidates by the employers are the readily transferrable skills that enable
them to perform the assigned job roles in an effective manner and also to manifest various
behavioural skills required according to each organization towards accomplishing the
common organizational goals. However, the current educational system does not pay much
attention to these transferable skills and the candidates are unable to apply their learning in
work environments. The job entrants have an array of skills that they may not be aware of
that are useful in the workplace. They need to recognise the skills that they already possess
and how these can be transferred to the workplace. Further, the employers are highly
concerned about the work output of their employees. The employees need to strike a balance Scholarly Research Journal's is licensed Based on a work at www.srjis.com
MAY-JUNE 2016, VOL-3/24 www.srjis.com Page 2392 between what is required of them in the industry and what they perform. The employees
towards work performance need to utilize all their transferable skills through which they have
to perform both in terms of quality and quantity. In the light of this situation, it was proposed
through the present study to undertake an assessment of the employability skills and work
efficiency of the young software professionals in Chennai City.
Employability Skills
Employability skill refers to a person’s ability as whether he or she has capabilities and
knowledge to get the job and maintain employment, and shift self-sufficiently if required. Employability according to international labour organization’s definition, it refers to individual “capable of combining experiences, capacities and needs, thus developing their
competencies to face the labour context; they recognize themselves as the builders of their
own paths identifying their own possibilities and difficulties, as well as those offered by their surrounding”
Employability skills are not usually discrete functions of work, although at time they can be.
They operate within and between work functions and underpin work and integrate the
different aspects of work. They are often not related to academic performance or technical
performance and are closer to emotional intelligence than to traditional nations of
intelligence. Employability skills are context-specific and cannot be accurately assessed away
from a specific application for example, working in a team cannot be assessed outside a team
engaged in meaningful work; problem-solving at work can’t be assessed outside a work
problem. They are not a package of skills, but operate in many different ways (Tilahun
Mengesha Afrassa, 2008).
What is more required is that, everyone needs the skills to be able to manage themselves at
work and between job, the learning that they need.Employability Skills, in and of themselves,
are not a new concept. They describe non-technical skills and competencies that have always
been an important part of effective and successful participation in the workplace. Enterprises
are increasingly asking for Employability Skills, and as a result learners and candidates for
assessment need to know what these skills are and how to demonstrate them.
Some of the important skills that the employers are concerned are as follows:
Communication skills: The one skill mentioned most often by employers is the ability to
MAY-JUNE 2016, VOL-3/24 www.srjis.com Page 2393 Team work: It is an ability to work in groups/ teams, communication well with the other
members and accomplishing the common goals through contributing effectively for the
success of the group.
Problem solving: It involves the ability to find solution to problem based on the available
resources and information, creativity reasoning ability etc. innovation problem-solving,
generating workable solutions, resolving complaints etc. are the skills which contribute to
productive outcomes.
Creative Thinking: It deals with one’s ability to assess a situation seek multiple
perspectives, gather more information based on the requirement and identify key issues that
need to be addressed.
Planning/Organizing: It deals with one’s ability to design plan, organize, setting
goals/targets and implement task within an allotted time frame.
Leadership: This area deals with the ability to take charge, delegate, manage and get the
thing done towards fulfillment of the organizational goals. Goal-driven, maintaining
productive work climate, confident, motivated, mobilizing, coaching employees to meet high
performance standards are outcome of this skill.
Self-Management: These skills give the employer “hints” as to whether or not one’s
personality will fit with that of the company, the bosses, employees, and customers.
Work Efficiency
Work efficiency is closely synonymous to Job performance. Most of the available literature
highlights the concepts of Job performance. Job performance is a commonly used, yet poorly
defined concept in industrial and organizational psychology, the branch of psychology that
deals with the workplace. It's also part of Human Resources Management. It most commonly
refers to whether a person performs their job well. Despite the confusion over how it should
be exactly defined, performance is an extremely important criterion that relates to
organizational outcomes and success. Among the most commonly accepted theories of job
performance comes from the work of John P. Campbell and colleagues. Coming from a
psychological perspective, Campbell describes job performance as an individual level
variable. That is, performance is something a single person does. This differentiates it from
more encompassing constructs such as organizational performance or national performance
MAY-JUNE 2016, VOL-3/24 www.srjis.com Page 2394 Characteristics of employees with high work efficiency
1. Develop goals and plans
2. Enhance communication among members
3. Develop and maintain positive relationships
4. Solve problems and make decisions on a timely basis
5. Successfully manage conflict
6. Facilitates productive meetings
7. Clarify roles for team members
8. Operate in a productive manner
9. Exhibit effective team leadership
10. Provide development opportunities for team members
Need and Importance of the Study
With the technological developments advancing very rapidly, software industry is one which
is highly flourishing with the intake of huge number of workforce.Though the software
professionals need to dispense their work related to their core competencies of software
development and testing, the other set of skills called employability skills are highly essential
to sustain and progress in their work place. Further, this industry pays highly commensurate
to the degree of skill the incumbent possesses. The employers are highly conscious of their
work efficiency which directly contributes to the productivity of self as well as the
organization. The assessment of the levels of work efficiency will enable the individual
employee as well as the employer to take appropriate action to level up the skills lacking so
that they turn out to be an asset to the organization rather than being a liability.
Therefore, with this backdrop of vital significance, the present study was undertaken.
Statement of the Problem
The present study seeks to assess the levels of employability skills and work efficiency
among software professionals in Chennai and probes to explore whether employability skills
and work efficiency are related with each other?
Objective of the Study
The present study is undertaken with the following objectives:
To assess the levels of employability skills of the software professionals
To evaluate the levels of work efficiency of the software professionals
To study the relationship between employability skills and work efficiency among
MAY-JUNE 2016, VOL-3/24 www.srjis.com Page 2395
To study the differences in employability skills and work efficiency of the software
professionals with regard to demographic variables
Research Design
The design adopted for the current research study is exploratory research design.
Hypotheses:
1. There will be no significant relationship between employability skills and wok
efficiency of the software professionals
2. There will be no significant relationship between the sub-dimensions of employability
skills with the overall work efficiency of the software professionals
3. There will be no significant relationship between the sub-dimensions of work
efficiency with the work overall employability skills of the software professionals
4. There will be no significant relationship between the sub-dimensions of
Employability Skills and sub-dimensions of Work Efficiency of the software
professionals
5. There will be no significant difference in the employability skills of the software
professionals based on the demographic variables.
6. There will be no significant difference in the work efficiency levels of the software
professionals based on the demographic variables.
Operational Definitions
Employability Skills
Employability refer to the level of readiness of an individual to take up a work which also
includes possession of the requisite skills, knowledge, attitudes and an understanding about
work environments in an organization that makes them to be productive and enables
achieving the organizational goals.
Work Efficiency
The ability to accomplish an entrusted responsibility adeptly with greater degree of precision
with in the specified time in a graceful manner.
Sample
The sample included for the purpose of conducting the present study comprised of the
MAY-JUNE 2016, VOL-3/24 www.srjis.com Page 2396 Size of Sample
The total number of respondents included for the study constituted 80 software professionals
who are presently working in 10 different software companies in Chennai. Among the total
respondents 50 were male and 30 were female.
Sampling Technique Adopted
In order to select the respondents for including as subjects in the present study, simple
random sampling technique was adopted.
Source of Sample
The respondents included in the present study were drawn from 10small software companies
(with not more than 25 employees) in Chennai who were working in their respective
companies for atleast two years and not below the age of 28 years.
Tools for Data Collection
For the purpose of the study, the following instruments were employed for collecting data
from the respondents:
Personal Data Sheet
Employability Skills Assessment Scale
Work Efficiency Assessment Schedule
Description of the Tools Used
1. Personal Data Sheet
For the purpose of collecting and recording personal and demographic related details of the
respondents the personal data sheet was prepared.
2. Employability Skills Assessment Scale
For assessing the employability skills of the respondents, the employability skills assessment
scale was developed. This scale has 44 test items grouped under nine different dimensions of
employability skills viz., Communication, Leadership, Creative Thinking, Planning and
Organising, Self-Management, Problem Solving, Team Work, Job Process Skills, and Time
Management. Each test item was provided with a three point scale for the subjects to indicate their responses as “I'm not as skilled as I'd like”, “I'm skilled” and “I'm very skilled”.
Scoring:
MAY-JUNE 2016, VOL-3/24 www.srjis.com Page 2397 item, a score of 3 was provided. However, these scores were reversed for item number 30
while scoring the responses.
Thus, the score for each test item was arrived at and the total of all the scores obtained in
respect of the 44 test items were added to derive the total employability skills score of a
respondent.
Interpretation
Higher the employability score indicated that the respondent possessed good employability
skills and a lesser score indicated that the employability skill of the respondent was poor.
Reliability
For the purpose the present study, the Employability Skills Assessment Scale developed by
the Researchers. Initially the tool was administered on 50 Engineering Graduates who were at
the verge of completing their studies and were about to venture into some gainful employment activity. The cronbach’s Alpha coefficient of Reliability was found to be 0.6.
However, for the purpose of the present study, the tool was pre-tested among 40software
professionals in Chennai who were possessing similar characteristics as the respondents of
the main study. Through this process, the rating scale was reduced to three points instead of a
five point rating scale due to the convenience of the respondents. Through this process, the reliability of the tool was established. The Cronbach’s Alpha Reliability Coefficient was
found to be 0.868 for the Employability Skills Assessment Scale after incorporating the
necessary changes after the pre-testing.
Validity
Face and content validity of the tool was established with the help of experts and practitioners
in the field who thoroughly scrutinized the tool and suggested modifications.
Work Efficiency Assessment Schedule
To assess the work efficiency of the respondents, the work efficiency assessment schedule
was formulated based on the job content along with the behaviourally anchored aspects at
work. Thus a total of 50 work performance and work behavior related items were included
under 6 different dimensions viz., Job knowledge, Job Performance, Devotion to Duty,
Sociability, Communication, and Managing Resources. For each item of assessment, a six
point rating scale was provided for the rater to objectively assess the level of the employee
being rated on the respective assessment items viz., excellent, very good, good, fair, poor and
MAY-JUNE 2016, VOL-3/24 www.srjis.com Page 2398 Scoring
For the purpose of scoring the ratings of the rater on the work efficiency assessment schedule,
the responses for excellent, very good, good, fair, poor and very poor were assigned scores of
6, 5, 4, 3, 2, and 1 respectively. These scores were totaled for each of the six dimensions
separately to obtain the rating for that respective dimension and the total score of all the
dimensions were added up to obtain the overall work efficiency score in respect of an
employee being rated.
Interpretation
Higher the score on the work efficiency assessment schedule indicated that the efficiency of
work performance is also higher and vice-versa.
Work Efficiency Score Interpretation
50-91 Very Poor Work Efficiency
92-133 Poor Work Efficiency
134-175 Fair Work Efficiency
176-217 Moderate Work Efficiency
218-259 Good Work Efficiency
260-300 Very Good Work Efficiency
260-300 Excellent Work Efficiency
Reliability
Based on the pilot testing with 40 software professionals, the reliability of the tool was
established as follows:
Dimension Cronbach’s Alpha Coefficient
of Reliability
Job knowledge 0.776
Job Performance 0.764
Devotion to Duty 0.832
Sociability 0.758
Communication 0.747
Managing Resources 0.791
All Dimensions 0.941
Validity
Face and content validity of the tool was established with the help of experts and practitioners
in the field who thoroughly scrutinized the tool and suggested modifications.
Data Collection
For the purpose of the collecting the data, the researcher administered the tool individually to
all the respondents. Initially the respondents were requested by the investigator to furnish
their demographic details on the Personal Data Sheet attached along with the tools for data
collection. Further, they were provided specific instructions to provide their responses on the
MAY-JUNE 2016, VOL-3/24 www.srjis.com Page 2399 Scale, it was a requisite that the concerned employer of the respondent had to furnish
necessary data and also provide work efficiency rating on the prescribed schedule in respect
of the software professional working under him/her. Thus, data was obtained on
employability skills from 80 software professionals and the ratings on their levels of work
efficiency was obtained from their respective employers/reporting officers.
Data analysis
The data thus collected from the data were scored as per the procedures indicated above. The
data was then classified and tabulated for the convenience of statistical analysis. Descriptive
statistical analytical procedures were used to describe the levels of employability skills and
work efficiency of the respondents. Inferential statistical techniques such as t-test, ANOVA were used to study the statistical difference between various categories and groups. Pearson’s
Product Moment Correlation was computed to find out the significant relationships between
the study variables and also to study the influences of the demographic variables on the study
variables.
Results
The following sections present the results of the present study.
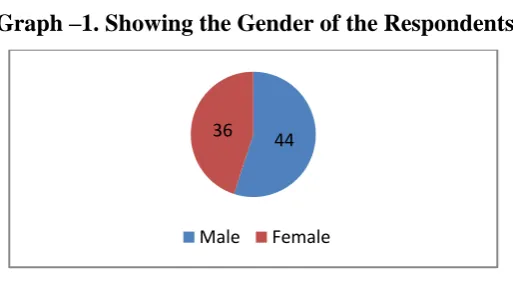
Graph –1. Showing the Gender of the Respondents
Graph –1.Shows the gender break-up of the respondents included in the study. The total
sample consists of 80 software professionals working inChennai. Among them, 44 were Male
[image:9.595.170.427.399.540.2]and 36 were female respondents.
Table – 1: Family Type of the Respondent
Family Type No of Respondent
Male Female Total
Joint 9 9 18
Nuclear 33 27 60
Extended 2 0 2
Total 44 36 80
44 36
MAY-JUNE 2016, VOL-3/24 www.srjis.com Page 2400 Table –2: Details of Previous Employment of the Respondents
Whether employed previously No of Respondent
Male Female Total
Yes 8 2 10
No 36 34 70
Total 44 36 80
When the respondents were inquired about their previous jobs, only 10 respondents had
worked previously while 70 respondents told that they had not worked previously and the
current position as Software Professional was their first employment.
Table –3: Community Details of the Respondents
Community No of Respondent
Male Female Total
General 17 10 27
SC 4 6 10
ST 4 4 8
OBC 19 16 35
Total 44 36 80
From the demographic details furnished by the respondents, it was found that 35 respondents
belonged to OBC category, 27 were from the general category while 10 respondents each
[image:10.595.90.500.415.497.2]belonged to scheduled caste and scheduled tribes respectively.
Table – 4Religion of the Respondents
Religion No of Respondent
Male Female Total
Hindu 44 35 79
Muslim 0 1 1
Total 44 36 80
It was found from the details provided by the respondents that 79 respondents follow Hindu
[image:10.595.88.511.571.751.2]religion whereas only one respondent follows Islamic faith.
Table – 5 Employability skills of the each dimension wise Respondent
Each Dimension
wise
Gender No of
Respondent Mean Values
Team Work Male
Female Total
44 36 80
21.20 20.50 20.89
Problem solving Male Female Total
44 36 80
11.55 11.31 11.44
Creative thinking Male Female Total
44 36 80
MAY-JUNE 2016, VOL-3/24 www.srjis.com Page 2401
Planning Male
Female Total 44 36 80 4.75 4.47 4.62
Time management Male Female Total 44 36 80 4.25 4.42 4.32
Leadership Male
Female Total 44 36 80 16.6136 16.3889 16.5125
Self- Management Male Female Total 44 36 80 15.89 16.11 15.99
Employability Skills Male Female Total 44 36 80 101.57 99.39 100.59
With regard to the employability skills of the respondents, the Male respondents on the
average scored higher than the female respondents in Team Work, Problem Solving, Creative
Thinking, Planning and Leadership. The female respondents on the average scored high on
Time-management and Self-management than their male counterparts. The overall mean
scores of employability skills showed that the male respondents scored higher than the female
respondents.
Table – 6: Mean Scores of Employability Skills of the Respondents based on their
Gender
Gender
Number of
Respondents
Mean Scores on Employability
Skills Std. Deviation
Level of
Employability Skills
Male 44 101.57 10.610 High
Female 36 99.39 10.864 High
Total 80 100.59 10.712 High
Based on gender it was found that on an average, the male respondents were possessing
[image:11.595.90.502.633.709.2]higher degree of employability skills than the female respondents.
Table – 7: Mean Scores of Employability Skills of the Respondents based on their
Previous Work Experience
Work Experience Number of
Respondents
Mean Scores on Employability
Skills Std. Deviation
Yes 25 100.6 9.268
No 55 97.82 10.628
Total 80 99.21 9.814
Based on the work experience, it was found that only 25 respondents were possessing
MAY-JUNE 2016, VOL-3/24 www.srjis.com Page 2402 However, it was found that on an average, those who possessed previous work experience
were manifesting higher degree of employability skills than those who did not possess any
previous work experience.
Table- 8: Mean Scores of Employability Skills of the Respondents based on their
Parental Education (Father’s Education)
Fathers Education
Number of
Respondents
Mean Scores on Employability
Skills Std. Deviation
Illiterate 8 102.50 5.753
5th Class 8 98.13 7.990
8th Class 17 100.50 12.021
10th Class 8 100.80 11.870
12th Class 13 100.38 9.102
Graduate 21 101.00 10.239
Post Graduate 5 101.22 13.057
Total 80 100.78 10.633
Based on the level of parent’s education (father’s education) it was found that on an average,
the respondents possessed higher employability skills who had their fathers as illiterates
followed by parents who completed post-graduation, graduation, 10th class, 8th class, 12th
class and 5th class respectively. This showed that the respondents who hailed from family
backgrounds with lesser education were possessing good employability skills. This might be
due to the efforts put in by those respondents to acquire and enhance such skills. It is to be
noted here that the role of education cannot be ruled out here because of the fact that the
number of respondents whose parents possessed post-graduation qualification were the
highest and the employability skills of these respondents were also high as compared to the
other levels of education of their parents. Therefore education plays a pivotal role in
enhancing the employability skills. Besides, the other factors such as motivation, the
parenting styles, environment of the respondents also are equally important to shape their
learning and skills.
Table-9 Mean Scores of Employability Skills of the Respondents based on their Parental
Occupation (Father’s Occupation)
Fathers Occupation
Number of
Respondents
Mean Scores on Employability
Skills Std. Deviation
Private Sector 46 101.98 10.006
Government Sector 14 98.64 7.428
Tailor 3 103.33 12.220
Petty Shop owner 3 102.00 19.079
Business 5 99.60 9.044
MAY-JUNE 2016, VOL-3/24 www.srjis.com Page 2403
Advocate 1 93.00 .
Daily Wage
Labourers
1 95.00 .
Total 77 100.79 10.702
From the data presented in Table - 10, it is observed that based on the parental occupation (father’s occupation), the level of the employability skills of the respondents were computed
and found that respondents whose fathers were Tailors possessed high employability skills,
followed by the respondents whose fathers were petty shop owners, private sector employees,
businessmen, government employees, teacher, advocate and daily wage labourer respectively.
It is interesting to note that the wards of the teachers were possessing lesser degree of
[image:13.595.107.492.73.123.2]employability skills as compared to the wards of other professions.
Table – 10: Mean Scores of Employability Skills of the Respondents based on their
Parental Income (Father’s Income)
Father income
Number of
Respondents
Mean Scores on Employability
Skills Std. Deviation
0-5000 3 103.33 9.713
5001-10000 8 106.00 8.864
10001-20000 17 100.87 10.623
20001-25000 18 101.32 13.642
25001-30000 16 97.63 11.051
30001-35000 9 98.89 8.298
35001-40000 1 96.50 6.364
40001-45000 1 102.00 .
55001-60000 3 106.67 3.786
Total 76 100.83 10.768
Based on the parental income (fathers income) the respondents employability skills were
classified and found that those respondents with their fathers earning higher level of income
were manifesting better employability skills while parents with lesser income were also
possessing better employability skills. However, the respondents who had fathers earning
high income were affordable to acquire newer skills through taking up additional courses
while the respondents who had fathers with lesser income levels, they could develop their
[image:13.595.95.503.308.476.2]employability skills based on their intrinsic and extrinsic motivational factors.
Table – 11: Mean Scores of Employability Skills of the Respondents based on their
Parental Education (Mothers Education)
Mothers
education Number of
Respondents
Mean Scores on Employability
Skills Std. Deviation
Illiterate 18 99.78 7.930
5th Class 21 99.38 12.106
MAY-JUNE 2016, VOL-3/24 www.srjis.com Page 2404
10th Class 12 104.17 11.754
12th Class 10 98.60 10.946
Post graduate 1 89.00 .
Total 80 100.59 10.712
From the table – 11 it was found that based on the educational qualification of the mothers of
the respondents, the employability skills scores were classified. It was observed that the
respondents possessed better degree of employability skills who had mothers with lesser
education and as their mothers educational level increased, the respondents manifested a
decrease in their employability skills. This indicates that employability skills of the
[image:14.595.104.491.73.123.2]respondents are inversely proportional to their mothers education.
Table – 12: Mean Scores of Employability Skills of the Respondents based on their
Parental Occupation (Mothers Occupation)
Mothers Occupation
Number of
Respondents
Mean Scores on Employability
Skills Std. Deviation
Home Maker 75 100.84 10.698
Government Employee 1 104.00 .
Private Sector
Employee
3 98.67 12.897
Tailoring 1 103.00 .
Total 80 100.82 10.571
From the above table it was found that the respondents who had their mothers working in
private sector showed lesser degree of employability skills than the respondents who had
their mothers who were house wives.
Table – 13: Mean Scores of Employability Skills of the Respondents based on their
Parental Income (Mothers Income)
Mothers Income
Number of
Respondents
Mean Scores on Employability
Skills Std. Deviation
0-5000 2 91.50 4.950
5001-10000 2 100.50 3.536
10001-15000 1 100.00 .
15001-20000 3 99.67 15.948
Total 8 97.88 9.672
From the table above, it is found that the employability skills of the respondents from middle
[image:14.595.100.494.289.405.2]MAY-JUNE 2016, VOL-3/24 www.srjis.com Page 2405 Table – 14: Mean Scores of Employability Skills based on the number of siblings of the
Respondents
Number of siblings
Number of
Respondents
Mean Scores on Employability
Skills Std. Deviation
One 4 103.00 7.439
Two 24 102.88 12.241
Three 33 98.64 10.249
Four 17 101.53 10.032
Five 2 92.50 7.778
Total 80 100.59 10.712
It was found that the respondents who had one sibling possessed better employability skills
followed by those who had two siblings, four siblings three siblings and five siblings
respectively.
Table – 15: Mean Scores of Employability Skills based on the ordinal position of the
Respondents
Ordinal position Number of
Respondents
Mean Scores on Employability
Skills Std. Deviation
First 34 100.21 9.174
Second 31 101.90 12.180
Third 12 96.00 9.863
Four 3 109.67 10.214
Total 80 100.59 10.712
Based on the ordinal position of the respondents, it was found that the respondents who were
in the fourth ordinal position possessed greater degree of employability skills followed by
who were in the ordinal positions second, first and third respectively.
Table – 16: Mean Scores of Employability Skills based on the Family Type of the
Respondents
Family type
Number of
Respondents
Mean Scores on Employability
Skills Std. Deviation
Joint 18 98.89 11.318
Nuclear 60 101.43 10.314
Extended 2 90.50 17.678
Total 80 100.59 10.712
Based on the family type of the respondents, it was found that the mean scores of the
employability skills were higher for those who were from the Nuclear family systems
MAY-JUNE 2016, VOL-3/24 www.srjis.com Page 2406 Table – 17: Mean Scores of Employability Skills based on the Community of the
Respondents
Community
Number of
Respondents
Mean Scores on Employability
Skills Std. Deviation
GEN 27 101.93 9.872
SC 10 102.10 13.404
ST 8 98.13 8.254
OBC 35 99.69 11.232
Total 80 100.59 10.712
Based on the community of the respondents, it was found that the respondents who belonged
to scheduled caste scored high on employability skills followed by those respondents
belonging to general, OBC and Scheduled Tribe categories respectively.
Table - 18 Mean Scores of Employability Skills based on the Religion of the
Respondents
Religion
Number of
Respondents
Mean Scores on Employability
Skills Std. Deviation
Hindu 79 100.48 10.738
Muslim 1 109.00 .
Total 80 100.59 10.712
From the table above it was found that on an average, the respondents belonging to Islamic
faith scored high on employability skills than the respondents who followed Hindu religion.
However, it was found that only one respondent belonged to Muslim religion and therefore
the average of their employability skills might change in case the number of respondents
[image:16.595.81.510.519.734.2]increase.
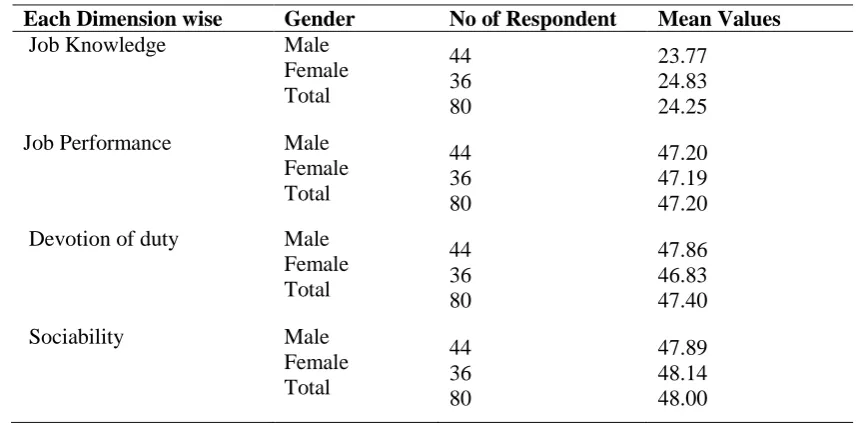
Table - 19: Work Efficiency sub Dimension wise of the Respondent
Each Dimension wise Gender No of Respondent Mean Values
Job Knowledge Male
Female Total 44 36 80 23.77 24.83 24.25
Job Performance Male
Female Total 44 36 80 47.20 47.19 47.20
Devotion of duty Male
Female Total 44 36 80 47.86 46.83 47.40
Sociability Male
MAY-JUNE 2016, VOL-3/24 www.srjis.com Page 2407
Communication Male
Female Total
44 36 80
48.57 49.72 49.09
Managing Resources Male Female Total
44 36 80
23.95 23.42 23.71
Work Efficiency Male
Female Total
44 36 80
239.25 240.14 239.65
Over all, the respondents have been rated to possess good work efficiency and its dimensions
by their respective employers. Male Respondents scored higher on the Job Performance,
Devotion to Duty, Sociability and Managing Resources dimensions of Work Efficiency than
the Female Respondents. The Female Respondents scored high on the average on the Job
Knowledge and Communication dimensions of Work Efficiency than the Male Respondents.
Based on the total score on work efficiency, the Female respondents scored higher than the
Male respondents on the average.
Table- 20 Mean Scores of Work Efficiency based on the Gender of the Respondents
Gender
Number of
Respondents
Mean Scores on
Work Efficiency Std. Deviation
Male 44 239.25 22.821
Female 36 240.14 25.565
Total 80 239.69 24.193
On the average, it was noticed that the female respondents showed higher work efficiency as
[image:17.595.78.518.536.664.2]compared with their male counterparts.
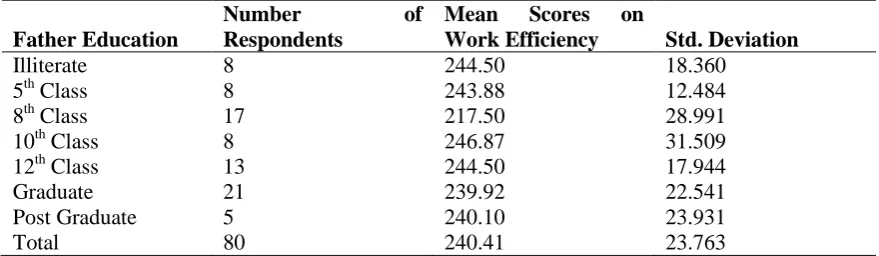
Table – 21: Mean Scores of Work Efficiency based on the Parental Education (Fathers
Education) of the Respondents
Father Education
Number of
Respondents
Mean Scores on
Work Efficiency Std. Deviation
Illiterate 8 244.50 18.360
5th Class 8 243.88 12.484
8th Class 17 217.50 28.991
10th Class 8 246.87 31.509
12th Class 13 244.50 17.944
Graduate 21 239.92 22.541
Post Graduate 5 240.10 23.931
Total 80 240.41 23.763
Based on the education of the fathers of the respondents, it was found that those respondents
who had their fathers who have passed SSLC scored high on their work efficiency ratings
MAY-JUNE 2016, VOL-3/24 www.srjis.com Page 2408 illiterates, fifth class, post graduates, graduates, and those who have passed eighth class
[image:18.595.92.504.153.309.2]respectively.
Table – 22Mean Scores of Work Efficiency based on the Parental Occupation (Fathers
Occupation) of the Respondents
Father Occupation Number of
Respondents
Mean Scores on
Work Efficiency Std. Deviation
Private Employee 46 242.93 18.413
Government Employee
14 234.93 35.920
Tailor 3 221.00 19.079
Petty Shop owner 3 244.67 28.919
Business 5 252.20 21.534
Teacher 4 233.50 35.986
Advocate 1 222.00 .
Daily wages 1 246.00 .
Total 77 240.57 23.875
From the data above it was found that on the average, the wards of the fathers who were
businessmen scored high ratings on their work efficiency levels, followed by those
respondents whose fathers were daily wage workers, shop keepers, private employees,
government employees, teachers, advocates, and tailors respectively.
Table – 23: Mean Scores of Work Efficiency based on the Parental Income (Fathers
Income) of the Respondents
Father Income Number of
Respondents
Mean Scores on
Work Efficiency Std. Deviation
5001-10000 11 230.00 22.220
10001-20000 17 240.00 27.529
20001-25000 18 243.47 18.907
25001-30000 16 247.81 21.615
30001-35000 9 238.89 34.607
35001-40000 2 222.50 36.062
40001-45000 1 227.00 .
55001-60000 3 250.00 22.605
Total 77 240.74 23.990
While comparing with the income levels of the fathers of the respondents and the work
efficiency levels of the respondents, the respondents whose fathers earned the highest secured
the highest ranking on work efficiency while the respondents secured lesser rating whose
[image:18.595.84.512.432.580.2]MAY-JUNE 2016, VOL-3/24 www.srjis.com Page 2409 Table – 24: Mean Scores of Work Efficiency based on the Parental Education (Mothers
Education) of the Respondents
Mother Education
Number of
Respondents
Mean Scores on
Work Efficiency Std. Deviation
Illiterate 18 247.33 20.211
5th Class 21 235.00 29.601
8th Class 18 239.83 20.757
10th Class 12 244.08 26.973
12th Class 10 233.00 16.173
Post Graduate 1 209.00 .
Total 80 239.65 23.942
Based on the education of the mothers of the respondents, it was found that the respondents
scored highest on their level of work efficiency whose mothers were illiterates and contrarily,
[image:19.595.93.506.332.436.2]the respondents whose mothers were post graduates scored the least ratings on an average.
Table – 25: Mean Scores of Work Efficiency based on the Parental Occupation
(Mothers Occupation) of the Respondents
Mother Occupation Number of
Respondents
Mean Scores on
Work Efficiency Std. Deviation
House wife 75 239.30 23.666
Government Employee
1 209.00 .
Private Employee 3 253.33 7.024
Tailoring 1 284.00 .
Total 80 240.01 23.873
The wards of mothers who were practicing tailoring scored the highest ratings on work
efficiency on the average as compared with the least ratings obtained by the respondent
whose mothers was a government employee.
Table – 26: Mean Scores of Work Efficiency based on the Parental Income (Mothers
Income) of the Respondents
Mother Income
Number of
Respondents
Mean Scores on
Work Efficiency Std. Deviation
0-5000 2 250.00 5.657
5001-10000 2 256.00 39.598
10001-15000 1 228.00 .
15001-20000 3 226.67 28.885
Total 8 240.00 25.796
It was found that based on the income of the mothers of the respondents, the respondents
whose mothers earned between Rs.5001-10000 per month got the highest ratings on work
efficiency on the average followed by the wards of the mothers who earned up to Rs.5000,
MAY-JUNE 2016, VOL-3/24 www.srjis.com Page 2410 Table – 27: Mean Scores of Work Efficiency based on the number of Siblings of the
Respondents
Number of
sibling
Number of
Respondents
Mean Scores on
Work Efficiency Std. Deviation
One 4 236.25 10.689
Two 24 240.88 22.930
Three 33 235.94 27.067
Four 17 245.82 22.230
Five 2 240.50 17.678
Total 80 239.65 23.942
Based on the number of siblings, the work efficiency rating of the respondents were
computed and found that on the average, those respondents who had 4 siblings got the highest
[image:20.595.100.492.334.421.2]rating on work efficiency followed by those who had 1, 2, 3, and 5 siblings respectively.
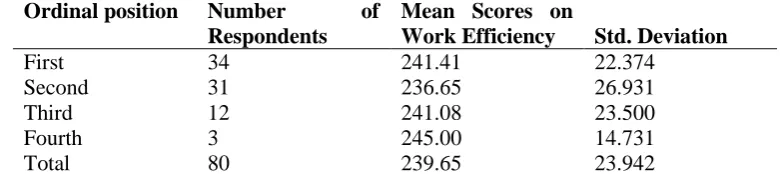
Table – 28: Mean Scores of Work Efficiency based on the Ordinal Position of the
Respondents
Ordinal position Number of
Respondents
Mean Scores on
Work Efficiency Std. Deviation
First 34 241.41 22.374
Second 31 236.65 26.931
Third 12 241.08 23.500
Fourth 3 245.00 14.731
Total 80 239.65 23.942
Based on the above table it is found that the respondents who were in the fourth ordinal
position got the highest ratings on the work efficiency on the average followed by the
respondents who have first, third and second ordinal positions respectively.
Table – 29: Mean Scores of Work Efficiency based on the Family Type of the
Respondents
Types of family Number of
Respondents
Mean Scores on
Work Efficiency Std. Deviation
Joint 18 236.50 25.480
Nuclear 60 239.88 23.324
Extended 2 261.00 32.527
Total 80 239.65 23.942
When computed the averages of the work efficiency scores of the respondents based on their
family type it was found that the respondents who hailed from extended family system
MAY-JUNE 2016, VOL-3/24 www.srjis.com Page 2411 Table – 30: Mean Scores of Work Efficiency based on their the Previous Employment
Experience of the Respondents
Previous Employ Number of
Respondents
Mean Scores on
Work Efficiency Std. Deviation
Yes 10 245.00 29.537
No 70 238.89 23.190
Total 80 239.65 23.942
With reference to the previous work experience of the respondents, it was found on the
average that those respondents who had prior work experience showed higher levels of work
efficiency as compared to their counterparts who had less or no work experience.
Table – 31: Mean Scores of Work Efficiency based on the Community of the
Respondents
Community Number of
Respondents
Mean Scores on
Work Efficiency Std. Deviation
GEN 27 238.93 23.107
SC 10 237.10 32.549
ST 8 244.50 14.852
OBC 35 239.83 24.287
Total 80 239.65 23.942
With regard to the community of the respondents, the average scores of their work efficiency
were classified and found that the respondents belonging to Scheduled Tribes scored higher
[image:21.595.83.506.455.519.2]on their work efficiency followed by OBC, General and Scheduled Caste Categories.
Table- 32 Mean Scores of Work Efficiency based on the Religion of the Respondents
Religion Number of
Respondents
Mean Scores on
Work Efficiency Std. Deviation
Hindu 79 239.68 .
Muslim 1 237.00 24.093
Total 80 239.65 23.942
It was found that the respondents who followed Hindu religion scored high on their levels of
work efficiency as compared to the respondents who followed Islam. This was found
contrary to the employability skills wherein, the respondents who followed Islam scored high
on employability skills than those who followed Hindu Religion.
Table: 33: Correlation between Employability Skills and Work Efficiency
Variables Correlation Coefficient
Employability Skills .758
Work Efficiency
On analysis of the data, it was found that there was asignificant relationship found between
the independent and dependent variable employability skills and work efficiency of the
MAY-JUNE 2016, VOL-3/24 www.srjis.com Page 2412 enables a person to secure a job, enables him to maintain and perform well on a job. These set
of skills aid in enhancing work performance and increases the quality of work output.
Arocena. P, ImanolNúñez, Mikel Villanueva, (2007) in their study observed that employability has close relationship with one’s career self-efficacy. Through the present study, it was observed that employability skills can enhance one’s level of work efficiency.
The integrationists' views suggest that employability is an interaction of person, occupational
skills and labour market demands. Therefore, the phenomenon of employability of workers is
not just dependent upon the labour market forces, but also on other factors. A recent study
found that the essential features of employability encompasses individual's potential
(capabilities) of being successful in any labour market situation with focus on willingness as
well as capacity to be successful in a variety of jobs (Alison Taylor, 1999). It can be
concluded focus on willingness to work and capacities to be successful in variety of jobs are
also of paramount significance which would contribute to work efficiency apart from the
employability skills. Therefore the Hypothesis – 1 stating thatthere will be no significant
relationship between employability skills and wok efficiency of the software
[image:22.595.83.509.444.567.2]professionalswas rejected
Table – 34: Correlation between the sub dimensions of Employability Skills and Work
Efficiency
Variables Correlation Coefficient
Communication .465**
Team Work .346**
Problem Solving .317**
Creative Thinking .059
Planning and Organising .411**
Time Management .323**
Leadership .084
Self Management .330**
** Significant at 0.01 level
The correlational analysis between the sub-dimensions of employability skills and the overall
work efficiency scores indicated that there was a significant relationship between
Communication, Team Work, Problem Solving, Planning and Organising, Time
Management, Self-Management. However, there was no significant relationship found
between the sub dimensions of employability skills viz., Leadership, and Creative Thinking
with their work efficiency levels.
Al-Alawneh, Muhammad K. (2011) observed creativity as resulting from the interaction of
MAY-JUNE 2016, VOL-3/24 www.srjis.com Page 2413 van der Heijden, Karen van Dam and MarjaWillemsen,(2009) similarly focussed on social
and organisational factors arguing in particular that creativity at work is supported by
organisational and supervisory encouragement as well as by a diversity of ideas within the
work group, Beatrice van der Heijden, (2002)
The Hypothesis-2 stating that “there will be no significant relationship between the
sub-dimensions of employability skills with the overall work efficiency of the Software
[image:23.595.101.488.258.355.2]Professionals” was rejected.
Table – 35: Correlation between the sub dimensions of Work Efficiency and
Employability Skills
Variables Correlation Coefficient
Job knowledge 3.371**
Job Performance .388**
Devotion to Duty .230**
Sociability .147
Communication .309**
Managing Resources .233**
** Significant at 0.01 level
While performing correlation analysis between the dimensions of work efficiency with the
overall employability skills scores, it was found that there was a significant relationship
between Job knowledge, Job Performance, devotion to duty, Communication, Managing
Resources and the overall score of the employability Skills except Sociability. As observed
earlier, the employability skills enable a person to secure a job or to sustain on a job.
However, sociability is contingent on the personal characteristics, besides personal attitudes.
The Hypothesis-3 stating that “there will be no significant relationship between the
sub-dimensions of work efficiency with the work overall employability skills of the Software
Professionals” was rejected.
Table – 36: Correlation between the sub dimensions of Work Efficiency and the sub
dimensions of Employability Skills
Correlation between
Job knowled ge
Job Perfo rman ce
Devotio
n to
Duty
Sociabilit y
Comm unicati on
Managi ng Resourc es Communicati
on .396** .303*
*
.346** .108 .303** .219*
Team Work
.374** .362* *
.303** .117 .296** .319**
[image:23.595.100.519.601.758.2]MAY-JUNE 2016, VOL-3/24 www.srjis.com Page 2414
Solving .321** .365*
*
.118 .361** .228*
Creative
Thinking .069 .150 .197 .136 .114 .111
Planning and
Organising .325** .322* *
.398** .115 .231* .342**
Time
Management .303** .308* *
.306** .132 .305** .315**
Self
Management
.373** .335* *
.380** .111 .214* .383**
Leadership .020 .171 .136 .181 .029 .111
** significant at 0.01 level
* significant at 0.05 level
From the table above it is evident that there exists a significant correlation between the
dimensions of work efficiency and the dimensions of employability skills. However, the
dimensions of employability skills viz., creative thinking and leadership did not correlate
with the other sub-dimensions of work efficiency. Further the sub dimension of work
efficiency Sociability did not have a significant correlation with the dimensions of
employability skills.
Therefore, the Hypothesis-4 stating that “there will be no significant relationship between the
sub-dimensions of Employability Skills and sub-dimensions of Work Efficiency of the
[image:24.595.91.497.486.560.2]Software Professionals” isrejected.
Table – 37: Significance of Difference in Employability Skills with regard to Gender
Variable Mean Standard
Deviation
t-ratio Level of
Significance
Male 101.57 10.610 .904 NS
Female 99.39 10.864
On investigating the differences with regard to employability skills based on gender, it was
found that there was no significant difference found between the male and female
respondents. However, it was found from the mean value that males possessed higher degree
MAY-JUNE 2016, VOL-3/24 www.srjis.com Page 2415 Table – 38: Significance of in Employability Skills with regard to Father’s Education,
Occupation and Income
Demographic Variable
Variable Sum of squares
Df Mean
square F-ratio
Level of
Significance Father’s
Education
Between
group 155.485 34 4.573
1.108 .371 Within
Group 177.400 43 4.126
Total 332.885 77
Father’s Occupation
Between
group 127.175 34 3.740
1.518 .099 Within
Group 103.500 42 2.464
Total 230.675 76
Father’s Income
Between
group 134.026 34 3.942
.981 .519 Within
Group 164.750 41 4.018
Total 298.776 75
From the above ANOVA table it is observed that there exists no significant difference
between the parental education (fathers education) and the employability skills of the
respondents. It is evident here that the education one possess is directly transferred into skill
form. The parental education has limited role in directly transferring skill to their offspring. It
would only be possible for the parents to provide appropriate environment for developing the
skills. However, successful acquisition of the skills still vests with the individual.
From the table above, it is observed that there exists no significant difference between the
Parental Occupation (Fathers Occupation) and the Employability Skills of the respondents.
The employability skill is unique to each individual and does not relate much with the
parental occupation. The success to secure a job, survival and skillful performance depends
on the degree of acquisition and utilization of the skills. On analysis, it was found that there
exists no significant difference between the Parental Income (Fathers Income) and the
MAY-JUNE 2016, VOL-3/24 www.srjis.com Page 2416 Table – 39: Significance of in Employability Skills with regard to Mother’s Education,
Occupation and Income
Demographic Variable
Variable Sum of squares
Df Mean
square F-ratio
Level of
Significance Mother’s
Education
Between
group 53.654 35 1.533
.662 .895 Within
Group 101.833 44 2.314
Total 155.487 79
Mother’s Occupation
Between
group 127.175 34 3.740
1.518 .099 Within
Group 103.500 42 2.464
Total 230.675 76
Mother’s Income
Between
group 134.026 34 3.942
.981 .519 Within
Group 164.750 41 4.018
Total 298.776 75
The Table- 39 shows that there exists no significant difference between the Mothers
Education and the employability skills of their wards. As was observed in the case of the
father’s education of the respondents it is seen that the parental education does not show any
significant difference between the respondents with regard to their employability skills.
On computing the one-way analysis of variance for the respondent’s employability skills
based on the occupation of their mothers, it was found that there exists no significant
difference between the respondents in their employability skills with regard to the parental occupation. This was also observed in the case of the father’s occupation of the respondents.
Therefore, the study reveals that there exists no significant difference in employability skills
of the respondents based on the parental occupation.
Table-39 shows the f-ratio between different categories of respondents based on their mother’s income and their employability skills. It was observed that there exists no significant difference between the mother’s income of the respondents and the employability skills of the respondents. The same was also observed in the case of father’s income.
Therefore it is inferred in this study that there exists no significant difference between the
MAY-JUNE 2016, VOL-3/24 www.srjis.com Page 2417 Table – 40: Significance of in Employability Skills with regard to Number of Siblings,
Ordinal Position, Family Type and Work Experience
Demographic Variable
Variable Sum of squares
Df Mean
square F-ratio
Level of
Significance Number of
Siblings
Between
group 28.754 35 .822
1.041 .446 Within
Group 34.733 44 .789
Total 63.488 79
Ordinal Position
Between
group 34.133 35 .975
2.076 .011** Within
Group 20.667 44 .470
Total 54.800 79
Family Type Between
group 10.283 35 .294
1.337 .179 Within
Group 9.667 44 .220
Total 19.950 79
Work Experience
Between
group 3.033 35 .087
.667 .891 Within
Group 5.717 44 .130
Total 8.750 79
With regard to the number of siblings of the respondents, it was found that there exists no
significant difference between the number of siblings and their employability skills.
On analysis, it was found that there was a significant difference existing among the
respondents with regard to their ordinal position and their levels of employability skills they
currently possess. The mean scores of the respondents based on their ordinal position
indicates that the respondents who were in the fourth ordinal position possessed greater
degree of employability skills followed by who were in the ordinal positions second, first and
third respectively.
With reference to the family type of the respondents, the significant differences computed
among the respondents in their employability skills, it was found that the F-ratio was 1.337
which was not significant. Therefore the respondents do not significantly differ in their
MAY-JUNE 2016, VOL-3/24 www.srjis.com Page 2418 Table – 40 shows the F-ratio between the previous work experience of the respondents and
their employability skills; it was found that there exists no significant difference among the
respondents with regard to their previous work experience and their employability skills.
[image:28.595.90.508.195.398.2]However, for majority of the respondents this was the first work experience.
Table – 41: Significance of in Employability Skills with regard to Number of Siblings
and Religion
Demographic Variable
Variable Sum of squares
Df Mean
square F-ratio
Level of
Significance Community Between
group 74.488 35 2.128
1.377 .157 Within
Group 68.000 44 1.545
Total 142.488 79
Religion Between
group .321 35 .009
.605 .936 Within
Group .667 44 .015
Total .987 79
With regard to the F-ratio computed based on the community of the respondents and their
employability skills, it was found that there was no significant difference among the
respondents based on their community and their employability skills.
On analysis to probe any differences among the respondents with regard to their religion and
their employability skills, it was found that there existed no significant difference between the respondents’ religion and their employability skills.
Therefore, the Hypothesis-5 stating that “there will be no significant difference between the
[image:28.595.90.509.610.682.2]Software Professionals in their overall employability skills based on the demographic variables” is rejected in view of the above significant difference.
Table – 42 Significance of Difference between Gender and Work Efficiency
Variable Mean Standard
Deviation
t-ratio Level of Significance
Male 239.25 23.017 1.214 NS
Female 240.14 24782
Based on the gender, the T-ratio was calculated for the respondents with regard to their work
efficiency skills. There was no significant difference found among the respondents with
MAY-JUNE 2016, VOL-3/24 www.srjis.com Page 2419 Table – 43: Significance of in Work Efficiency with regard to Father’s Education,
Occupation and Income
Demographic Variable
Variable Sum of squares
Df Mean
square F-ratio
Level of
Significance Father’s
Education
Between
group 180.885 50 3.618
.643 .913 Within
Group 152.000 27 5.630
Total 332.885 77
Father’s Occupation
Between
group 142.175 50 2.844
.835 .713 Within
Group 88.500 26 3.404
Total 230.675 76
Father’s Income
Between
group 157.610 50 3.152
.558 .960 Within
Group 141.167 25 5.647
Total 298.776 75
While it was noticed that there existed significant difference between the respondents in their
work efficiency based on their educational qualification, there was no significant difference
obtained between the respondents work efficiency scores based on their fathers education. With regard to the fathers’ occupation, there was no significant difference observed among
the respondents in their work efficiency levels. This was also noticed in the case of the
employability skills of the respondents that no significant differences existed with regard to the fathers’ occupation.
From the table above, the F-ratio did not show any significant differences among the
respondents in their work efficiency based on the Fathers Income.
Table – 44: Significance of in Work Efficiency with regard to Mother’s Education,
Occupation and Income
Demographic Variable
Variable Sum of squares
Df Mean
square F-ratio
Level of
Significance Mother’s
Education
Between
group 85.821 51 1.683
.676 .889 Within
Group 69.667 28 2.488
[image:29.595.74.519.628.756.2]MAY-JUNE 2016, VOL-3/24 www.srjis.com Page 2420
Mother’s Occupation
Between
group 16.968 50 .339
.905 .629 Within
Group 10.500 28 .375
Total 27.468 78
Mother’s Income
Between
group 11.375 6 1.896
3.792 .374 Within
Group .500 1 .500
Total 11.875 7
As was observed in the case of employability skills, there was no significant difference
noticed among the respondents in their work efficiency with regard to their Mothers
Education.
Through this study it was found that the respondents did not significantly differ in their work
efficiency based on their Parental Occupation.
Based on the Mothers income, the work efficiency of the respondents was analysed. It was
[image:30.595.98.513.454.760.2]found that the respondents did not significantly differ with regard to their mothers income.
Table – 45: Significance of in Work Efficiency with regard to Number of Siblings,
Ordinal Position, Family Type and Work Experience
Demographic Variable
Variable Sum of squares
Df Mean
square F-ratio
Level of
Significance Number of
Siblings
Between
group 44.488 51 .872
1.286 .240 Within
Group 19.000 28 .679
Total 63.488 79
Ordinal Position
Between
group 38.633 51 .758
1.312 .222 Within
Group 16.167 28 .577
Total 54.800 79
Family Type Between
group 12.783 51 .251
.979 .538 Within
Group 7.167 28 .256
MAY-JUNE 2016, VOL-3/24 www.srjis.com Page 2421
Work Experience
Between
group 3.750 51 .074
.412 .997 Within
Group 5.000 28 .179
Total 8.750 79
The respondents’ level of work efficiency was analysed based on their number of siblings.
Based on the number of siblings of the respondents, the respondents did not differ
significantly.
With respect to the ordinal position of the respondents, the work efficiency the significant
differences were computed and found that the F-ratio was .222 which was not significant.
Therefore the respondents did not significantly differ in their work efficiency based on their
ordinal position.
The respondents work efficiency levels were analysed based on the type of family from
which they hail. The F-ratio was found to be .979 with respect to the family types of the
respondents and their work efficiency scores. There was no significant difference noticed
among the respondents in their work efficiency with respect to their family types.
The previous work experience of the respondents were taken into account the analysis and
found that for most of them the current position was their first job. Based on the previous
work experience and no work experience of the respondents, the F-ratio was calculated for
their work efficiency scores. It was found that the F-ratio was .412 which was not found to be
significant. This showed that the respondents did not significantly differ in their work
efficiency based on their work experience.
The respondents did not significantly differ in their work efficiency based on their religion.
The F-ratio was .179 which revealed that there was no statistically significant difference.
Therefore, it was inferred that there exist no significant difference between the respondents in
their work efficiency levels based on their religion.
Therefore, the Hypothesis-5 stating that “there will be no significant difference in the work
efficiency based on the demographic variables is accepted as there were no significant
differences found.
Conclusions
Based on the results the following conclusions were drawn:
The overall mean scores of employability skills showed that the male respondents