STATISTIC MODEL OF PE TEACHING EFFECT BASED ON
SPSS SOFTWARE
HUAXIN ZHANG
Jiaxing Vocational Technical College, Jiaxing 314036, Zhejiang, China E-mail: [email protected]
ABSTRACT
PE teaching score is a direct reflection of the quality of teaching, and the statistic analysis of the grade is an important part of the physical teaching process. Teachers can draw their own teaching effectiveness and know how students are getting along with study, through the analysis of the results, which make exams truly serving the quality education. How to do teaching analysis better and faster is a very important issue. In this paper, we study on the methods and procedures of PE teaching statistic analysis based on SPSS software, and provide an approach for the analysis of the scores in PE teaching.
Keywords: SPSS, PE Teaching, Statistic Analysis, Normal Distribution
1. INTRODUCTION
The statistic analysis of the PE teaching score is an important part of the teaching process, and also is a necessary way to reflect teaching results. Therefore, it is necessary for us to do a more in-depth and detailed statistic analysis in order to know the PE teaching effectiveness, students’ mastery of the knowledge and skills, and at the same time to regulate and guide the teachers' behavior, which help make exams truly serving quality education. The exam is one of the important methods to evaluate the quality of teaching, measure the effectiveness, and identify the quality of talents. Since all the teaching of PE courses are detected and monitored by means of exams, so how to accurate positioning the exam and how to properly treat the exam results have become an extremely important issue in modern education. Currently, the vast majority of the examination results are given in the form of marks, so the assessment and use of the marks become particularly important. Accurate analysis and assessment of the students’ scores will provide an important basis to guide teaching and improve students’ grade.
In face of a pile of sports test data, checking the points and doing statistics are very complicated. It is not only error-prone, but also difficult to be collected, standardized and organized with a scientific and rational method. As a result of this, a large number of first-hand data resources cannot be provided as accurate scientific data for future teaching, which is an enormous waste and pity for each PE teacher. Formerly people do data statistic
analysis mostly by hand and EXCEL. Excel is the most basic tool in data analysis for its easy to grasp, but it is not suitable for large-scale statistic analysis. SPSS has been widely accepted for its easy to learn and use, as well as with a large number of sophisticated statistic analysis methods, impeccable operation management of the data definition, open data interface, and flexible statistic tables and statistic graphics. This paper studies how to do statistic analysis of PE teaching scores using SPSS software. The data in this article come from the PE final exam scores of freshmen in a college.
2. ANALYSIS OF THE SYNTHETICALLY EVALUATION SCORE
Synthetically evaluation score indicates the total score of PE final exam, usual test and PE attendance.
(1) Quartile of the synthetically evaluation score
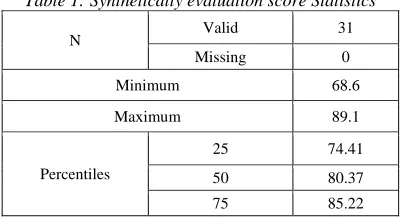
Table 1: Synthetically evaluation score Statistics
N Valid 31
Missing 0
Minimum 68.6
Maximum 89.1
Percentiles
25 74.41
50 80.37
75 85.22
[image:1.612.321.522.579.688.2]of the students’ synthetically evaluation score is 74.41, 50% of the students’ synthetically evaluation score is 80.37, and 75% of the students’ synthetically evaluation score is 85.22. Quartile difference confirmed that the students’ synthetically
evaluation score shows regular left-skewed distribution.
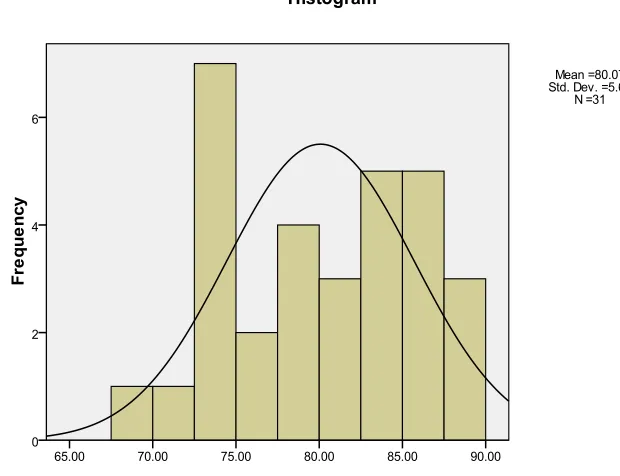
[image:2.612.153.463.182.420.2](2) Histogram of the synthetically evaluation score
Figure 1: Histogram of the synthetically evaluation score
Figure 1 indicates that the average students’ synthetically evaluation score in the class is 80.07, with a standard deviation of 5.62. As can be seen from the figure, the synthetically evaluation score is
left-skewed. Most students get about 85 marks and the number of students around 70 marks is at least.
[image:2.612.94.525.525.628.2](3) The Basic statistics analysis of synthetically evaluation score
Table 2: The Basic statistics analysis of synthetically evaluation score
N Range Minimum Maximum Mean Deviation Std. Skewness Kurtosis
Statistic Statistic Statistic Statistic Statistic Statistic Statistic Error Std. Statistic Error Std.
Synthetically
evaluation score 31 20.55 68.61 89.15 80.07 5.619 -.246 .42 -1.06 .82
Valid N
(listwise) 31
Table 2, it shows that the range of synthetically evaluation scores is 20.55 points, which means that the data is relatively disperse. In addition, the minimum and maximum values of synthetically evaluation score are 68.61 and 89.15, with an average score of 80.07 points and a standard deviation of 5.619. As can be seen from the skewness coefficient that the skewness coefficient
3. STATISTIC ANALYSIS AND
COMPARISON OF EACH SUBJECT SORES
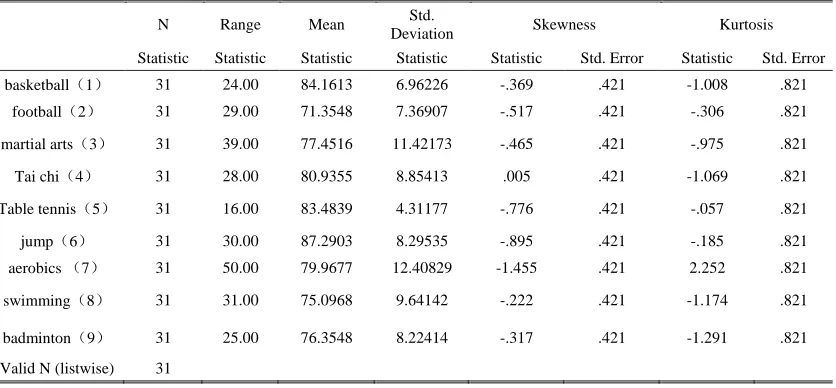
Table 3: Statistic Analysis and comparison of the sores of each subject
N Range Mean Std.
Deviation Skewness Kurtosis
Statistic Statistic Statistic Statistic Statistic Std. Error Statistic Std. Error
basketball(1) 31 24.00 84.1613 6.96226 -.369 .421 -1.008 .821
football(2) 31 29.00 71.3548 7.36907 -.517 .421 -.306 .821
martial arts(3) 31 39.00 77.4516 11.42173 -.465 .421 -.975 .821
[image:3.612.104.522.128.322.2]Tai chi(4) 31 28.00 80.9355 8.85413 .005 .421 -1.069 .821
Table tennis(5) 31 16.00 83.4839 4.31177 -.776 .421 -.057 .821
jump(6) 31 30.00 87.2903 8.29535 -.895 .421 -.185 .821
aerobics (7) 31 50.00 79.9677 12.40829 -1.455 .421 2.252 .821
swimming(8) 31 31.00 75.0968 9.64142 -.222 .421 -1.174 .821
badminton(9) 31 25.00 76.3548 8.22414 -.317 .421 -1.291 .821
Valid N (listwise) 31
The above Table 3 shows that the range of aerobics is maximum and the range of table tennis is minimum, indicating that the score of aerobics has the highest degree of dispersion, and table tennis’s degree of dispersion is the lowest. It has the same situation when check the standard deviation. Among all the subjects, jump scores owns the highest average score and the lowest average score come from the football scores. Only
Tai chi's statistics show a right-skewed distribution, and other subjects’ results show left-skewed distribution. In addition, among all subjects only aerobics’ result has a spike distribution and other subjects show flat peak distribution.
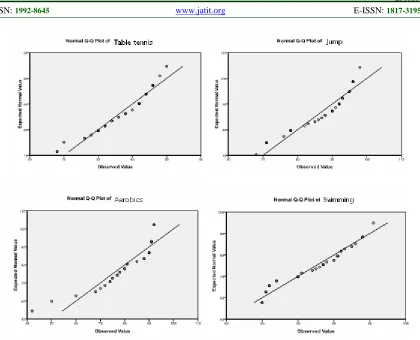
Figure 2: Q-Q plot analysis of each subject
From the above Figure 2, we can draw a conclusion that, all the subject conform to the normal distribution, apart from a few high mark and low mark points deviate from the normal distribution line slightly.
5. THE TEST OF EACH SUBJECT
[image:4.612.103.523.71.411.2]5.1. The t-test of the jump score
Table 4: Basic description statistics of the jump score One-Sample Statistics
N Mean Std. Deviation Std. Error Mean
sports 31 87.2903 8.29535 1.48989
Table 5: the simple sample t-test result of the jump score One-Sample Test
Test Value = 88
t df Sig. (2-tailed) Mean
Difference
95% Confidence Interval of the Difference
Lower Upper
jump -.476 30 .637 -.70968 -3.7524 2.3331
From the information show in Table 4 and Table 5 we can know that, among the 31 students’ sports scores in the class, the average score is 87.2903, with a standard deviation of 8.29535.The null hypothesis of the average score in this class is no less than 88 points. The double tail probability
rejected, and the average sports scores of the class cannot be considered as not significantly higher than 88.At the same time, the fact that 88 points is higher than the lower limit of the 95% confidence interval also confirmed this conclusion.
[image:5.612.103.522.174.243.2]5.2. Gender on football scores of the single factor variance analysis results
Table 6: Gender on football scores of the single factor variance analysis
Sum of Squares df Mean Square F Sig.
Between Groups 585.265 1 585.265 16.260 .000
Within Groups 1043.832 29 35.994
Total 1629.097 30
Table 6 shows the single factor analysis results of gender on the football performance. We can see that the observed variable, football score’s sum of squared deviations is 1629.097. If the single-factor impact of gender is considered only, the explained variation of gender is 585.265 among the total variation of the football scores. The variation caused by sampling error is 1043.832, and their variances are 585.265 and 35.994. The result of the division between the two variances reach the F
statistic observed value, 16.260. The corresponding probability P-value is approximately zero. If we set significant level of 0.05, consider that the probability P-value is less than the significance level, we should reject the null hypothesis and come to the conclusion that gender has a significant impact on the football scores, and the effect of gender on the football scores are not all zero.
[image:5.612.101.525.403.470.2]5.3. Binomial distribution test of the swim pass rate
Table 7: Binomial distribution test result of the swim pass rate Binomial Test
Category N Observed Prop. Test Prop. Asymp. Sig. (1-tailed)
swimming
Group 1 <= 60 2 .1 .9 .000a,b
Group 2 > 60 29 .9
Total 31 1.0
a. Alternative hypothesis states that the proportion of cases in the first group < .9.
b. Based on Z Approximation.
From the above Table 7 we can see that among the scores of 31 students, 29 pass and 2 fail. The actual ratio of the pass rate is 0.9 and the examination pass rate is 0.9. Due to the small sample size, the test values and observed values are
exactly the same, so we consider the swim pass rate of the class reach 90%.
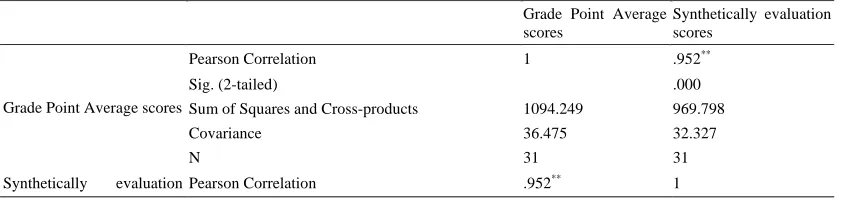
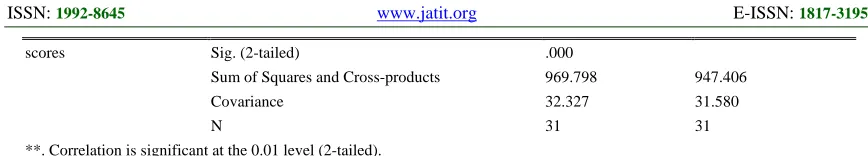
[image:5.612.101.522.628.727.2]6. THE CORRELATION COEFFICIENTS FOR GRADE POINT AVERAGE SCORES AND SYNTHETICALLY EVALUATION SCORES
Table.8 Result of the correlation coefficients for Grade Point Average scores and synthetically evaluation scores Correlations
Grade Point Average scores
Synthetically evaluation scores
Grade Point Average scores
Pearson Correlation 1 .952**
Sig. (2-tailed) .000
Sum of Squares and Cross-products 1094.249 969.798
Covariance 36.475 32.327
N 31 31
scores Sig. (2-tailed) .000
Sum of Squares and Cross-products 969.798 947.406
Covariance 32.327 31.580
N 31 31
**. Correlation is significant at the 0.01 level (2-tailed).
[image:6.612.90.524.75.153.2]
Table 8 shows that the simple correlation between Grade Point Average scores and synthetically evaluation scores is 0.952, and there is a strong positive correlation between them with the probability of the correlation coefficient test P-value of approximately 1, and both present strong correlation. The two asterisks (**) in upper corner of the correlation coefficient indicates the significance level of 0.01, while one asterisk (*) in the same position shows rejection of the null hypothesis when significance is 0.05. Therefore, a correlation coefficient with two asterisks has more possibility of mistakes than with one when reject the null hypothesis
7. CONCLUSION
The article introduces the SPSS software into statistic analysis of PE teaching score, and has a good grasp of the current situation of the students in a variety of sports performance. It provides a basis for teachers to specify new teaching programs scientifically and rationally in the future, and help improve the physical quality and sports level among university students.
ACKNOWLEDGMENT
Fund: Jiaxing Vocational Technical College hospital level subjects.
REFERENCES:
[1] Zhen tong Lv, Ling yun Zhang, “Statistic analysis and application of SPSS”, Machinery Industry Press, 2009, pp.256-266.
[2] Nancy L. Leech, Karen C. Barrett, George A. Morgan, “SPSS for Intermediate Statistics Use and Interpretation”, Publishing house of electronics industry, 2009, pp.120-130.
[3] Yan ling Sun , Yuan He, “SPSS statistic analysis”, Beijing: Posts and Telecom Press, 2010, pp.98-111.
[4] Xian wei Rong, Xiao yan Yu, “use of spss software in transacing data from physical
experiment”, natural science journal of harbin normal university, Vol.06, 2000, pp.12-18. [5] Liu X.R., “The establishment and principle of
basketball defense quality evaluation index system”, Journal of Shenyang Sport University, Vol.30, No.5, 2011, pp.37-142.
[6] Li C.L., “On strategy of improving aggressive defense capability at basketball game”, Journal of Weinan Teachers University, Vol.26, No.10, 2011, pp.83-85.
[7] M. Klusemann, T. Fay, D. Pyne,et al., “Relationship between functional movement screens and physical performance tests in junior basketball athletes”, Journal of Science and Medicine in Sport, Vol.14, No.1, 2011, pp.109-110.
[8] Shahzad T. B, Mehdi S., “The Effect of Instructional and Motivational Self-Talk on Performance of Basketball's Motor Skill”,
Procedia - Social and Behavioral Sciences, Vol.15, No.1, 2011, pp.3113-3117.
[9] Yeshayahu H, Anat C.G, Shunit R., “Psychosocial effects of reverse-integrated basketball activity compared to separate and no physical activity in young people with physical disability”, Research in Developmental Disabilities, Vol.34, No.1, 2013, pp.579-587. [10]Claudio R, Sabina G, Maria A. D'A,et al.,
“Relationship between biological markers and psychological states in elite basketball players across a competitive season”, Psychology of Sport and Exercise, Vol.13, No.4, 2012, pp.509-517.
[11]Song L., “Discussion on the basketball players' individual defensive ability and its cultivation”,
Journal of Shandong Institute of Commerce and Technology, Vol.11, No.2, 2011, pp.95-96. [12]Chang Y.T, Pei X.P, Xia Q.H., “Study on
basketball offensive defense under new rules”,