ISSN: 1992-8645 www.jatit.org E-ISSN: 1817-3195
AN INTEGRATED APPROACH TO DETERMINATE DESIGN
QUALITY TARGETS IN NEW PRODUCTS DEVELOPMENT
PROCESS
1JIHONG PANG, 2XIAOJING LIU, 3GUOQUAN LIU
1
College of Mechanical and Electronic Engineering, Wenzhou University, Wenzhou, 325035, China
2School of City, Wenzhou University, Wenzhou, 325035, China
3School of Mechanical and Electronic Engineering, East China Institute of Technology, Nanchang, 330013,
China
ABSTRACT
The key to improve the competitive ability of manufacturing companies is how to develop high quality product for their customers. So, the selection of product quality and technical parameters is very important for meeting with the customer requirements (CRs). However, the selection process is a complex and difficult task. The aim of this study is to propose a comprehensive decision model to help product designers. Firstly, the analytic network process (ANP) is used to compute the weights of CRs. Then, quality function deployment (QFD), an effective optimization technique, is applied to transform CRs into product design technical characteristics (TCs). Finally, the relationships between CRs and TCs are considered in QFD during the inference process. A numerical example is given to prove the validity of the proposed synthesis methodology through a study of engineering machinery engines.
Keywords: Design Quality, Products Development, Customer Requirements, Analytic Network Process, Quality Function Deployment
1. INTRODUCTION
With the intensifying of world competition, increasing customer needs and technological innovation stimulate changes in design targets of product quality. Moreover, the development of economic globalization and the new economy gave consumers more choices and raised their needs for higher product quality[1]. A growing number of studies have demonstrated that the importance of designing new products must meet the needs of our clients. The successful products enjoy high reputation for their perfect design and high quality[2]. Thus, the excellent manufacturing enterprise must continuously provide their customers with high-quality products and complete corresponding technological support[3]. The aim of product quality is to meet the needs of our customers and accommodate business goals and technical constraints. Besides, product development staff must have quality in mind during new products development process, seeking least-cost means to ensure design quality of the desired TCs[4].
Although there are many researches and propositions about the product quality in product development, study of the substantial integration of
the design methods are quite necessary and very important. Firstly, it is also most important that we can systematically identify user requirements. The requirements definition phase determines what of the product design[5]. Second, how to transform precisely customer demand importance and satisfaction into product design TCs is the key to success in the product design process[6].
In this paper, the judging principle and method of design quality is firstly discussed based on customers’ demand and TCs. The importance of CRs is confirmed by analytic network process (ANP), a multiple criteria decision-making method, which has been applied to many similar decision making[7]. Because Quality function deployment (QFD) has been successfully used as a powerful technique for performing the translation of customer needs into product design requirements, it was applied to guarantee the quality of products during the early stages of the design process[8].
ISSN: 1992-8645 www.jatit.org E-ISSN: 1817-3195 varied by a numerical example. Section 4 presents
the conclusions to this study.
2. LITERATUREREVIEWOFANPAND
QFD
2.1 Literature Review Of ANP Method
The reason for choosing ANP as our approach for sorting CRs is due to its interdependency allowance. ANP was firstly developed by Saaty in 1996[9]. ANP is a general principle of relative measurement used to derive composite priority ratio scales from the impudence of each element. The elements can interact with the control criterias in many ways. ANP is a multi-criteria decision-making tool that can be used to accommodate interactions among multiple attributes.
From the side to compare with analytic hierarchy process (AHP), ANP method can overcome problems arising from possible dependency among and between different levels of attributes. A looser network structure of ANP was applied to make it possible for decision makers stating any problem without concern for priority order in a hierarchy. Over the past years, ANP has been used successfully by numerous authors for solving different types of problems in various fields. The ANP method was successfully applied to evaluate best available techniques in factor multi-object decision-making process[10]. The selection of the best non-traditional machining (NTM) process for a machining application was required by using ANP method[11]. With the increasing of the demand of energy, a decision model based on analytic network process was used to assess strategic energy policies in Turkey[12].
This paper presents the application of ANP to sort the available importance of customers for product quality. The algorithm of ANP consists of mainly four stages for acquiring the weights of customers' requirements.
Stage 1: Defining decision problem
Firstly, the decision problem is structured with control criteria, clusters and elements. Then, relations between each element have to be identified for specific products requires.
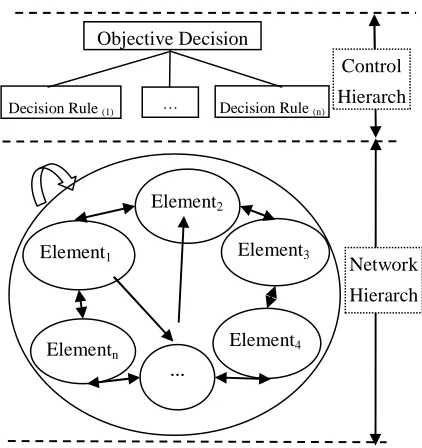
Stage 2: Structuring network structure model The hierarchical structure of the ANP model is named as network control hierarchical model, which includes control hierarchy and network hierarchy, as is shown in Figure 1.
Element1
Elementn
… Element2
Element3
Element4
Objective Decision
Decision Rule (1) … Decision Rule (n)
Control Hierarch
[image:2.612.313.524.151.375.2]Network Hierarch
Figure 1: Hierarchy Structure Model Of ANP
Stage 3: Calculating weighted super matrix
After the hierarchy structure model of ANP was built, super matrix was applied to find relative stabilized weights between each element. It is supposed that there are multiple elements among control hierarchy, named as C1, C2, ... , CN, and
each Ci also includes the elements of Sci1, Sci2, …,
Scini, i=1, 2, …, N. So, the control elements of super
ISSN: 1992-8645 www.jatit.org E-ISSN: 1817-3195
1 2
1
2
1 2 N
11 12 1 21 22 2 1 2
11
1 12 11 12 1N
1
21
2 22 21 22 2N
2
1
N 2 N1 N2 NN
C C C
Sc Sc Sc Sc Sc Sc Sc Sc Sc
Sc
C Sc W W W
Sc
Sc
C Sc W W W
Sc
Sc
C Sc W W W
Sc
n n N N NN
n n N N NN L
L L L L
L
M
L
M
M M M M O M
L
M
Next, the weighted super matrix can be calculated by using the method of latent root. This is done by using the following expression:
( )
( 1) ( 2) ( 3)
1 1 1 1
( )
( 1) ( 2) ( 3)
2 2 2 2
( )
( 1) ( 2) ( 3)
3 3 3 3
( )
( 1) ( 2) ( 3)
W
j
j
j
j
i i i i
jn
j j j
i i i i
jn
j j j
i i i i
jn
j j j
ij i i i i
jn
j j j
in in in in
w w w w
w w w w
w w w w
w w w w
= L L L
L L L L L
L
Where i is the impact of the matrix for the j-th hierarchical elements.
Stage 4: Getting decision weight
After the super and weighted super matrix were reduced and normalized, we can get precisely the decision weight of the user's requirement.
2.2 Literature Review on Applications of QFD
QFD was firstly defined in 1972 at Mitsubisshi’s Kobe shipyard in Japan[13]. Among the many tools, QFD is a well-known planning method commonly used for interpreting the customer requirements into product technical characteristics. The goal of QFD is to provide an effective tool for manufacturing enterprise assuring product quality and improving their customer satisfaction[14]. QFD focuses on delivering “voice of the customer” to product specification, and helps design engineers to adopt a more customer-driven perspective in the process of conceptual design. QFD is usually used for determining and assessing the relationships between CRs and TCs.
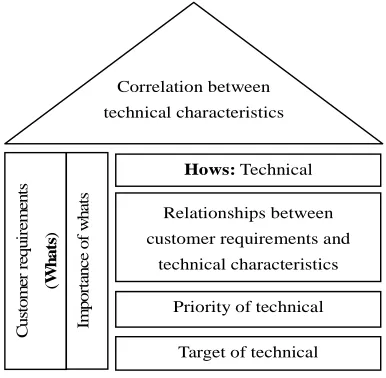
Since QFD is successful in designing high quality products resulting in customer satisfaction, it is widely used in different industries world-wide[15]. The process of QFD can be represented graphically by using quality of housing (HoQ) [16]. The basic constructs of HoQ is shown in Figure 2.
Correlation between
technical characteristics
Hows: Technical
Relationships between
customer requirements and
technical characteristics C u st o m er r eq u ir e m en ts (W h a ts ) Im p o rt an c e o f w h a ts
Priority of technical
[image:3.612.320.513.408.597.2]characteristics Target of technical
Figure 2: The Basic Constructs Of A Hoq
The core of QFD is how to build the HoQ. The HoQ is traditionally used to identify primary CRs and corresponding TCs for a specific product.
2.3 The Proposed Model Based on ANP and QFD
ISSN: 1992-8645 www.jatit.org E-ISSN: 1817-3195 phase, the principles of QFD are applied to
establish clear relations between customer satisfaction and product quality standard. Then, ANP is proposed as it aims at determining importance of CRs more flexible and accurate than the traditional methods. In the last part of the study, the HoQ method is used for identifying CRs, converting these requirements into available design information, ranking the TCs for design needs of product quality. The proposed model based on ANP and QFD is shown in Figure 3.
Investigating user quality standard
QFD
ANP Identifying CRs
Determining weights of CRs
Transforming CRs into TCs
HoQ
Ranking product design TCs
[image:4.612.315.509.236.475.2]Ensuring product design quality
Figure 3: The Proposed Model Based On ANP And QFD
3. NUMERICALEXAMPLE
Here, we investigate an example from a series of engineering machinery engines by using the real world data. The numerical example presents the implementation of ANP method along with QFD model. The customer requirements considered in this problem are: low fuel consumption (CRs1),
high power (CRs2), stable operation (CRs3), high
safety (CRs4), convenient maintenance (CRs5),
good environmental protection (CRs6) and
reasonable price (CRs7). In order to develop a high
quality product and then accurately determine the engineering design requirements, the weights of CRs must be confirmed objectively. So, a scoring system was added to weight the CRs based on ANP method. Basically, the importance from the customer’s perspective can be realized by using the ANP method.
The ANP was widely used in various fields as industry, agriculture and scientific technology.
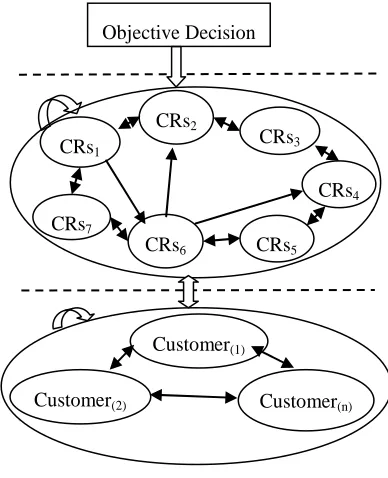
Because ANP is successfully used for modeling more complex decision environments, in this chapter we develop it for determining the relative weights. ANP is a nonlinear structure that deals with the elements and sub-elements. Firstly, the decision problem should be clearly stated by the hierarchy structure. The accuracy of decision may be improved by collecting rich data from more experts. The hierarchy structure model of CRs was built by ANP in Figure 4.
CRs1
CRs7
CRs6
CRs2
CRs3
CRs4
Objective Decision
CRs5
Customer(1)
Customer(2) Customer(n)
Figure 4: Hierarchy Structure Model Of Crs
Next, we carry out the pair-wise comparison by using 1-9 scale for each decision maker. For example, these comparisons are indicated for a customer in Table 1.
After forming pair-wise comparison matrix, weights of all criterias are determined by the help of ANP. From Table 1, these parameters are calculated the following:
[image:4.612.94.296.252.423.2]ISSN: 1992-8645 www.jatit.org E-ISSN: 1817-3195 Table 1: Pair-wise Comparison of CRs
After computing all the weights of the criteria with ANP, final weights of CRs are obtained. Based on ANP method, we can get the importance of CRs in the following:
W= [0.286, 0.125, 0.152, .074, 0.143, 0.117, 0.103] T
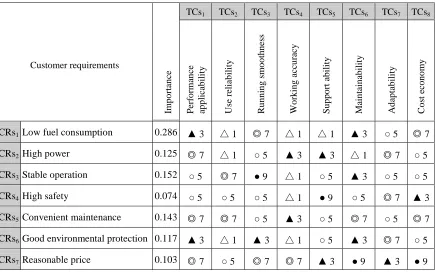
Then, HoQ of linking CRs and TCs is shown in Figure 5. From Figure 5, the mapping relations are expressed as very strong relationship (9 point, mark: ●), strong relationship (7 point,mark: ◎), medium relationship (5 point,mark: ○), medium relationship (3 point,mark: ▲) Small relationship (3 point,mark: △).
Next, the importance of product design TCs are calculated by using HoQ technique:
I(TC1)= 0.286×3+0.125×7+0.152×5+0.074×5
+0.143×7+0.117×3+0.103×7=4.936; I(TC2)= 0.286×1+0.125×1+0.152×7+0.074×5
+0.143×7+0.117×1+0.103×5=3.478; I(TC3)= 0.286×7+0.125×5+0.152×9+0.074×5
+0.143×9+0.117×3+0.103×7=6.152; I(TC4)= 0.286×1+0.125×3+0.152×1+0.074×1
+0.143×3+0.117×1+0.103×7=2.154; I(TC5)= 0.286×1+0.125×3+0.152×5+0.074×9
+0.143×5+0.117×5+0.103×3=3.696; I(TC6)= 0.286×3+0.125×1+0.152×3+0.074×5
+0.143×7+0.117×3+0.103×9=4.088; I(TC7)= 0.286×5+0.125×7+0.152×5+0.074×7
+0.143×5+0.117×7+0.103×3=5.426; I(TC8)= 0.286×7+0.125×5+0.152×5+0.074×3
[image:5.612.93.528.441.713.2]+0.143×7+0.117×5+0.103×9=6.122.
Figure 5: The HoQ of linking CRs and TCs
CR1 CR2 CR3 CR4 CR5 CR6 CR7 Characteristic
roots
CR1 1 2 2 1 3 2 5 0.259
CR2 1/2 1 1 2 1 1 1 0.131
CR3 1/2 1 1 3 1 2 3 0.179
CR4 1 1/2 1/3 1 1/3 1 1 0.087
CR5 1/3 1 1 3 1 3 2 0.169
CR6 1/2 1 1/2 1 1/3 1 3 0.107
CR7 1/5 1 1/3 1 1/2 1/3 1 0.069
Customer requirements Im p o rt an ce
TCs1 TCs2 TCs3 TCs4 TCs5 TCs6 TCs7 TCs8
P er fo rm an ce ap p li ca b il it y U se r el ia b il it y R u n n in g s m o o th n es s W o rk in g a cc u ra cy S u p p o rt a b il it y M ai n ta in ab il it y A d ap ta b il it y C o st e co n o m y
CRs1 Low fuel consumption 0.286 ▲ 3 △ 1 ◎ 7 △ 1 △ 1 ▲ 3 ○ 5 ◎ 7
CRs2 High power 0.125 ◎ 7 △ 1 ○ 5 ▲ 3 ▲ 3 △ 1 ◎ 7 ○ 5
CRs3 Stable operation 0.152 ○ 5 ◎ 7 ● 9 △ 1 ○ 5 ▲ 3 ○ 5 ○ 5
CRs4 High safety 0.074 ○ 5 ○ 5 ○ 5 △ 1 ● 9 ○ 5 ◎ 7 ▲ 3
CRs5 Convenient maintenance 0.143 ◎ 7 ◎ 7 ○ 5 ▲ 3 ○ 5 ◎ 7 ○ 5 ◎ 7
CRs6 Good environmental protection 0.117 ▲ 3 △ 1 ▲ 3 △ 1 ○ 5 ▲ 3 ◎ 7 ○ 5
ISSN: 1992-8645 www.jatit.org E-ISSN: 1817-3195 Once the importance of TCs was
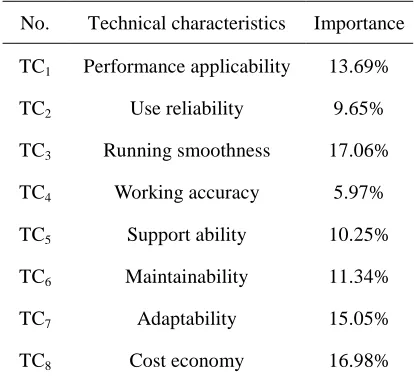
[image:6.612.88.295.182.371.2]completed from figure 5, we'll have a clearer picture of the results. These importance of design factors are given in Table 2.
Table 2: Ranking of TCs to Importance
We can see from Table 2, running smoothness (TC3) and cost economy (TC8) are the key factors for ensuring high product quality. The product design direction can be made clear through the above information analysis, and the product design quality is well improved. On the other hand, the importance order of TCs can help designers manage the optimization product design process.
4. CONCLUSIONS
A new analytical model for guaranteeing the product quality was presented in this paper. The proposed model was applied to translate CRs into product design TCs based on ANP and QFD. ANP is well-known quantitative method that was used in conjunction with QFD. The ANP method has been used to prioritize the CRs by using relative weights. Then, HoQ has been applied for selecting the optimize product design standardization. The aim of this work was to propose a novel systematic methodology to deal with the CRs and TCs in new products development process. A numerical example was presented to illustrate the application of the proposed approach. More case studies for utilizing other ranking methods with QFD should be presented in the future.
ACKNOWLEDGMENTS
This work was supported by the Provincial Natural Science Foundation, Zhejiang, China (No.Y7100680; No.Y6110542), the Provincial Public Welfare Foundation, Zhejiang, China (No.2011C31G2250024), and the Teaching Reform Project, Wenzhou University, Wenzhou, China (No.12jg59B).
REFRENCES:
[1] A. Trentin, E. Perin, and C. Forza, "Product configurator impact on product quality," International Journal of Production Economics, Vol. 135, No. 2, pp. 850-859, 2012.
[2] Qisheng Ding, M. Daokun, Daoliang Li, and Linlin Zhao, "Design and implementation of a sensors node oriented water quality monitoring in aquaculture," Sensor Letters, Vol. 8, No. 1, pp. 70-74, 2010.
[3] S. Son, S. Na, and K. Kim, "Product data quality validation system for product development processes in high-tech industry," International Journal of Production Research, Vol. 49, No. 12, pp. 3751-3766, 2011.
[4] D. Cikotiene and A. Bargelis, "Research of quality impact to the product design properties and characteristics," Mechanika, Vol. 79, No. 5, pp. 63-67, 2009.
[5] ChungHo Chen and WanLin Chang, "Optimal design of expected lifetime and warranty period for product with quality loss and inspection error," Expert Systems With Applications, Vol. 37, No. 4, pp. 3521-3526, 2010.
[6] N. Sahebjamnia, I. Mahdavi, and N. Cho, "Designing a new model of distributed quality control for sub-assemble products based on the intelligent web information system," Journal of Intelligent Manufacturing, Vol. 21, No. 4, pp. 511-523, 2010.
[7] H. Lee, C. Kim, and Y. Park, "Evaluation and management of new service concepts: An ANP-based portfolio approach," Computers and Industrial Engineering, Vol. 58, No. 4, pp. 535-543, 2010.
[8] B. Almannai, R. Greenough, and J. Kay, "A decision support tool based on QFD and FMEA for the selection of manufacturing automation technologies," Robotics and Computer-integrated Manufacturing, Vol. 24, No. 4, pp. 501-507, 2008.
No. Technical characteristics Importance
TC1 Performance applicability 13.69%
TC2 Use reliability 9.65%
TC3 Running smoothness 17.06%
TC4 Working accuracy 5.97%
TC5 Support ability 10.25%
TC6 Maintainability 11.34%
TC7 Adaptability 15.05%
ISSN: 1992-8645 www.jatit.org E-ISSN: 1817-3195 [9] D. Ergu, G. Kou, Y. Peng, and Y. Shi, "A
simple method to improve the consistency ratio of the pair-wise comparison matrix in ANP," European Journal of Operational Research, Vol. 213, No. 1, pp. 246-259, 2011.
[10] G. Giner-Santonja, P. Aragones-Beltran, and J. Niclos-Ferragut, "The application of the analytic network process to the assessment of best available techniques," Journal of Cleaner Production, Vol. 25, No. 4, pp. 86-95, 2012. [11] S. Das and S. Chakraborty, "Selection of
non-traditional machining processes using analytic network process," Journal of Manufacturing Systems, Vol. 30, No. 1, pp. 41-53, 2011. [12] M. Dagdeviren and E. Eraslan, "Priority
determination in strategic energy policies in Turkey using analytic network process (ANP) with group decision making," International Journal of Energy Research, Vol. 32, No. 11, pp. 1047-1057, 2008.
[13] J. A. Carnevalli and P. C. Miguel, "Review, analysis and classification of the literature on QFD-Types of research, difficulties and benefits," International Journal of Production Economics, vol. 114, No. 2, pp. 737-754, 2008.
[14] LiangHsuan Chen and WenChang Ko, "Fuzzy approaches to quality function deployment for new product design," Fuzzy Sets and Systems, Vol. 160, No. 18, pp. 2620-2639, 2009. [15] HaoTien Liu and ChihHong Wang, "An
advanced quality function deployment model using fuzzy analytic network process," Applied Mathematical Modelling, Vol. 34, No. 11, pp. 3333-3351, 2010.