http://dx.doi.org/10.4236/ojce.2016.61006
Elastic and Inelastic Response of Structural
Systems in Seismic Pounding
N. U. Mate1, S. V. Bakre2, O. R. Jaiswal2, K. K. Sayyad1
1Civil Engineering Department, Amrutvahini College of Engineering, Sangamner, India
2Department of Applied Mechanics, Visvesvaraya National Institute of Technology (VNIT), Nagpur, India
Received 15 February 2016; accepted 26 February 2016; published 29 February 2016
Copyright © 2016 by authors and Scientific Research Publishing Inc.
This work is licensed under the Creative Commons Attribution International License (CC BY).
http://creativecommons.org/licenses/by/4.0/
Abstract
The present paper addresses the comparative study of three adjacent single-degree-of freedom structures for elastic and inelastic system with and without pounding under seismic excitations. For the gap between three adjacent structures, the simulation is done by using linear spring ele-ment without damping. The entire numerical simulation is done in time domain by considering the inputs of four real ground motions. The results of the study show that the response of elastic system is much different to that of response of inelastic system in the absence and presence of pounding, especially in lighter or more flexible structures. Elastic structures show much severe pounding response than inelastic structures. Modeling of colliding structures behaving inelasti-cally is really needed in order to obtain the accurate structural pounding involved response under seismic excitation.
Keywords
Seismic Pounding, Gap Element, MDOF Elastic and Inelastic Stick System, Time History Analysis, Spectral Acceleration Response
1. Introduction
re-vealed that pounding was a major factor for structural damages in over 3% - 4.5% of the 330 collapsed or se-verely damaged buildings under survey, and 15% of all cases suffer major damages. This single earthquake gives a momentum for understanding and studying this particular problem of pounding, which ultimately results in gaining a more research contribution on pounding problem in the latter years after 1988.
Although the pounding is a very complex phenomenon, which escorts several doubts in its numerical model-ing, in the recent years this problem is extensively studied by applying various structural modes and using dif-ferent models of collisions. The preliminary studies of pounding carried out by many researchers in the earlier days before the arrival of powerful softwares were done on lumped mass models. The fundamental study on seismic pounding between the adjacent buildings in series was performed by Anagnostopoulus [4], where the structures were modeled as single-degree-of-freedom (SDOF) system and collisions were simulated by using li-near viscoelastic gap elements. A parametric investigation was conducted and it showed that the end structures experience severer response than interior structures of the series.
Pentelides and Ma [5] have studied the dynamic behavior of damped SDOF elastic and inelastic structures subjected to one-side pounding incidences during an applied ground excitation; the pounding forces are simu-lated by considering Hertz contact gap element. The effects of gap distance and inelastic structural behavior on the magnitude of pounding forces were evaluated in the published paper. Davis [6] has conducted a numerical investigation on damped SDOF structure impacting against a rigid barrier. Jankowski [7] has presented impact force response spectrum for two adjacent structures, in which pounding force has plotted as an ordinate against the structural vibration period along abscissa.
Maison and Kasai [8] have studied the response of light high rise MDOF building colliding against the mas-sive low rise structures; the pounding forces were calculated only at the top of low rise structures, where it was connected with the adjoining structures by means of linear spring; and in other location of low rise structures no springs were put. Various analytical models based on contact force mechanism and steromechanical mechanism considered for the seismic pounding response of adjacent structures were studied by Muthukumar and De-sRoches [9]. The results presented were established for two degrees of freedom linear oscillator to determine the effect of impact modeling strategy, system period ratio, peak ground acceleration and energy loss during impact on the system responses.
Mouzakis and Papadrakakis [10] have investigated the linear and nonlinear structural response of three-di- mensional adjacent buildings with aligned rigid horizontal diaphragms. The developed formulation takes into account the three-dimensional dynamic contact conditions for velocities and accelerations based on impulse- momentum relationships using the coefficient of restitution and steromechanical approach. Pant and Wijeye-wickrema [11] have carried out the study on three-dimensional simulation of seismic pounding between the RC moments resisting frame considering material as well as geometrical nonlinearities.
In the present paper, the formulations of SDOF for one sided and both sided pounding incidences are pre-sented in details. Both elastic and inelastic material behaviors of the SDOF structures have been considered. The equation of motion of SDOF system for both side pounding is being solved using a computer program devel-oped for this purpose in MATLAB [12]. Few sets of solutions of inelastic response obtained from computer program are also compared with SAP 2000NL software [13] results and with referred publication as well.
2. Models for Impact Simulations and Mathematical Formulation of Fixed Base
Inelastic SDOF Structure
Therefore, in the present paper pounding force investigations should be done as per the contact force mechan-ism by using linear spring model with some stiffness but no damping.
2.1. Linear Spring Model
A linear impact of stiffness (kL) can be used to simulate impact once the gap between adjacent structures closes.
The impact force (Fc) at time “t” is given by
( )
( )
c L
F t =k δ t , (1)
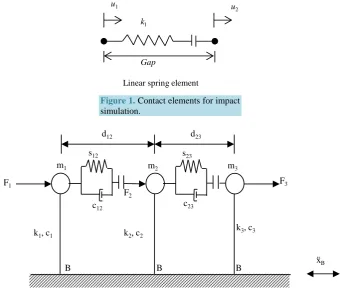
where, δ(t) is the interpenetration depth/overlapping distance of the colliding bodies. This approach is relatively straightforward and can be easily implemented in any commercial available software. However, the energy loss during impact is not taken into account. This model is shown inFigure 1 which has been extensively used for impact simulation by Maison and Kasai [8] in their research work.
2.2. Mathematical Formulation of Fixed Base Inelastic SDOF Structure
The theoretical formulation for modeling of three adjacent fixed base SDOF damped inelastic structure is pre-sented here. The middle structure out of these three adjoining structures are undergoes in both side pounding in-cidences, whereas the other two structures suffers only one side pounding effects. As shown inFigure 2, the adjacent structures are modeled as SDOF systems with lumped masses m1, m2 and m3 respectively. The
struc-tures shown are separated by distances d12 between the first and the second structure and d23 between the second
and the third structure. The stiffnesses of the three structures are k1, k2 and k3 and linear viscous dashpot
con-stants for the structures are c1, c2 and c3, respectively. Impact between the three buildings has been modeled by
introducing a spring and a linear viscous dashpot between the colliding structures which corresponds to a spe-cific model explained in Section 2. The stiffness of the spring between the first two structures is s12 and that
be-tween the last two structures is s23. The corresponding dashpot constants are c12 and c23. These elements act only
[image:3.595.142.484.414.709.2]when collision occurs.
Figure 1. Contact elements for impact simulation.
Figure 2. Schematic diagram of the three adjacent fixed base SDOF structures. u2
u1
kl
Gap
Linear spring element
d12 d23
F1
F2
F3
m1 m2 m3
s23 s12
c12 c23
k1, c1 k2, c2
k3, c3
The incremental governing equations of dynamic contact motion considering one sided pounding due to seis-mic input at time “t” can be written as:
( )t ( )t
( )
CD( )
CE( )
g( )
Mu +Cu +q t +F t +F t = −M uι t (2)
where, 1
2
mass mat ix 0 0
r m
m
M = =
;
1
2
damping matrix 0 0
c c
C= =
;
( )
1
2
inelastic force vector
q
t q
q = =
;
( )
( )
D
C Ck
F t = u t , E
( )
12 12C K uk s
F t = − d l are impact force caused by the damper and spring; 1 1
ι= ;
1
1
l= − ; 12 1 1 1 1 k
C =c − −
; 12
1 1
1 1
k
K =s − −
; u( )t =acceleration vector; u( )t =velocity vector; and
( )
input ground acceleration vectorg
u t = .
The solution of the Equation (2) for SDOF system subjected to one side pounding is obtained using average acceleration Newmark-Beta method (implicit method). The incremental quantities in the above equation are the change in the responses from time “t” to “t + ∆t”.
Newmark method adopts approximation as following;
(
)
2
1 0 1
1
0 2 1 2
t t t t t t
t t t t t t t
u u u u
u u u t u u t
γ γ γ
β β β
+∆ +∆ +∆ +∆ = + − + ≤ ≤ = + ∆ + − + ∆ ≤ ≤
(3)
The parameters that define the acceleration changes in the time step (∆t), and also decide the stability and ac-curacy of Newmark method. When typical values are setting γ = 1/2 and 1/6 ≤ β ≤1/4 (in the current study β is considered as 1/4), from all points of view including accuracy, the results are satisfactory.
The equilibrium equation at time t + ∆t is express as follows:
(
)
(
)
(
)
(
)
( ) ( )
D E
t t t t C C g
Mu +∆ +Cu +∆ +q t+ ∆ +t F t+ ∆ +t F t+ ∆ = −t M uι t+ ∆t (4)
(t t)
u +∆ and u(t+∆t) can be obtained by solving Equation (2). After submitting them into Equation (4) and
some algebra, we can obtain
t t
Ku+∆ =P (5)
where,
(
)
0 1 0 1 no impact during impact k kq a M a C
K
q K a M a C C
= + + = + + + +
(
)
(
)
(
)
(
)
(
)
(
)
(
)
0 ( ) 2 ( ) 3 ( )
1 ( ) 4 ( ) 5 ( )
12 12 0 ( ) 2 ( ) 3 ( )
1 ( ) 4 ( ) 5 ( )
no impact
during impact
g t t t
t t t
g t t t
k t t t
M u t t M a u a u a u
C a u a u a u
P
M u t t s d l M a u a u a u
C C a u a u a u
ι ι = − + ∆ + + + + + + = − + ∆ ± + + + + + + +
ut+∆t can be obtain by solving Equation (5), u(t+∆t) and u(t+∆t) also can be obtain according expression as
follows:
(t t) ( )t 6 ( )t 7 (t t)
u +∆ =u −a u −a u +∆ (6)
(t t) 0
(
(t t) ( )t)
2 ( )t 3 ( )tu +∆ =a u +∆ −u −a u −a u (7)
where, 0 2 1 a
t
β =
∆ ; a1 t2
γ β =
∆ ; 2
1
a t β =
∆ ; 3 1
1 2 a
β
= − ; a4 1
γ β = − ; 5
1 1 2 a t β = − ∆
; a6 = ∆t
(
1−γ)
;Impact force also can be obtained as follows:
(
)
( ) ( ) 12 12c k t t k t t
F t+ ∆ =t C u +∆ +K u +∆ −s d l (8)
Thus, we can get all the desired results, e.g. displacements, velocity, acceleration and impact force.
Wen [16] proposed the equation for modeling non-linear hysteretic force-deformation behavior, in which the force q(t) (as mentioned in Equation (2) is calculated as
( )
0(
1)
q t =ak∆ + −u a Q Z∆ (9)
where, k0 is the initial stiffness; α is the non-dimensional ratio of post to preyeilding stiffness; ∆u is the
incre-mental displacement; Q is the yield strength; and ∆Z is a non-dimensional hysteretic component satisfying the non-linear first order differential equation expressed as
(
)
1 d , d n n y Zu u Z Z u Z A u g u Z
t β τ
−
= ∆ − ∆ + ∆ = ∆ (10)
where, β, τ, A and n are the dimensional parameter which control the shape of the hysteretic loop; uy is the yield
displacement and ∆u is the incremental displacement. The ∆Z which can be obtained by solving the differen-tial Equation (9) using the fourth order Runge-Kutta method by
(
)
0 ,
t y
K = ∆tg ∆u Z u (11)
(
/)
1
2
0
, 2
t t t
y
K = ∆tg ∆u+∆ Z +K u (12)
(
/)
2
2
2
, 2
t t t
y
K = ∆tg ∆u+∆ Z +K u (13)
(
)
3 , 2
t
y t t
K = ∆tg ∆u+∆ Z +K u (14)
0 2 1 2 2 3
6
K K K K
Z + + +
∆ =
For elasto-plastic force deformation characteristics, the values of Wen’s parameters are taken as β = τ = 0.5; A
= 1 and n = 15. In this analysis, buildings are modeled as shear buildings and do not include frame action. Any rotation of the buildings is also neglected.
3. Description of Problem
As an example, the study presented in this paper is focused on pounding between three adjacent fixed-base li-near elastic and elasto-plastic SDOF structures by using various contact element approach for the impact simu-lation. The results of MATLAB program obtained through the analysis of SDOF structure are verified using SAP 2000NL software and referred published work. The basic study is done for elastic and inelastic (elasto- plastic) structures with and without pounding by considering linear spring gap element for pounding simula-tions,
Structural Properties
m1 = 2500 kg, m2 = 4500 kg, m3 = 9800 kg, natural frequency of left structure ω1 = 1 Hz, natural frequency of
middle structure ω2 = 2 Hz, natural frequency of right structure ω3 = 3 Hz, damping ratio (𝜉𝜉) = 5%, damping
constant (c) = 2mωn𝜉𝜉, yield strength of left structure Q1 = 6810 N, yield strength of middle structure Q2 = 15,633
N and the yield strength of right structure Q3 = 38,301 N.
The properties of linear oscillators were taken from published paper of Mate et al. [17].
Gap Element Properties
with small impact forces. Therefore, the solution difficulty occurs from the large changes in stiffness upon im-pact or contact loss, thus resulting in large unbalanced forces affecting the stability of the assembled equation of motion. Here, the value of gap element stiffness is taken as s12 = s23 = 500,000 N/m for model. Separation
dis-tance of all adjoining structures is considered to be constant as d12 = d23 = 0.025 m. The Impact forces are
calcu-lated from the respective pounding force equation of each model.
The characteristics of four real-earthquakes used for the present study are given in Table 1. All the records are taken from the PEER strong motion database (http://peer.berkeley.edu/smcat/). The ground motion records selected for the present work are in moderate range having PGA 0.35 g to 0.5 g (g = acceleration due to gravity 9.81 m/sec2). The output of the time domain analysis is measured in terms of floor displacement and impact forces at the pounding levels for the entire duration of time history at an interval of 0.02 second. The floor acce-leration response spectra plots for selected cases are also presented and discussed in the next section.
4. Results and Discussions
Analytical study of the adjacent SDOF structures is carried out using a computer program developed in MATLAB and their results are presented in this section. The basic analytical study is done between elastic and inelastic (elasto-plastic) structures with and without TMD by considering linear spring gap element mechanism for impact simulation for all four ground motion excitations. Prior to carry out the proposed analytical work, some validation study for the developed MATLAB program is also presented here.
4.1. Validation of MATLAB Program Solution with SAP 2000NL Results
Validation of MATLAB program is carried out in two stages, the first stage of validation of MATLAB program is done on SAP 2000NL software results. In the first stage validation stick models are considered as inelastic in nature. While in second stage of validation, the developed MATLAB program results are compared with some standard published paper results.
The first stage of validation as mentioned earlier is done for Model I (linear spring impact simulation model) only of Section 3. For the stick models of three adjacent damped SDOF structure (with or without pounding) of Model I, the structural and gap element properties are taken same as that mentioned in Section 3. It is to be noted here that SAP 2000NL has some limitation such as it can model the adjacent buildings by using the linear spring gap element or by appropriate spring-damper gap element only in which the damping is constant throughout process of time integration. Thus, it is understood that SAP 2000NL can model the structure for li-near or Kelvin impact simulation techniques only. However, apart from this limitation, it can very easily repro-duce the results for Model I with reasonable degree of accuracy. So, in the present paper the Model I is consi-dered for comparison of results. For this validation following two cases are consiconsi-dered.
Case 1—Model I is analyzed by developing MATLAB program (MATLAB Model) Case 2—Model I is analyzed on SAP 2000NL software (SAP Model)
Relative study of Model I is developed for fixed-base SDOF structures considering the Northridge ground motion. The results of comparison between SAP model and MATLAB program are presented inFigure 3.
Table 1. Characteristics of real earthquakes used for the present study.
Captions of recorded ground
motion
Year
Absolute acceleration component in terms of “g”
(9.81 m/s2)
Duration (seconds) Recording station and data source
Northridge 1994 0.424 24.42 Northridge station 0655, Data source: USGS.
Cope Mendocino 1992 0.385 36 Station: Rio Dell overpass, (CDMG station
89324).
Loma Prieta 1989 0.484 40 Station: Coyote lake dam SW Abut, 285,
(CDMG station 57217).
Superstition Hills 1987 0.356 40 El Centro Imperial Co Center, (CDMG
(a)
(b)
(c)
Time (sec) 0
0.05
0.00
−0.05
−0.10
−0.15
−0.20
−0.25
D
is
p
la
ce
m
e
n
t (
m)
3 6 9 12 15
3
0 6 9 12 15Time (sec) 0.10
0.05
0.00
−0.05
−0.10
−0.15
−0.20
−0.25
D
is
p
la
ce
m
e
n
t (
m)
Time (sec) 0.03
0.02
0.01
0.00
−0.01
−0.02
−0.03
D
is
p
la
ce
m
e
n
t (
m)
(d)
(e)
(g)
[image:9.595.176.482.76.529.2](h)
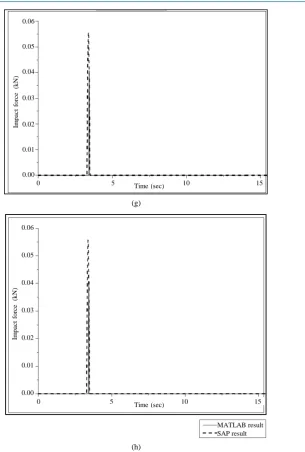
Figure 3. MATLAB program response validation of inelastic three ad-jacent structures with SAP software. (a) Displacement time history plot of left building with pounding; (b) Displacement time history plot of left building without pounding; (c) Displacement time history plot of middle building with pounding; (d) Displacement time history plot of middle building without pounding; (e) Displacement time history plot of right building with pounding; (f) Displacement time history plot of right building without pounding; (g) Impact force time history plot between left-middle buildings; (h) Impact force time history plot between mid-dle-right buildings.
From the comparative results, it is noted that the response of Model I obtained from SAP 2000NL and also from MATLAB code are in good agreement. The displacement response of SDOF structures obtained from MATLAB program is much identical to that of the response of SAP 2000NL software. The results of number of collisions and magnitude of impact forces between the adjacent structures in both the cases are reasonably matches to each other. Number of contacts between left and middle structure of SAP model and MATLAB pro-gram is 9 and 10 respectively; whereas the number of collisions between middle and right structures obtained
Im
p
act
f
o
rce
(kN
)
0 5 10 15Time (sec) 0.06
0.05
0.04
0.03
0.02
0.01
0.00
Im
p
act
f
o
rce
(kN
)
0 5 10 15Time (sec) 0.06
0.05
0.04
0.03
0.02
0.01
0.00
from SAP and MATLAB model is 10 and 12 respectively. As per as magnitude of impact forces are concerned, the left-middle structure interaction gives 4.44 kN and 4.08 kN impact forces respectively, while the middle- right structure interaction produces 40 N and 55 N impact forces respectively. But after referring the values of peak impact forces of both the cases, one can easily find slight discrepancies between the values of SAP and MATLAB results that’s because of no control over the software default properties. Thus, from this part of vali-dation work, it is observed that for the preliminary investigation of pounding in inelastic structures, the SAP 2000NL software is much considerable option for the seismic analysis. Moreover, it is also noted that the results of the formulation of MATLAB code are much satisfactorily matches with the result of SAP 2000.
The second stage of validation for the developed code of MATLAB is done for Model IV (Hertz impact si-mulation model) with the following structural and gap element properties as mentioned by Pantelides and Ma
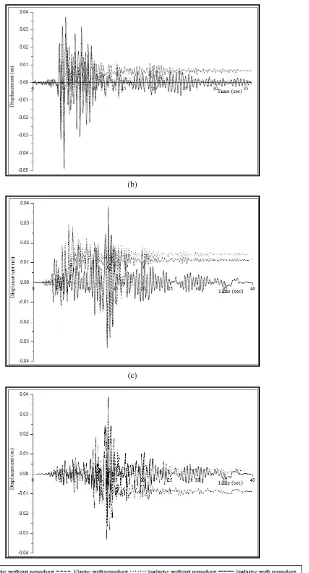
[5]. The Model IV results are evaluated for El Centro ground motion input. The results of MATLAB code are compared with the published paper results of Pantelides and Ma [5]. The results are noted in terms of pounding force time history (referFigure 4) and displacement time history (seeFigure 5) at floor levels of left flexible building. A SDOF structural system is used for one sided pounding, left structure is considered as flexible one and it is collided over the right extremely rigid structure. The inelastic structural systems has been considered by the authors in the published papers, there details are given below.
Structural and gap element details: mass of left flexible structure is 87,550 kg, stiffness of left flexible system is 3500 kN; yielding ductility ratio of inelastic left system is 4; time period of rigid right structure is very small nearly equal to zero; damping ratio of left system is 2% critical; separation distance between adjacent structural units is 0.025 m; and impact stiffness parameter of hertz contact element is 80,000 kNm−3/2.
After the careful assessment ofFigure 4 andFigure 5, it is observed that the MATLAB code is much accu-rate and it could be used reasonably for to predict the pounding response of adjacent structures under any impact simulation techniques. FromFigure 4, it is noted that the peak displacement of left SDOF structure in absence and presence of pounding as per the published paper by Pantelides and Ma [5] is around 0.127 m and −0.124 m respectively, while in developed program, these are obtained as 0.135 m and 0.115 m respectively, so displace-ment response of SDOF structure of MATLAB code are in good agreedisplace-ment with results of Pantelides and Ma
[5]. However, some disagreement in displacement results is due to the fact that the time step size considered by Pantelides and Ma [5] is not known. In the present analysis the time step size is taken as 0.02 second.Figure 5
shows that the maximum impact force between two adjoining flexible and rigid SDOF structure at floor level of referred paper is almost 1205 kN (with number of impacts equal to 2), however in MATLAB program this val-ues is obtained as 1103 kN (with number of impacts equal to 3). That means the developed MATLAB code gives consistent pounding forces as that of Pantelides and Ma [5] results. But here, one particular observation is that the numbers of pounding forces obtained by the Pantelides and Ma [5] work are slightly lower than the MATLAB results, that’s again due to the same reason of undefined time step size of time history analysis by the Pantelides and Ma [5] paper.
4.2. Comparative Study of Elastic and Inelastic Three Adjacent SDOF Structures
(a)
[image:11.595.179.480.82.473.2](b)
Figure 4. Displacement time history validation of MATLAB program with the results of Pentelides and Ma [1998]. (a) Results of MATLAB program; (b) Results of published paper of Pentelides and Ma [1998].
(a)
0 5 10 15 20 25 30 Time (sec)
1100
1000
900
800
700
600
500
400
300
200
100
0
Im
p
act
f
o
rce
(
k
N
(b)
Figure 5. Impact force time history validation of MATLAB program with the results of Pentelides and Ma [1998]. (a) Results of MATLAB program; (b) Results of published paper of Pentelides and Ma [1998].
(a)
(b)
0 5 10 15 20 25 30 Time (sec)
1.4
1.2
1.0
0.8
0.6
0.4
0.2
0
P
o
u
n
d
in
g
(M
(c)
[image:13.595.152.530.80.474.2](d)
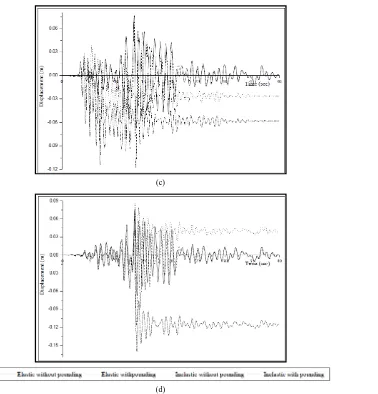
Figure 6. Displacement-time history plots of elastic and inelastic left structure (consider gap of 0.025 m and Model I for this study). (a) Response from Northridge ground motion; (b) Response from Cope Mendocino ground motion; (c) Response from Loma Prieta ground motion; (d) Response from Superstition Hill ground motion.
(b)
(c)
[image:14.595.180.489.81.654.2](d)
(a)
(b)
(d)
Figure 8. Displacement-time history plots of elastic and inelastic right structure (consider gap of 0.025 m and Model I for this study). (a) Response from Northridge ground motion; (b) Response from Cope Mendocino ground motion; (c) Response from Loma Prieta ground motion; (d) Response from Superstition Hill ground motion.
(a) (b)
(c) (d)
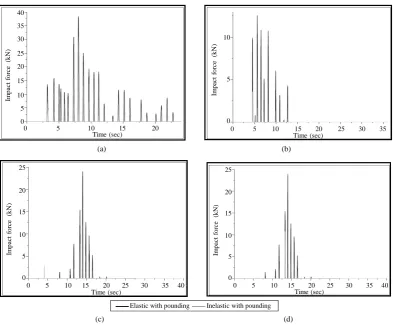
Figure 9. Impact force time history plots due to the pounding interaction between elastic and inelastic left-middle structure (consider gap of 0.025 m and Model I for this study). (a) Response from Northridge ground motion; (b) Response from Cope Mendocino ground motion; (c) Response from Loma Prieta ground motion; (d) Response from Superstition Hill ground motion.
0 5 10 15 20 40 35 30 25 20 15 10 5 0 Im p act f o rce (kN )
Time (sec) 0 5 10 15 20 25 30 35 10 5 0 Im p act f o rce (kN ) Time (sec)
0 5 10 15 20 25 30 35 40 25 20 15 10 5 0 Im p act f o rce (kN ) Time (sec)
0 5 10 15 20 25 30 35 40 25 20 15 10 5 0 Im p act f o rce (kN ) Time (sec)
[image:16.595.118.512.352.677.2](a) (b)
[image:17.595.88.535.83.479.2](c) (d)
Figure 10. Impact force time history plots due to the pounding interaction between elastic and inelastic middle-right struc-ture (consider gap of 0.025 m and Model I for this study). (a) Response from Northridge ground motion; (b) Response from Cope Mendocino ground motion; (c) Response from Loma Prieta ground motion; (d) Response from Superstition Hill ground motion.
(a) (b)
(c) (d)
(e) (f)
[image:18.595.82.539.78.653.2](g) (h)
(a) (b)
(c) (d)
(e) (f)
[image:19.595.87.523.78.665.2]
(g) (h)
(a) (b)
(c) (d)
(e) (f)
(g) (h)
[image:20.595.110.511.81.658.2](a)
(b)
[image:21.595.185.461.82.670.2](c)
Figure 14. Acceleration response spectra in elastic and inelastic ad-jacent structural units due to Superstition Hills ground motion inputs (consider gap of 0.025 m and Model I for this study). (a) Left struc-ture; (b) Middle strucstruc-ture; (c) Right structure.
0.0 0.5 1.0 1.5 2.0 2.5 3.0 32 28 24 20 16 12 8 4 0 S p ect ral accel er at io n ( m/ se c 2) Time (sec)
Elastic without pounding Elastic with pounding Inelastic without pounding Inelastic with pounding
0.0 0.5 1.0 1.5 2.0 2.5 3.0 24 21 18 15 12 9 6 3 0 S p ect ral accel er at io n ( m/ se c 2) Time (sec)
Elastic without pounding Elastic with pounding Inelastic without pounding Inelastic with pounding
0.0 0.5 1.0 1.5 2.0 2.5 3.0 32 28 24 20 16 12 8 4 0 S p ect ral accel er at io n ( m/ se c 2) Time (sec)
Table 2. Peak displacements of adjoining elastic or inelastic structures for recorded ground motions (considering gap of 0.025 m and Model I for the study).
Structure Ground motions
Peak displacement in meters
Elastic with pounding
Elastic without pounding
Inelastic with pounding
Inelastic without pounding
Left
Northridge −0.158 −0.273 −0.23 −0.26
Cope Mendocino −0.079 −0.133 −0.10 0.093
Loma Prieta −0.117 0.076 −0.101 −0.082
Superstition Hills −0.117 0.076 −0.13 0.085
Middle
Northridge −0.051 0.04 −0.057 −0.023
Cope Mendocino −0.039 −0.049 0.022 0.020
Loma Prieta 0.029 0.038 0.026 0.026
Superstition Hills 0.029 0.038 0.013 0.016
Right
Northridge 0.020 0.021 −0.008 −0.008
Cope Mendocino −0.026 −0.026 −0.008 −0.008
Loma Prieta 0.018 0.018 0.008 0.009
Superstition Hills 0.018 0.018 0.007 0.006
Note: Negative sign indicate the displacement is along backward direction of applied ground excitation.
Table 3. Absolute impact forces and number of impacts between the adjacent elastic or inelastic structures for recorded ground excitations (considering gap of 0.025 m and Model I for the study).
Interaction between the
structures Ground motions
Impact forces for elastic structures in kN
Impact forces for inelastic structures in kN
Left-middle
Northridge 38.36 (174) 4.08 (10)
Cope Mendocino 12.57 (63) 7.42 (16)
Loma Prieta 24 (64) 1.46 (13)
Superstition Hills 24 (64) 6.65 (11)
Middle-right
Northridge 16.16 (55) 0.04 (2)
Cope Mendocino 4.96 (22) 0
Loma Prieta 8.21 (12) 0
Superstition Hills 8.21 (11) 0
Note: The values in the brackets indicate the number of collisions between the structures.
[image:22.595.95.540.374.515.2]After studying impact force time history plots fromFigure 9,Figure 10 and peak impact forces fromTable 3, it is seen that in inelastic structures less amount of impact forces (magnitude-wise and number-wise) are gener-ated during collision of structures. Northridge ground motion produce much catastrophic effect in the structures than any other considered ground motions. In the interaction of left-middle structures, the impact forces are get-ting higher in magnitude and in numbers than that of the interaction amongst middle-right structures, this proves that the pounding between flexible-rigid structures generates more impact forces than rigid-rigid structures with sufficient separation distance.
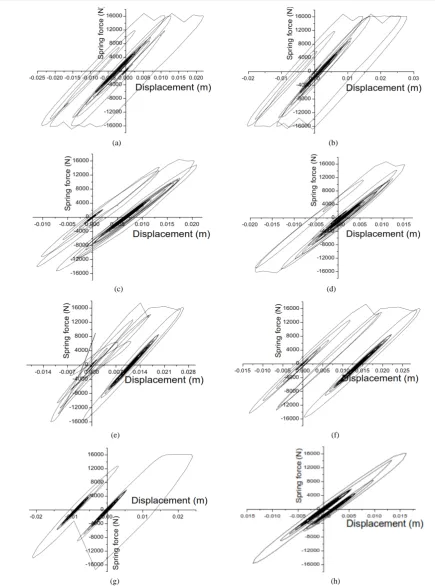
After careful study of force-deformation hysteretic ofFigures 11-13, it is observed that the left structures un-dergoes into more plastic stage deformation than any other structures which ultimately lefts some permanent deformation in the structure at the end of the seismic excitation. One more particular observation is that in the right structure, the plastic stage deformation is much lesser than any other structures because of its rigidity. There finds much difference in the force-deformation hysteretic loops of flexible inelastic structures, when pounding is ignored or considered in the structures.
Through figures of floor spectral acceleration plots (Figure 14), it is clearly noticed that left structures attracts more amount of acceleration than the middle and right structures sequentially, which indicate that the flexible structures suffers more damages than that of rigid structures. One important observation in flexible structure is that after attaining the peak acceleration values for a certain period, the further successive values are not lower down drastically, but it remains flatter with a quite high accelerations. In middle and right structures the peak spectral acceleration values are shifted towards the lower time period. In end right structures the peak spectral acceleration values are condensed into a narrow band whereas for other two structures these values are spread up into much wider band. One specific observation in right structure is that their shows much less difference in the values of floor spectral acceleration with the presence and absence of pounding in elastic or inelastic behavior of structures. Pounding always produces more amount of acceleration in the structures than without pounding structures irrelevant of elastic or inelastic behavior. Elastic structure always overestimates the floor spectral ac-celeration than inelastic structure in case of pounding, that’s because of more number of impact takes place in elastic structure, on the other hand, the inelastic structure always have a chance to change the axis of deforma-tion which ultimately results into less numbers of contact with the adjacent structural units.
5. Conclusions
The comparison between the earthquake-induced pounding involved behavior of three adjacent SDOF structures modeled as elastic or inelastic system has been investigated in this paper. The results of the developed MATLAB codes are verified with SAP 2000NL software results as well as with referred published paper results. Four different ground motion records with different PGA have been applied to conduct the numerical simula-tions. The following specific conclusions, which are subject to limitations of models used, may be drawn from the present study:
1) The results of the study indicate that the responses of elastic system are much different when comparing to the response of inelastic system, specifically, in lighter/flexible building which easily undergoes into yielding stage during pounding. One important observation is that the values of maximum impact forces and the number of impacts are larger in the elastic case than those in the inelastic case.
2) With the presence of pounding, the flexible inelastic structure always has more chances to deform perma-nently towards the opposite face of pounding, mostly in high and moderate ground excitations. The force-de- formation hysteretic of flexible structure is much sensitive when subjected to pounding. Also, the force-defor- mation hysteretic loop of flexible structure shows much variation when compared in elastic and inelastic sys-tems.
3) The presence of impact forces during pounding in the closely spaced structures significantly increases the spectral acceleration of the structural system. In addition to that during one sided pounding, mostly in flexible structures the peak spectral floor accelerations are normally shifted towards the lower time period of the system. Elastic structure shows much higher floor spectral acceleration values than inelastic structures since more quick acceleration pulses are generated due to more impact forces.
References
Washington DC.
[2] Bertero, V.V. and Collins, R.G. (1973) Investigation of the Failures of Olive View Stair Towers during the San Fer-nando Earthquake and Their Implications on Seismic Design. Report No. EERC 73-26, Earthquake Engineering Re-search Center, University of California, Berkeley.
[3] Rosenblueth, E. and Meli, R. (1986) The 1985 Earthquake: Causes and Effects in Mexico City. Concrete International,
8, 23-24.
[4] Anagnostopoulos, S.A. (1988) Pounding of Buildings in Series during Earthquakes. ASCE Journal of Structural Engi-neering and Structural Dynamics, 16, 443-456. http://dx.doi.org/10.1002/eqe.4290160311
[5] Pantelides, C.P. and Ma, X. (1998) Linear and Non-Linear Pounding of Structural Systems. Computers and Structures,
66, 79-92. http://dx.doi.org/10.1016/S0045-7949(97)00045-X
[6] Davis, R.O. (1992) Pounding of Buildings Modeled by an Impact Oscillator. Earthquake Engineering and Structural Dynamics, 21, 253-274. http://dx.doi.org/10.1002/eqe.4290210305
[7] Jankowski, R. (2006) Pounding Force Response Spectrum under Earthquake Excitation. Engineering Structures, 28, 1149-1161. http://dx.doi.org/10.1016/j.engstruct.2005.12.005
[8] Maison, B.F. and Kasai, K. (1992) Dynamics of Pounding When Two Buildings Collide. Earthquake Engineering and Structural Dynamics, 21, 771-786. http://dx.doi.org/10.1002/eqe.4290210903
[9] Muthukumar, S. and DesRoches, R.A. (2006) Hertz Contact Model with Nonlinear Damping for Pounding Simulation. Earthquake Engineering and Structural Dynamics, 35, 811-828. http://dx.doi.org/10.1002/eqe.557
[10] Mouzakis, P. and Papadrakakis, M. (2004) Three Dimensional Nonlinear Building Pounding with Friction during Earthquakes. Journal of Earthquake Engineering, 8, 107-132. http://dx.doi.org/10.1080/13632460409350483
[11] Pant, R. and Wijeyewickrema, A.C. (2010) Seismic Pounding between Reinforced Concrete Buildings: A Study Using Recently Proposed Contact Element Models. Proceedings of 14th European Conference on Earthquake Engineering, Ohrid, 30 August-3 September 2010.
[12] MATLAB (2009) The Language of Technical Computing, Getting Started with MATLAB. Version R2009b, The Mathworks, Natick.
[13] Structural Analysis Program (2009) SAP User’s Manual. Computers and Structures Inc., Berkeley.
[14] Athanassiadou, C.J., Penelis, G.G. and Kappos, A.J. (1994) Seismic Response of Adjacent Buildings with Similar or Different Dynamic Characteristics. Earthquake Spectra, 10, 293-317. http://dx.doi.org/10.1193/1.1585775
[15] Papadrakakis, M., Mouzakis, H., Plevris, N. and Bitzarakis, S. (1991) A Lagrange Multiplier Solution Method for Pounding of Buildings during Earthquakes. Earthquake Engineering and Structural Dynamics, 20, 981-998.
http://dx.doi.org/10.1002/eqe.4290201102
[16] Wen, Y.K. (1976) Method for Random Vibration of Hysteretic Systems. Journal of Engineering Mechanics, ASCE,
102, 249-263.
![Figure 4. Displacement time history validation of MATLAB program with the results of Pentelides and Ma [1998]](https://thumb-us.123doks.com/thumbv2/123dok_us/7996056.760322/11.595.179.480.82.473/figure-displacement-history-validation-matlab-program-results-pentelides.webp)
![Figure 5. Impact force time history validation of MATLAB program with the results of Pentelides and Ma [1998]](https://thumb-us.123doks.com/thumbv2/123dok_us/7996056.760322/12.595.177.451.314.714/figure-impact-history-validation-matlab-program-results-pentelides.webp)