Auditory Scale Analysis and Evaluation of Phonemes in
MISING Language
Rizwan Rehman
Assistant Professor Centre for Computer Studies
Dibrugarh University
Gopal Chandra Hazarika,
Ph.D. Professor Dept. of Mathematics
Dibrugarh University
D. Kardong,
Ph.D. Assistant Professor Dept. of Life SciencesDibrugarh University
ABSTRACT
Frequency analyzer is one of the important functions of peripheral auditory system. Psycho-acoustically this gives rise to the concept of critical band, which represents the frequency resolution of the auditory system. Mel-Scale warping is one of the common techniques used for the analysis in speech recognition. Bark and ERB (Equivalent Rectangular Bandwidth) rate scales are two other auditory scales which have comparable performance to Mel-Scale. In this paper the acoustic features generated using filter banks with Mel-Scale, Bark-Scale and ERB-Scale has been investigated and analyzed with respect to the phonemes in the MISING language.
General Terms
Speech Processing and Analysis, Auditory Scale, Psycho-acoustic, Speech Signal
Keywords
Mel-Scale, Bark-Scale, ERB-scale, Filter Bank, Formant
1.
INTRODUCTION
Speech analysis basically tackles the problem of deriving representations from recordings of real speech signals. With proper speech analysis the key properties of the real speech can be captured and thereafter can be used to generate new speech signals. The nature of the speech signal and its acoustic properties can be studied by the analysis and presentation of speech signal in frequency domain [1]. In order to maintain the naturalness of oral communication between human and machines all aspect of speech must be involved [2]. Speech analysis is needed to be performed because the waveform does not usually directly give us the type of information we are interested in.
The first stage of the speech analysis involves filtering, performed to decrease the vocal message ambiguities. Filtering is performed on discrete time quantized speech signals and after that the significant features of the speech signal are extracted. The key issues handled by the speech analysis include:
a) Source / filter separation to study the spectral envelope of the sounds independent of the source that they are spoken with.
b) Transformation of these spectral envelopes and source signals into representation which are efficiently coded and which shows the linguistic information more clearly.
A speech sampled waveform need at most 100000 bits/sec to retain all conveyed information that is much higher than the underlying average phoneme information. In general a speaker is able to produce at most 45-50 different phonemes.
Each phoneme is represented by 6 bits as 50<26. Thus the phoneme information is about 60 bits/sec much lower than 100000 bits/sec. Therefore the speech signal representations which do not contain information that is redundant and useless are required.
The speech signals in context with the real world are continuous signals describing the pattern of air pressure variation with respect to time. These signals are recorded using analog means which are needed to be digitized to be converted into discrete signals for analysis. The speech signals comprises of a large amount of raw data which includes pauses between the utterances, undesired distortions etc. In this paper the frequency warping techniques such as Bark, ERB and Mel-Scale are analyzed with respect to phonemes in MISING language.
2.
BASIC AUDITORY PROCESS
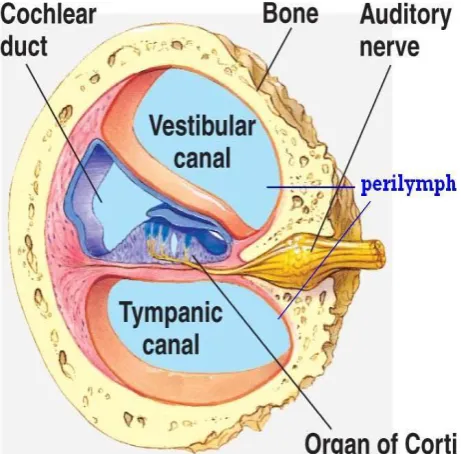
[image:1.595.317.548.495.722.2]It has been showed through psycho-acoustic studies that basilian membrane which is located in the front end of the human auditory system act as a bank of overlapping band pass filters, each tuned to a specific frequency. The filter closest to the Cochlear base responds maximally to the highest frequencies and those near to the apex respond maximally to the lowest frequencies. When a sound is presented to the human ear, the time taken for the wave to trail through Cochlea is only 5 milli-seconds.
A temporal oscillographic analysis is performed by the hearing system of the neural signal originating in the Cochlea in response to auditory stimulus [2, 3]. The maximum frequency range of 1.5 KHz of human perception can be covered by critical band filters by logarithmically increasing width of critical band filters [4].
Mapping of the linear frequency to the perpetual representation can be performed through warping using the Mel-Scale, Bark-Scale or ERB-Scale. All of the three scales are based on human perception mechanism [5].
3.
AUDITORY SCALES
Human sensitivity to the frequency scale is not linear. Studies into low-level perception of sounds have resulted in number of auditory scales, which defines a new frequency range that is more in line with human sensitivity to sounds at different frequencies.
3.1
Mel-Scale
Mel-scale of auditory pitch was the product of experiments with sinusoids in which subjects were required to divide frequency range into sections. In this, one Mel equaled one thousandth of pitch of 1 KHz tone [6][7]. The mapping from linear frequency to this scale is given by:
Mel = 2595 log10(1 + f/700) (3.1.1) where f is the frequency in Hz.
3.2 Bark Scale
Studies based on loudness found that linear response to lower frequencies and logarithmic for higher frequencies provide a more accurate representation. This scale range from 1 to 24 and corresponds to first 24 critical bands of hearing. The transformation of frequency into Bark [8][9] is given by:
Bark=13arctan (0.76 f / 1000) + 3.5arctan ((f/7500)2) where f is the frequency in Hz. (3.2.1) Another transform used is that from Traunmüller (1990) [10]:
Bark = 26.81 𝑓
1960+𝑓 - 0.53 (3.2.2) where f is the frequency in Hz.
3.3 ERB Scale
Equivalent Rectangular Bandwidth or ERB scale is measured from the ability to detect sinusoids in presence of noise [11]. The following is one of the approximation relating the ERB and frequency:
ERB = 6.23 x 10 -6 f 2 + 9.339 x 10⁻² f + 28.52 where f is the frequency in Hz. (3.3.1) Moere and Glasberg [12] provided another approximation:
ERB = 24.7 (4.37f + 1) (3.3.2) where f is the frequency in Hz.
[image:2.595.321.548.84.277.2]At moderate sound levels the ERB is defined by [13] : ERB = 0.108f+24.7 (3.3.3) where f is the frequency in Hz.
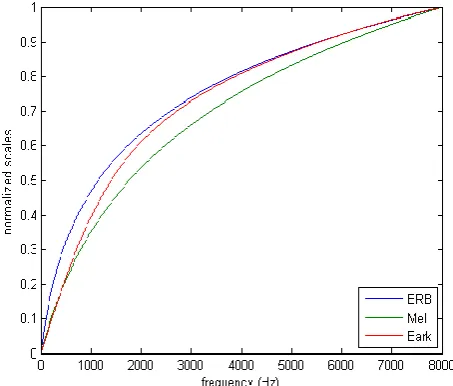
Fig 2: Mapping from linear to logarithmic scale of the normalized scale of ERB, Mel and Bark scale for a
frequency range from 0 to 8000 Hertz.
4.
FILTER BANK ANALYSIS
Spectral features of speech are obtained after passing it through the filter banks. Filter bank will properly integrate a spectrum at defined frequency ranges. The frequency response of filter banks simulates the human ear processing. One of the important features would be the separation of source and filter the reason being that, both the components of speech signal have different and independent linguistic function. The pitch in controlled by the source while the spectrum envelope and formant positions are controlled by the filters. Filter bank analysis is one of the techniques to perform source-filter separation.
Filters are non-uniformly spaced along the frequency axis. Series of bins are created each centered on a particular frequency. The part of the spectrum below 1 KHz is processed by more filter banks for the reason that it contains more information on the vocal tract.
Mel-scale is the most widely used perceptual scale. The central frequency of each Mel-scale filter bank is uniformly spaced before 1 KHz and it follows a logarithmic scale after 1 KHz.
Consider the sampling period Ps, the frequency ѱ of discrete time signals is related to the frequency F of the respective continuous time signal by:
𝐹 =2𝜋Psѱ (4.1)
One of the methods to implement the filters is to perform filtering directly in the DFT domain. The DFT response of the filter are simply shifted and frequency warped version of the triangular window [14] WΔm(r) where
WΔm(r) = 𝑟 < 𝛥𝑚 → 1 − 𝑘 𝛥𝑚
𝑟 ≥ 𝛥𝑚 → 0 (4.2)
Where r is the DFT domain Δm is the size of m-th filter bank. The mth filter bank output is given by
Xt(m) =
𝑍𝑡 𝑟
𝑎𝑚 + ∆𝑚
Z
t(r) = Z
t(e
j2πr/N)
(4.4) Where r = 0,….N-1The central frequency may be computed according to am = am-1 + Δm and for 2𝜋Psѱ = f < 1 KHz
Δm is chosen so that 10 uniformly spaced filters are obtained.
Fig 3: Warped Filter Bank using Bark Scale for phoneme /a/ in MISING language.
Fig 4: Warped Filter Bank using Mel Scale for phoneme /a/ in MISING language.
5.
EXPERIMENTAL PROCEDURE
The study was performed by recording the 7 vowels (short) out of fourteen (7 long variance), in MISING language spoken by 10 male and 10 female native speakers. The recording and analysis is performed using PRAAT software package. PRAAT is a very flexible tool for performing speech analysis. PRAAT software package offers wide range of procedures including spectrographic analysis, articulatory synthesis, and neural networks.
5.1
Procedure for Calculations
a. Mel-Scale (from equation 3.1.1) Mel = 2595 log10 (1 + f / 700) b. Bark-Scale (from equation 3.2.2)
Bark = 26.81 𝑓 1960+𝑓 - 0.53
c. ERB-Scale (from equation 3.3.3) ERB = 0.108f+24.7
In all the above cases f is the frequency in Hz.
[image:3.595.310.544.137.754.2]6.
EXPERIMENTAL RESULTS
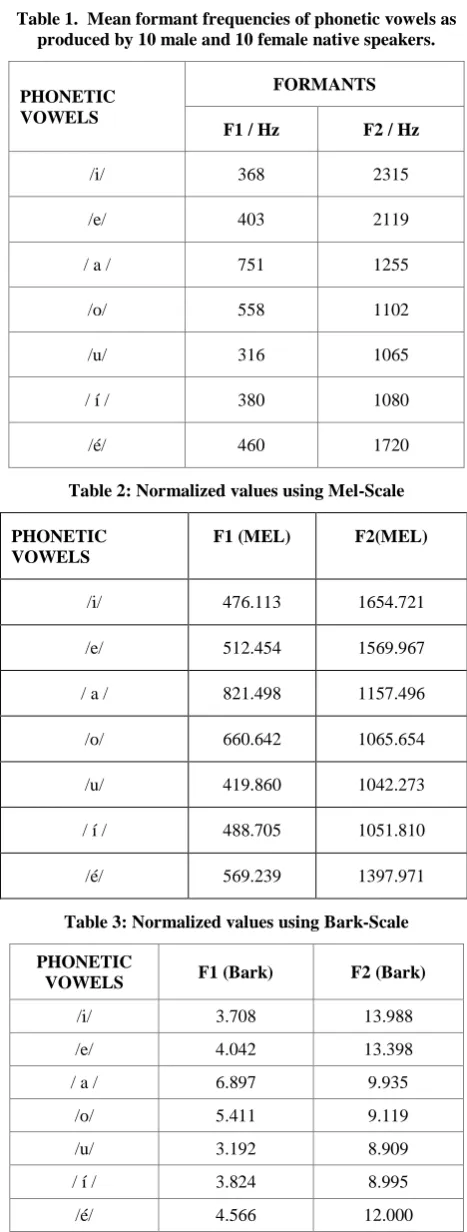
Table 1. Mean formant frequencies of phonetic vowels as produced by 10 male and 10 female native speakers.
PHONETIC VOWELS
FORMANTS
F1 / Hz F2 / Hz
/i/ 368 2315
/e/ 403 2119
/ a / 751 1255
/o/ 558 1102
/u/ 316 1065
/ í / 380 1080
[image:3.595.54.261.183.330.2]/é/ 460 1720
Table 2: Normalized values using Mel-Scale
PHONETIC VOWELS
F1 (MEL) F2(MEL)
/i/ 476.113 1654.721
/e/ 512.454 1569.967
/ a / 821.498 1157.496
/o/ 660.642 1065.654
/u/ 419.860 1042.273
/ í / 488.705 1051.810
/é/ 569.239 1397.971
Table 3: Normalized values using Bark-Scale
PHONETIC
VOWELS F1 (Bark) F2 (Bark)
/i/ 3.708 13.988
/e/ 4.042 13.398
/ a / 6.897 9.935
/o/ 5.411 9.119
/u/ 3.192 8.909
/ í / 3.824 8.995
/é/ 4.566 12.000
0 1.6·104
-60 -50 -40 -30 -20 -10 0
A
m
p
li
tu
d
e
(
d
B
)
Frequency (Hz)
0 1.6·104
0 1
A
m
p
li
tu
d
e
[image:3.595.57.260.388.541.2]A
m
pl
it
u
de
(
db)
Am
p
li
tu
d
e
(d
b
[image:4.595.51.284.84.280.2])
Table 4: Normalized values using ERB-Scale
PHONETIC
VOWELS F1 (ERB) F2 (ERB)
/i/ 8.909 22.383
/e/ 9.439 21.639
/ a / 13.517 17.374
/o/ 11.478 16.363
/u/ 8.062 16.100
/ í / 9.095 16.208
/é/ 10.242 19.907
[image:4.595.321.543.86.377.2]The values obtained in Table3, Table4, Table5 are calculated by applying formulas discussed in equations 3.1.1, 3.2.2 and 3.3.3.
Fig 5: ERB and BARK Scale Comparison of the phonetic vowels in MISING language with respect to formant f1.
Fig 6: ERB and BARK Scale Comparison of the phonetic vowels in MISING language with respect to formant f2.
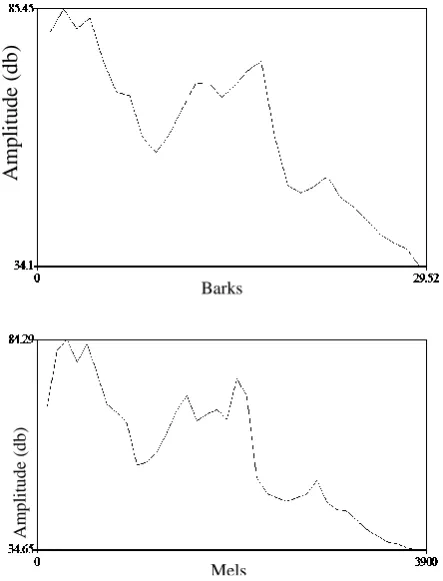
Fig 7: Comparison of Spectrum using Bark and Mel Scale warped filter functions for phoneme /a/ in MISING
language.
7.
CONCLUSIONS
It is found through the experimental analysis that BARK and ERB Scale can have comparable performances with respect to the phonemes and is justified through Fig 5 and Fig 6 where comparison is performed both on f1 formant and f2 formant on Bark and ERB scale values obtained from Table 3 and Table 4. Experimental results also justified that pitch is linearly perceived in frequency range of 0-1000 Hz and above that the scale is logarithmic. The analysis also proved the point that auditory frequency resolution is better described by Equivalent Rectangular Bandwidth (ERB). The spectrum shown in Fig 7 shows that Bark scale warped filter function gives comparable performances to the Mel-scale warped filter function. Table 2, Table 3 and Table 4 establishes the normalized frequency ranges for the phoneme in MISING language using Mel, Bark and ERB scales for both f1 and f2 formants. The data values in Table 2, Table 3 and Table 4 can be applied to extract the features for speaker identification. Further investigations are planned to achieve the same. Hence, from the above discussion following points can be concluded with respect to the phonemes in MISING language:
Bark-Scale and ERB-Scale provide comparable performances.
Pitch is linearly predictive in frequency range 0-1000 Hz and logarithmic beyond 1000 Hz.
Bark scale warped filter function gives comparable performances to the Mel-scale warped filter function.
ERB-Scale provides better auditory frequency resolution.
/i/ /e/ /a/ /o/ /u/ /i'/ /e'/ ERB-Scale 8.90 9.43 13.5 11.4 8.06 9.09 10.2 Bark-Scale 3.70 4.04 6.89 5.41 3.19 3.82 4.56
0 2 4 6 8 10 12 14 16
Fo
rm
an
t
f1
/i/ /e/ /a/ /o/ /u/ /i'/ /e'/ ERB-Scale 22.3 21.6 17.3 16.3 16.1 16.2 19.9 Bark-Scale 13.9 13.4 9.93 9.11 8.90 8.99 12
0 5 10 15 20 25
Fo
rm
an
t
f2
Barks
[image:4.595.51.295.315.702.2] [image:4.595.54.294.318.506.2] [image:4.595.54.293.508.701.2]8.
REFERENCES
[1] Biljana Prica and Sinisallic. 2010 Recognition of Vowels in Continuous Speech by Using Formants.
[2] Rizwan Rehman and G.C. Hazarika “Analysis and Recognition of Vowels in SHAI`YANG MIRI Language using Formants”, International Journal of Computer Applications (USA), Volume 89/Number 2,2014.
[3] J.O. Pickles (1988) An Introduction to the Physiology of Hearing, London: Academic (2nd ed.).
[4] R. Plomp (1976) Aspects of Tone Sensation: A Psychophysical Study, London: Academic.
[5] Thomas F Quateier,”Discrete Time Processing of Speech Signals- Principles and Practice”Pearson Eduaction,1997.
[6] Sharada V Chougule, Mahesh S Chavan (2013) Comparison of Frequency-Warped Filter Banks in relation to Robust Features for Speaker Identification: Recent Advances in Electrical Engineering
[7] S.S. Stevens and J. Volkman (1940) "The relation of pitch to frequency: A revised scale" Am. J. Psychol. 53: 329- 353.
[8] J. Volkmann, S. S. Stevens, and E. B. Newman,“A scale for the measurement of the psychological magnitude pitch (A),” J. Acoust. Soc. Am., vol. 8, no. 3, pp. 208– 208, 1987
[9] Thomas F Quateier,”Discrete Time Processing of Speech Signals- Principles and Practice”, Pearson Eduaction,1997.
[10]E. Zwicker, G. Flottorp and S.S. Stevens (1957) "Critical bandwidth in loudness summation" J. Acoust. Soc. Am. 29: 548-557.
[11]H. Traunmüller (1990) "Analytical expressions for the tonotopic sensory scale" J. Acoust. Soc. Am. 88: 97-100. [12]B.C.J. Moore and B.R. Glasberg (1983) "Suggested
formulae for calculating auditory-filter bandwidths and excitation patterns" J. Acoust. Soc. Am. 74: 750-753.
[13]B.R. Glasberg and B.C.J. Moore, "Derivation of auditory filter shapes from notched-noise data", Hearing Research, Vol. 47, Issues 1-2, p. 103-138, 1990.