An Enhanced Carrier Acquisition Algorithm for
Low SNR and High Dynamic Signal
Almas Kaveh
1*, Liu Rongke
2and Vahid Alipour Maralani
31 School of Electronic Information Engineering, Beihang University, Beijing 100191, China. 2 School of Electronic Information Engineering, Beihang University, Beijing 100191, China. 3 School of Electronic Information Engineering, Beihang University, Beijing 100191, China.
Date of publication (dd/mm/yyyy): 14/11/2019
Abstract – In deep space communications, the received signals have low SNR and high dynamic. The high dynamic characters cause a large Doppler frequency shift and frequency change rate so it makes to create problem in signal reception and processing. The traditional algorithm based on the maximum likelihood method for the carrier frequency acquisition with high dynamic and low SNR signal is analyzed. To solve this problem, an enhanced carrier acquisition algorithm with FFT and cyclic shifting accumulation by calculating periodogram, is proposed. There for by using this algorithm the signal frequency acquisition performance is enhanced. Also by the enhanced algorithm cyclically shifts the signal spectrum, the influence of the Doppler frequency change rate is eliminated, and then the captured carrier frequency accuracy is higher.
Keywords – Maximum Likelihood, Deep Space Communication, High Dynamic, Low SNR.
I
.
INTRODUCTION
Compared with the near-earth space communication, deep space communication is very far away and has very low SNR and other characteristics. At the same time, because of the large radial velocity and acceleration of the deep space detector, the received signal has high dynamic characteristics. Therefore cause a large Doppler frequency shift and frequency change rate. To achieve communication between the ground station and the detector during deep space exploration, first, the high dynamic and weak signal frequency acquisition problem must be solved. At present, there are many frequency acquisition methods for high dynamic weak signals. A frequency estimation algorithm based on linear predictor is given in [1], but the simulation is not performed under very low SNR conditions. Therefore, its conclusion is not applicable to deep space communication. In [2], the high-dynamic weak signal of the three algorithms based on the maximum likelihood method (ML) frequency estimation algorithm, the extended Kalman filter (EKF) based frequency estimation algorithm and the crossover frequency automatic control loop algorithm, the frequency estimation performance is compared. The conclusion is that the frequency estimation algorithm based on the maximum likelihood method is more suitable for the frequency estimation of high dynamic and weak signals, but the computational complexity is not optimized because the maximum likelihood method is not used in this paper.
map is proposed. Compared with other methods, the matching accuracy requirement of Doppler rate of change is reduced. Under the same dynamic conditions, the amounts of calculation are reduced.
In this paper, the algorithm principle of the literature [4] is studied. It is found that there is a Doppler frequency change rate difference between each sub-data segment when the average period spectrum is obtained, which leads to the non-coherent accumulation not achieving the best performance. Based on this, an enhanced algorithm for frequency domain cyclic shifting accumulation and periodogram calculation is proposed. This algorithm effectively enhances the frequency acquisition performance of the algorithm.
II. FREQUENCY ESTIMATION BASED ON MAXIMUM LIKELIHOOD
In deep space communication, the received signal by the front-end receiver is down-converted. The frequency components include the intermediate frequency, the Doppler frequency, the Doppler frequency change rate, and the higher-order rate of change. In the capture phase, the rate of change of the second order and above of the Doppler frequency is not considered [4], so the received signal can be analyzed using the constant rate of change model. Without loss of generality, the intermediate frequency is zero, and the complex form of the received signal is:
𝑟(𝑡) = 𝐴 ∙ exp(𝑗 ∙ (2𝜋𝑓𝑑𝑡 + 𝜋𝑎𝑡2)) + 𝑛(𝑡) (1)
In the formula, 𝐴 = ±1 is the modulation information, 𝑓𝑑is the Doppler frequency, 𝑎 is the Doppler frequency
change rate, and 𝑛(𝑡) is the additive white Gaussian noise with a mean value of 𝜎2.
The method for estimating the carrier Doppler frequency 𝑓𝑑 and the Doppler frequency change rate 𝑎 in deep
space communication is a frequency estimation method based on the maximum likelihood method [4]. The capture process of the signal frequency is essentially that the search process of the carrier frequency space and the carrier frequency change rate space, is multiplying the input signal by a different frequency change rate in the assumed 𝑁𝑟frequency change rate space,
𝑥𝑙(𝑡) = 𝑟(𝑡) ∙ exp(−𝑗𝜋𝑎̂𝑙𝑡2) 0 ≤ 𝑡 ≤ 𝑇 , 1 ≤ 𝑙 ≤ 𝑁𝑟 (2)
Where 𝑎̂ represents the carrier frequency change rate in the frequency change rate space of the 𝑙 hypothesis, and 𝑇 is the duration of the input signal 𝑟(𝑡). The obtained 𝑥𝑙(𝑡)is divided into 𝑀 consecutive sub-data segments,
and each sub-data segment has a time length of ∆𝑇 = 𝑇 𝑀⁄ . Each sub-data segment is separately subjected to 𝐹𝐹𝑇 transformation, and the sum of the squares of the amplitudes obtained by the 𝐹𝐹𝑇 transformation is averaged to obtain an estimated amount 𝑃𝑙(𝑓𝑘), 1 ≤ 𝑙 ≤ 𝑁𝑟, 𝑓𝑘 = 𝑘 ∆𝑇⁄ , −𝑁𝐹𝐹𝑇⁄ + 1 ≤ 𝑘 ≤ 𝑁2 𝐹𝐹𝑇⁄2 of the periodic graph.
Finally, based on the branch and frequency index of the maximum value of𝑃𝑙(𝑓𝑘), the estimated values of Doppler
frequency and Doppler frequency change rate 𝑓̂𝑑and 𝑎 ̂are obtained. The principle of the algorithm is shown in
Fig1. Block diagram of carrier estimation based on maximum likelihood method
The input signal is multiplied by the preset Doppler frequency change rate of each branch. When the Doppler frequency change rate of a branch is closest to the actual Doppler frequency change rate, the average of the branch is obtained. The maximum peak value appears in the periodogram, and the position of the maximum value is the estimated frequency. The Doppler frequency change rate preset by the branch is the estimated Doppler frequency change rate. By Combining formula (1) and (2):
xl(t) = r(t) ∙ exp(−jπâlt2) = A ∙ exp(j(2πfdt + π∆alt2)) + n(t) ∙ exp(−jπâlt2) (3)
Where ∆𝑎𝑙 is the difference in frequency change rate of the branch, ∆𝑎𝑙= 𝑎 − 𝑎̂𝑙. The signal power spectrum
with Doppler frequency change rate is close to the rectangle when the time bandwidth product 𝐵. 𝑇𝑠≫ 1 (𝑇𝑠is
the sampling time interval and 𝐵 is the signal bandwidth) [5]. When 𝐹𝐹𝑇 is obtained for the signal with the difference of the frequency change rate, 𝑇𝑠 is shorter, and the bandwidth of the frequency change rate difference
is less than the time window bandwidth 2 𝑇⁄ 𝑠. The Fourier transform of the 𝑚 ( 𝑚 = 1,2, … , 𝑀) sub-data segment
of the 𝑙 branch is
Xl(f, m) = ∫ xl(τ)h(τ)e−j2πfτdτ = +∞
−∞ ∫ xl
(τ)e−j2πfτdτ Ts
0
(4)
III. ENHANCE ACQUISITION ALGORITHM
The aim of analysis of the algorithmic disadvantages in Section 2 of this paper, propose an enhanced algorithm for frequency domain cyclic shifting accumulation and calculating periodogram. In the virtual frame of Figure 1, the average periodogram is obtained. The spectrum of the first sub-data segment remains unchanged, and the remaining segments are cyclically shifted according to the values of ∆𝑎𝑙 and 𝑚 ( 𝑚 = 2, … , 𝑀), and then
cyclically shifted. The square of the absolute value of the spectrum of each sub-data segment is non-coherently accumulated. Next, the number of points 𝑆𝑚 in which the spectrum of each sub-data segment is cyclically shifted
is derived. The sampling frequency used by the algorithm is 𝑓𝑠, the number of points for each sub-data segment
to be FFT transformed is 𝑁𝐹𝐹𝑇, and the resolution of the 𝐹𝐹𝑇 transform is 𝑓𝑠⁄𝑁𝐹𝐹𝑇. The DFT absolute value of
the 𝑚 ( 𝑚 = 1, 2, … , 𝑀) sub-data segment of the branch 𝑙 is obtained by equation (5). In the equation:
|𝐷𝐹𝑇𝑙(𝐾, 𝑚)| = |𝐴𝑁𝑠∙ 𝑆𝑚(𝐾 − (𝑘𝑑+ ∆𝑎𝑙𝑚𝑁𝑠)𝑁𝑠)| (6)
In the formula, 𝑁𝑠 is the number of points in time𝑇𝑠 , and 𝑘𝑑 is the Doppler frequency offset. After doing
𝑆𝑚point cyclic shift, equation (7) becomes
|DFTl(K, m)| = |ANs∙ Sa(K − (kd+ ∆almNs+ Sm∙ fs⁄NFFT)Ns)| (7)
To eliminate the offset of the spectrum of each sub-data segment caused by ∆𝑎𝑙, the ∆𝑎𝑙𝑚𝑁𝑠+ 𝑆𝑚. 𝑓𝑠⁄𝑁𝐹𝐹𝑇
term in equation (7) needs to be zero. The enhanced algorithm aims to shift the spectral peak of each sub-data segment to the peak of the first segment of the spectrum, and the number of points moved is an integer, so: Sm= round (∆al× (m − 1) ×Ns×NfFFT
s ) (8)
Where Round (·) represents the rounding operation, 𝑚 = 2, … , 𝑀. The direction of the cyclic shift is related to the symbol of ∆𝑎𝑙 when the actual frequency change rate is less than the preset frequency change rate, it is shifted
to the left; otherwise, and it is shifted to the right.
It can be seen from equation (8) that the number of points of the cyclic shifting and the frequency change rate difference ∆𝑎𝑙, the sub-data segment is proportional to the position of the first sub-data segment (𝑚 − 1), the
number of points taken in the time 𝑇𝑆, and the frequency resolution 𝑓𝑠⁄𝑁𝐹𝐹𝑇 in inverse proportion. The larger the
difference between the actual Doppler frequency change rate and the preset frequency change rate (less than the resolution of the frequency change rate), the peak value of each sub-data segment before the cyclic shifting is smaller than the peak value of the first sub-data segment. The larger the shift, is the larger the number of points to be cyclically shifted in the enhanced algorithm. Compared with the original algorithm, the spectral peak after cyclic shifting non-coherent accumulation is greatly enhanced.
IV. SIMULATION
Parameter Settings
In the simulation, the simulation parameters of the system, including the sampling frequency 𝑓𝑠, 𝐹𝐹𝑇
points 𝑁𝐹𝐹𝑇, Non-coherent accumulation times 𝑀, etc., need to be properly set according to signal characteristics and system performance requirements. Let the Doppler frequency range be [𝑓𝑑𝑚𝑖𝑛, 𝑓𝑑𝑚𝑎𝑥], the Doppler frequency
change rate range be [𝑎𝑚𝑖𝑛, 𝑎𝑚𝑎𝑥], the Doppler frequency resolution be 𝑓𝑑𝑟𝑒𝑠, the Doppler frequency change rate
resolution be 𝑎𝑟𝑒𝑠, and the capture probability should be above 90%. Under the same system parameters, the
simulation compares the performance of the original algorithm and the enhanced algorithm. The following is a selection of the selection principles for several major simulation parameters.
Sampling frequency 𝑓𝑠: Under the premise that the intermediate frequency is zero, the sampling frequency
should ensure that the signals in the Doppler frequency range can be sampled, that is, satisfy the Nyquist sampling theorem 𝑓𝑠≥ 2(𝑓𝑑𝑚𝑎𝑥− 𝑓𝑑𝑚𝑖𝑛). This paper takes the minimum value that satisfies the Nyquist sampling theorem,
that is, twice the Doppler frequency range.
𝐹𝐹𝑇 points 𝑁𝐹𝐹𝑇: The frequency accuracy of the signal frequency capture stage should be able to meet the
signal accuracy requirements of the latter stage tracking stage, and the tracking stage’s requirement for Doppler frequency accuracy is the accuracy to be achieved by the 𝐹𝐹𝑇 resolution, i.e. 𝑓𝑑𝑟𝑒𝑠= 𝑓𝑠⁄𝑁𝐹𝐹𝑇, hence 𝑁𝐹𝐹𝑇 =
𝑓𝑠⁄𝑓𝑑𝑟𝑒𝑠.
Signal duration 𝑇: In the carrier frequency acquisition phase, the parameters of the second order and above of the Doppler frequency change rate are ignored, and the processing is based on the second order of the Doppler frequency change rate and the order above it in time 𝑇. The parameter value is so small that the Doppler frequency change rate can be regarded as a constant in time 𝑇.
Non-coherent accumulation times𝑀: In order to increase the probability of acquisition, in addition to increasing the power spectrum peak as much as possible, the noise power spectrum variance should be minimized. Because the power spectrum variance is proportional to 1/M, multiple accumulations can effectively reduce the noise power spectrum. However, the actual 𝑀 cannot be infinitely large, and under the condition that the sampling rate𝑓𝑠, the
time 𝑇, and the 𝐹𝐹𝑇 point number 𝑁𝐹𝐹𝑇are all determined, 𝑀 = 𝑓𝑠∙ 𝑇 𝑁⁄ 𝐹𝐹𝑇.
Simulation Results
Taking the entry phase of the Mars rover of the US Challenger as an example [4], the carrier-to-noise ratio varies within the range of 17𝑑𝐵 − 𝐻𝑧 ~ 20𝑑𝐵 − 𝐻𝑧, the Doppler frequency 𝑓𝑑varies by −50𝑘𝐻𝑧 ~ 50𝑘𝐻𝑧, and
algorithm by 1𝑑𝐵 − 𝐻𝑧 ~ 2𝑑𝐵 − 𝐻𝑧. The enhanced algorithm improves the capture performance of the signal carrier frequency.
Fig. 2. Acquisition probabilities of original method in compare with the enhanced method with different CNR.
There is noise in the input signal. When the noise is relatively large, the capture result may be false alarm. Figure 3 shows the false alarm probability of the original algorithm and the enhanced algorithm under different carrier-to-noise ratio conditions. It can be seen from Fig. 3 that under the same carrier-to-noise ratio condition, the false alarm probability of the enhanced algorithm is reduced. Because the enhanced algorithm cyclically shifts the signal spectrum, the influence of the Doppler frequency change rate difference is eliminated, so the captured carrier frequency accuracy is higher.
Fig. 3. False alarm probabilities of original method and enhanced method with different CNR
Table 1. Acquisition and False alarm probabilities of original method in comparison with the enhanced method with different CNR.
CNR (dB-Hz) Original Method
(Pa %)
Enhanced Method (Pa %)
Original Method (P False %)
Enhanced Method (P False %)
14 0 0 100 100
15 0 33 97 64
16 32 80 60 20
17 80 99 20 1
18 98 100 1 0
Figure 4 shows the standard deviation of the Doppler frequency and the actual Doppler frequency captured under different carrier-to-noise ratio conditions. It can be seen from the figure that the simulation results are consistent with the theoretical analysis.
Fig. 4. Estimation error of Doppler frequency with different CNR.
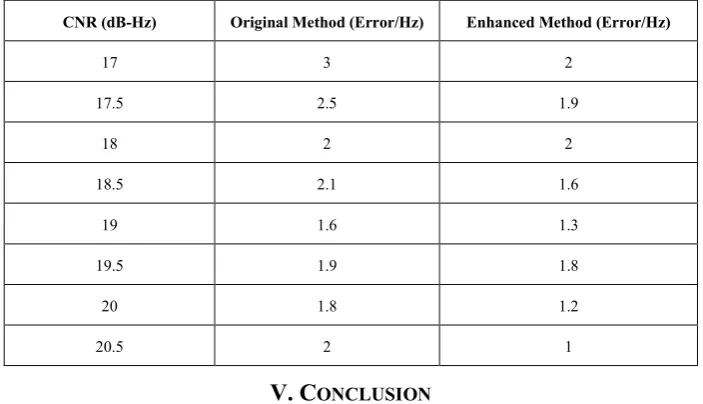
Table 2 shows the comparison of estimation error of Doppler frequency from 17dB-Hz to 20.5dB-Hz with two methods as original and enhanced methods. According to table2, the error of enhanced method is better than the original one about 0.1 to 1 Hz.
Table 2. Estimation error of Doppler frequency in different CNR by Original method and Enhanced method.
CNR (dB-Hz) Original Method (Error/Hz) Enhanced Method (Error/Hz)
17 3 2
17.5 2.5 1.9
18 2 2
18.5 2.1 1.6
19 1.6 1.3
19.5 1.9 1.8
20 1.8 1.2
20.5 2 1
V. CONCLUSION
[2] Vilnrotter V.A., Hinedi S, Kumar R. Frequency Estimation Techniques for High Dynamic Trajectories [J]. IEEE Transactions on Aerospace and Electronic Systems, 1989.
[3] Ma S.X., Jiang J.N., Meng Q. A Fast, Accurate and Robust Method for Joint Estimation of Frequency and Frequency Rate [C] IEEE International Symposium on Intelligent Signal Processing and Communication Systems (ISPACS 2011), 2011.
[4] Satorius E, Estabrook P, Wilson J and Fort D. Direct to Each Communication and Signal Processing for Mars Exploration Rover Entry, Descentand Landing [R]. IPN Progress Report, 2003, 42~153.
[5] Cowell D.M.J. Freear S. Separation of Overlapping Linear Frequency Modulated (LFM) Signals using the Fractional Fourier Transform [J]. IEEE Transactions on Ultrasonic, Ferroelectrics and Frequency Control, 2010, 2324~2333.
AUTHOR’S PROFILE
Almas Kaveh, Electronic Engineer BS graduated from Khaje Nasir Aldin Toosi University-Tehran Iran and received Master Degree of Global Navigation Satellite System from Beihang University-Beijing China. He is doctoral student of satellite communication in Beihang University. email id:[email protected].
Rongke Liu, received the B.S. and Ph.D. degrees from Beihang University, Beijing, China, in 1996 and 2002, respectively. He was a Visiting Professor with the Florida Institution of Technology, USA, in 2005; The University of Tokyo, Japan, in 2015; and the University of Edinburgh, U.K., in 2018, respectively. He is currently a Full Professor with the School of Electronics and Information Engineering, Beihang University. He received the support of the New Century Excellent Talents Program from the Minister of Education, China. He has attended many special programs, such as China Terrestrial Digital Broadcast Standard. He has authored/coauthored more than 100 papers in international conferences and journals. email id: [email protected].