Testing gridded NWS 1-day observed precipitation
analysis in a daily irrigation scheduler
Gretchen F. Sassenrath1*, J. M. Schneider2, A. M. Schmidt3, J. Q. Corbitt4,
J. M. Halloran5, R. Prabhu6
1
Southeast Agricultural Research Center, Kansas State University, Parsons, USA;
*
Corresponding Author:
2
USDA Agricultural Research Service, Grazinglands Research Laboratory, El Reno, USA
3
Biological Systems Engineering, University of Nebraska, Lincoln, USA
4
USDA Agricultural Research Service, Crop Production Systems Research Unit, Stoneville, USA
5
USDA Agricultural Research Service, New England Plant, Soil and Water Research Laboratory, University of Maine, Orono, USA
6
Department of Agricultural and Biological Engineering, Mississippi State University, Mississippi, USA
Received 1 October 2013; revised 2 November 2013; accepted 16 November 2013
Copyright © 2013 Gretchen F. Sassenrath et al. This is an open access article distributed under the Creative Commons Attribution License, which permits unrestricted use, distribution, and reproduction in any medium, provided the original work is properly cited.
ABSTRACT
One of the inputs required by daily decision support tools for scheduling irrigation is the amount of water supplied by rainfall. In-field measurements of daily precipitation are expen- sive or laborious, while measurements from gauges within a few kilometers are frequently not representative due to the high spatiotempo- ral variability of precipitation. Online radar- based precipitation analyses from NOAA’s Na- tional Weather Service (NWS) have obvious po- tential to provide the needed data, but are known to have varying degrees of accuracy with loca- tion and conditions. The NWS precipitation analysis is computed on a 4 km × 4 km grid, so differences should also be expected between the product and individual gauge measurements under each grid cell. In order to test the utility of the NWS precipitation analysis in a daily irriga- tion scheduler, daily data were gathered in July 2012 from 18 weather stations under 2 NWS pre- capitation analysis grid cells across instru- mented research and production fields in the Mississippi Delta. Differences between individ- ual station measurements and the NWS precipi- tation analysis are examined, and root-zone daily soil water deficits computed using both station data and the NWS precipitation analysis. Sub-grid spatial variability between gauge loca- tions, and differences in precipitation between gauges and the gridded NWS analysis, are found to be similar to those reported elsewhere. Dif-
ferences between time series of soil water deficit computed using the two different precipitation data sources are noted, but prove to be of lim- ited impact on the decision to irrigate or not to irrigate. It is also noted that profile-filling rain- falls limit the impact of accumulating error, re- setting the modeled soil water to “full”. Given the Delta-local practice of irrigating to replace full evapotranspirational water used, use of the NWS daily precipitation analysis data as input for a daily irrigation scheduler is judged not only acceptable, but also preferable to other sources of daily precipitation data.
Keywords:Irrigation; Daily; Precipitation; Scheduler; Gridded; Radar
1. INTRODUCTION
Mississippi currently enjoys plentiful ground water re- sources and rainfall in excess of 1 m per year. However, producers are increasingly reliant on supplemental irriga- tion to improve yields and profits [1]. This has resulted in a greater use of ground water, and a noted decline in the Mississippi River Valley alluvial aquifer of 300,000 acre feet of water per year for the past 10 years [2]. In neighboring states, serious groundwater depletion threat- ens future cropping options [3].
and a concomitant increase in intensity [4]. These chang- es in rainfall patterns decrease the amount of water that enters the soil profile. Moreover, the uncertainty of amount and timing of rainfall makes irrigation scheduling a par- ticular challenge, as a high rainfall event immediately following irrigation can result in waterlogging of the soils that impedes crop growth. The challenge for Mis- sissippi producers is to manage water resources appro- priately, and to provide sufficient water for crop pro- duction through droughty periods of a few weeks that oc- cur during the summer growing season.
While less efficient than sprinkler application, surface (furrow) irrigation accounts for nearly 70% of the irri- gated acres in the Delta region [5]. Irrigation scheduling tools of any kind have not been widely adopted by pro- ducers for a variety of reasons. To improve water man- agement, efforts have been underway to develop an easy to use, readily accessible irrigation scheduling tool for producers [6]. The Mississippi Irrigation Scheduling Tool, MIST, uses a water balance model to determine the cu- mulative soil water balance by summing the previous day’s soil water, less that lost through evapotranspiration, plus rainfall or irrigation [7,8]. As with all model predic- tions, the accuracy of the MIST guidance is dependent on the accuracy of the inputs.
Precipitation is a key input for the water balance equa- tion. Rainfall data is available from a wide range of sources in Mississippi, although the accuracy, spatial rep- resentativeness, and accessibility of the data are extremely limited [9]. To complicate the situation, the “typical” wea- ther patterns of the humid southeast US commonly gen- erate rainfall events that are highly varied spatially and temporally—ranging from high-intensity, rapidly moving storms, to slow stationary fronts. Anecdotal stories ab- ound of farmers standing in sunshine on one side of the turn row, while heavy rain is received in the field across the turn row. As a result of this variability, knowing how much rain fell a few kilometers away tells a producer nothing about how much rain actually fell on local fields on any given day.
Management of large farms in the Mississippi Delta limits the time that producers have for data collection and processing. Field-specific precipitation measure- ments for use in any irrigation-scheduling tool such as MIST would be clearly preferred. However, producers in the Delta have indicated an aversion to having a rain gauge in every field for measuring field-specific rainfall, and to any requirement to gather and enter such informa- tion into an irrigation scheduling tool. As a result, the MIST was designed to run on automated inputs from na- tional and regional databases of soil and weather in- formation [7,8,10-12]. This automated downloading sig- nificantly reduces the time spent by farmers in data col- lection and importation to the model, and is expected to
enhance adoption and use of MIST.
The National Weather Service (NWS) has developed rainfall estimates based on radar and rain gauge data that are readily available and increasingly accurate [11-14]. This gridded precipitation analysis (termed 1-Day Ob- served Precipitation Analysis on their web site, hereafter NWS-PA) is used extensively for hydrologic and model- ing studies in both the operational and research commu- nities, and is essentially an estimate of the average pre- cipitation falling across each grid cell. The accuracy of NWS-PA in comparison to ground-based measurements of rainfall has been tested in several circumstances, both within the grid scale of the precipitation analysis (nomi- nally 4 km × 4 km) [13], and for areas larger than the grid scale [14]. While the reported biases were rather small for data aggregated over years, differences in daily precipitation between NWS-PA values (termed MPE in [13]) and observed precipitation (averaged over 4 rain gauges) were reported to be as large as 2.0 - 2.5 cm/day, albeit improving over successive years (2004-2006) as the algorithms were updated [13].
Beyond the question of accuracy of the NWS-PA pro- duct, each NWS-PA 4 km × 4 km grid cell covers an area of approximately 1600 ha. With an estimated average field size of 60 ha in Mississippi, each grid cell then covers approximately 27 fields. Given the spatially vari- able nature of rainfall, there will necessarily be differ- ences between the NWS-PA and the amount that actually falls on any specific field. The question addressed in this research is one of degree: how severely will the net dif- ferences (due both to inaccuracy and spatial variability) between the NWS-PA and in-field gauge-measured pre- cipitation impact the calculated soil water balance, and the subsequent “irrigate” or “not-irrigate” decision? In short, will use of the NWS-PA in MIST produce incor- rect guidance?
The results of this analysis of the use of NWS-PA in an irrigation scheduler for the Mississippi Delta are ex- pected to be relevant to irrigation scheduling in all humid, high-rainfall areas in the US during the summer grow- ing season.
2. DATA AND METHODS
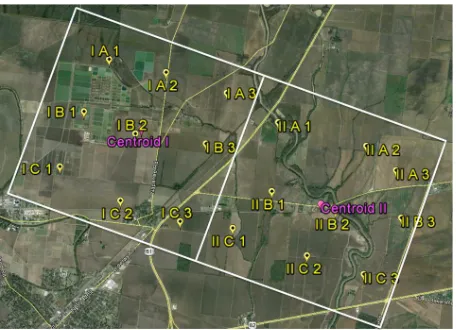
Figure 1. Sampling position of NWS-PA 4 km × 4 km grid cells near Stoneville, MS (lower left corner of image), with grid centroids (pink balloons), and rain gauge locations (yel- low balloons) and enumeration indicated.
locations were established within each grid for collection of rainfall data for a total of 18 sampling locations. Stra- tusTM RG202 cm rain gauges (Fergus Falls, MN) were placed on 0.6 m posts at locations evenly dispersed throughout each grid, with placement chosen to give a good representative coverage of the study area. Gauge positions were adjusted as needed to accommodate land use, crops and structures, and to ensure access following a heavy rainfall. The resulting 9 gauges per NWS-PA grid cell was denser sampling than that used by [13], where there were 4 gauges within each cell. Each rain gauge spatial position was recorded, and together with daily rainfall was transferred to data analysis software for analysis. Rain gauges were read between 6 and 8 am each day to coincide with the NWS-PA [11].
Daily soil water balance was calculated using MIST [7, 8,10]. Water use is determined in MIST using the stan- dard Penman-Monteith equation to calculate reference evapotranspiration (ETo) from daily measurements of
maximum and minimum temperature, solar radiation, wind speed, and relative humidity. The daily crop eva- potranspiration (ETc) is then calculated by multiplying
ETo by a crop-specific coefficient [15]. The daily soil
water balance, WBt, the water available in the soil for
plant uptake, was calculated for each day over the month as:
t y c u
WB WB ET Rain Irr (1)
where WBy is the soil water balance yesterday; ETc is the
daily crop evapotranspiration; Rainu is crop-usable frac-
tion of rainfall; and Irr is the amount of irrigation water applied.
3. RESULTS
After assessing the data quality of the field observa-
tions, and frequency of rain events during July 2012, it was decided to continue with subsequent analysis. This single month of data is not sufficient to reach any con- clusions relative to the quality or representativeness of the NWS-PA data. Instead, our focus is on checking whether the gauge and NWS-PA data are consistent with results from more substantive studies in the region, then subsequently on assessing the impacts of using the NWS- PA data as a substitute for daily in-field rain gauge data in MIST.
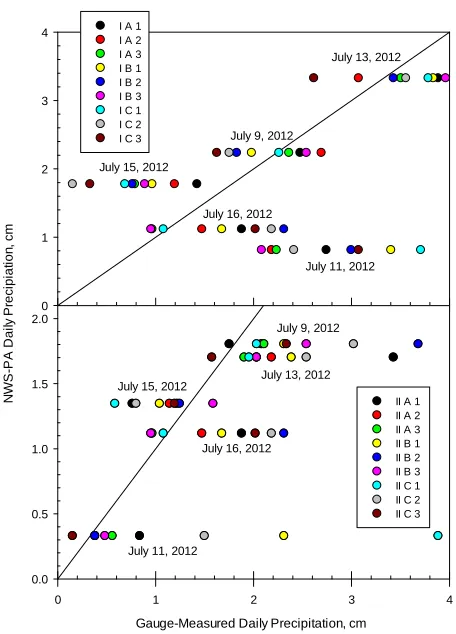
As expected, substantial spatial variability in precipi- tation was observed between rain gauge locations. Fig- ure 2 shows daily total precipitation from each rain gauge from 5 of the rainy days in July 2012, plotted separately for the two grid cells. Gauge-measured pre- cipitation varied across locations within a grid cell by as little as 1.0 cm, to as much as 3.74 cm (on July 11). The spread across gauges in total rainfall on July 11 appears to have been the result of one or more small but heavily precipitating storms, and is an example of the spatial scale issues associated with convective precipitation that prompted this study. Such conditions can lead to rela- tively large errors in NWS-PA [13], and may explain the relatively small NWS-PA values for July 11, 2012 over these two cells.
Note that while some of the gauge-measured values were centered around the NWS-PA value, other rain events were markedly offset in magnitude. The amount of variation between gauge measurements was not con- sistent between events, and did not depend on amount of rain received.
To determine if any obvious spatial or directional bias existed during July 2012 between the gauge-measured and NWS-PA rainfall amounts within these two grid cells, linear distance from the grid centroid and angular direc- tion from the grid centroid (north = 0) were determined for each rain gauge location. Differences between gauge- measured and NWS-PA rainfall amounts for each of seven consecutive days (including those shown in Figure 2) are plotted against linear distance and angular direc- tion from the two centroids in Figure 3. With the excep- tion of July 11, there are no obvious net biases with ei- ther distance or direction from grid centroid across these seven days.
N
W
S-PA
Da
ily
P
re
c
ip
ia
ti
o
n
,
c
m
0 1 2 3
4 I A 1
I A 2 I A 3 I B 1 I B 2 I B 3 I C 1 I C 2
I C 3 July 9, 2012
July 11, 2012 July 13, 2012
July 15, 2012
July 16, 2012
Gauge-Measured Daily Precipitation, cm
0 1 2 3 4
0.0 0.5 1.0 1.5 2.0
II A 1 II A 2 II A 3 II B 1 II B 2 II B 3 II C 1 II C 2 II C 3
July 11, 2012
July 16, 2012 July 15, 2012
July 9, 2012
[image:4.595.58.286.81.398.2]July 13, 2012
Figure 2. Comparison of daily total gauge-measured versus NWS-PA precipitation under two grid cells near Stoneville, MS for 5 rainy days in July 2012. Lines on each plot indicate 1:1 correspondence.
Figure 3. Error is calculated as the difference between the gauge-measurement and the NWS-PA, where a positive dif- ference indicates that NWS-PA was smaller than gauge-meas- ured daily precipitation.
Figure 4. Error calculated in the same manner as in Figure 3, but for the total rainfall reported for July 2012.
NWS-PA totals tended to be smaller than the gauge totals, a result that is again consistent with previous results [13]. However, no spatial dependence on direction or distance from grid centroid is observed for this single month. In summary, both the NWS-PA and rain gauge data display the expected characteristics.
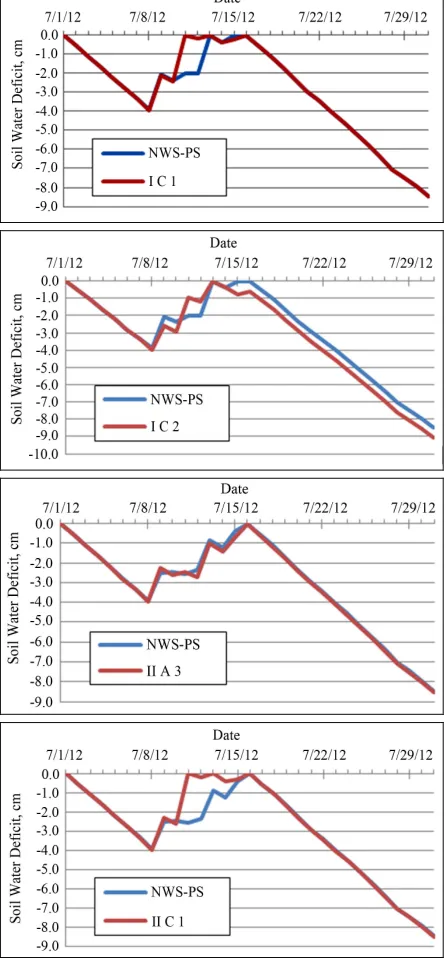
To assess the net impact of using NWS-PA as input for MIST, the model was run for each rain gauge location, adjusted for specific crop (e.g., corn or soybeans) and planting date using both the gauge measurements of pre- cipitation and the NWS-PA for the encompassing grid cell. Daily time series of soil water deficit for each of the 18 locations were generated; examples of the best and worst match between modeled soil water deficits are presented for each of the two grid cells in Figure 5.
[image:4.595.309.539.84.338.2]Somewhat surprisingly, although a substantial error existed between gauge-measured and NWS-PA precipita- tion on some days at some sites, there was limited impact on the MIST-modeled soil water deficit. The worst mod- eled single-day difference was on July 11 at gauge II C1, with a difference of 2.6 cm in soil water deficit (fourth panel in Figure 5). The best match (smallest maximum difference on any single day) was at II A3 (third panel in Figure 5). For all other sites, the maximum one-day dif- ference in modeled soil water deficit ranged between 0.5 and 2.0 cm, with all of the maximum errors for grid cell I occurring on July 11. For grid cell II, the dates for max- imum difference occurred during July 9-13.
[image:4.595.57.289.452.688.2]Figure 5. Time series of MIST predictions of daily soil water deficit in the rooting zone calculated with both the NWS-PA (blue line) and rain gauge measurements (red line) for 4 rain gauge locations.
the irrigation decision (on July 29), with a net result of only a one-day delay in irrigation. This lack of impact indicates that the precipitation errors were not suffi- ciently large to dominate the daily MIST calculations when the soil water column is partially filled. But more importantly, this study makes it clear that cumulative errors are removed from the running MIST calculations whenever sufficient rainfall refills the soil water column, effectively resetting the soil water balance to “full”.
As a final check on the impacts of differences in the soil water deficit predictions by MIST due to use of NWS-PA instead of field-specific rain gauge data, the month-total cumulative soil water depletion was calcu- lated for each site, for a variety of irrigated crops and crop stages prevalent in July in the Mississippi Delta. Corn typically has high transpiration during July, making significant demands on water within the rooting zone. Mid-(April) and late-planted (May) soybeans have rela- tively high transpiration rates, although not as great as corn. Early-planted soybeans are beginning to senesce in July, so exhibit sharply lower transpirational water de- mand. MIST predictions were also calculated using the daily average of all rain gauge measurements within each grid, a value expected to be close to the NWS-PA.
Figure 6 shows the month-cumulative differences for different crops and crop stages for two of the gauge loca- tions (I C2 and II B1), as well as the grid-averaged gauge precipitation measurements. Site II B1 had one of the larger single day differences on July 11 (2.1 cm), so is included as an example of the impact of a large single- day error. And while Site I C2 had the single-day lowest modeled difference, it was also the one location where the MIST-calculated soil water deficit differences (about 0.7 cm) persisted until the end of the month throughout a dry-down period, producing the single error in irrigation guidance during this month-long test.
The monthly grid-averaged gauge totals closely track the NWS-PA totals. The month-totals for the two indi- vidual locations suggest that month-cumulative errors of less than 1.0 cm can be expected while using NWS-PA as input for MIST during summer months, less than 1/3 of
[image:5.595.324.526.477.675.2]the corresponding month-total precipitation differences.
4. CONCLUSIONS
Substitution of NWS-PA for in-field rain gauge data has less of an impact than expected on the daily soil wa- ter deficit calculations, as well as the associated irrigate/ no-irrigate guidance provided by MIST. Sub-grid spatio- temporal variability in July precipitation in Mississippi has a negative impact on the accuracy of NWS-PA rela- tive to rain gauge readings, and on subsequent daily soil water deficit calculations, but the magnitude of the dif- ferences during the test period only changed the irrigate/ no-irrigate decision at one site (out of 18) on one day in the month of testing. It is also apparent that any rainfall or irrigation that refills the soil water profile (typical ir- rigation practice in Mississippi) resets the MIST calcula- tions of soil water deficit to zero, removing any cumula- tive impact of use of NWS-PA instead of in-field rain gauge data.
Given the scarcity of readily accessible, quality-con- trolled, in-field rain gauge measurements, the NWS-PA is judged to be a viable, even preferable, alternative for use in MIST. This result should apply in all humid, high- rainfall areas of the US.
However, note that this result does not necessarily ap- ply for farmers practicing deficit irrigation, in which the soil water profile is not completely replenished. Consid- eration of the size of the daily error in soil water deficit, due to use of NWS-PA, would need to be factored into the decision-making process of a deficit-irrigation sched- uler. Consequently, use of MIST with NWS-PA input is not recommended for those practicing deficit irrigation until and unless further evaluation across several sum- mers is conducted, similar to that reported here, and MIST is explicitly modified to include the results.
Given the success noted here, NWS-PA should be con- sidered and tested as input for daily irrigation schedulers wherever NWS radar coverage is relatively complete (east of the Rocky Mountains, and western CA and WA), and in-field rain gauges are scarce. Simple adjustments in the algorithm for deciding whether or not to irrigate may be possible to limit any negative impacts from use of the NWS-PA data.
5. ACKNOWLEDGEMENTS
We thank the Mississippi Soybean Promotion Board and the Missis- sippi Corn Promotion Board for financial support for this research.
Contribution No. 14-109-J from the Kansas Agricultural Experiment Station.
REFERENCES
[1] Evett, S., Carman, D. and Bucks, D. (2003) Expansion of
irrigation in the mid-south United States: Water allocation and research issues. Proceedings of the 2nd International Conference on Irrigation and Drainage, Water for a Sus- tainable World—Limited Supplies and Expanding De- mand, Phoenix, 12-15 May 2003, pp. 247-260.
[2] Powers, S. (2007) Agricultural water use in the Missis- sippi Delta.
http://www.ymd.org/pdfs/wateruse/Agricultural%20Wate r%20Use%20Presentation.pdf
[3] Bennett, D. (2002) Balancing demands for water. Delta Farm Press, Clarksdale.
http://deltafarmpress.com/news/farming_balancing_dema nds_water/index.html
[4] Soil and Water Conservation Society (2003) Conservation implications of climate change: Soil erosion and runoff from croplands. Soil and Water Conservation Society, Ankeny.
[5] National Agricultural Statistics Service (2007) Census of agriculture. http://www.nass.usda.gov
[6] Sassenrath, G.F., Schmidt, A.M., Schneider, J.M., Tagert, M.L., Corbitt, J.Q., van Riessen, H., Crumpton, J., Rice, B., Thornton, R., Prabhu, R., Pote, J. and Wax, C. (2013) Development of the Mississippi irrigation scheduling tool —MIST. ASABE Annual International Meeting, Kansas City, 21-23 July 2013, Paper No. 131619807
[7] Bronner, I. (2005) Irrigation scheduling: The water bal- ance approach. Colorado State University Extension. [8] Sassenrath, G.F., Pringle, H.C., Fisher, D.K., Samson, S.,
Schmidt, A.M. and Shrestha, B. (2010) Development of irrigation scheduling tools for the humid, high-rainfall environment of the Lower Mississippi Delta. 5th National Decennial Irrigation Proceedings, Phoenix, 5-8 Decem- ber 2010, Paper Number: IFF10-9797.
[9] Sassenrath, G.F., Schneider, J.M., Schmidt, A.M. and Sil- va, A.M. (2012) Quality assurance of weather parameters for determining daily evapotranspiration in the humid growing environment of the Mid-South. Mississippi Aca- demy of Science, 57, 178-192.
[10] Schmidt, A.M., Sassenrath, G.F., Crumpton, J., Corbitt, J.Q., Rice, B., van Riessen, H., Thornton, R., Prabhu, R., Pote, J., Wax, C. and Tagert, M.L. (2013) Development and delivery of educational tools for irrigation water man- agement and on-farm implementation of the Mississippi Irrigation Scheduling Tool (MIST). ASABE Annual Inter- national Meeting, Kansas City, 21-23 July 2013, Paper No. 131620243.
[11] NOAA National Weather Service (2013) About the NWS precip analysis.
http://water.weather.gov/precip/about.php
[12] NOAA National Weather Service (2013) Precipitation shapefile download.
http://www.srh.noaa.gov/ridge2/RFC_Precip/index.php?si te=pub
[13] Habib, E., Larson, B.F. and Graschel, J. (2009) Validation of NEXRAD multisensory precipitation estimates using an experimental dense rain gauge network in south Lou- isiana. Journal of Hydrology, 373, 463-478.
[14] Dyer, J. (2009) Evaluation of surface and radar-estimated precipitation data sources over the Lower Mississippi Ri- ver alluvial plain. Physical Geography, 30, 430-452.